| REPORT ATTRIBUTE |
DETAILS |
| Historical Period |
2020-2023 |
| Base Year |
2024 |
| Forecast Period |
2025-2032 |
| Policy Management Software Market Size 2024 |
USD 1,971.13 million |
| Policy Management Software Market, CAGR |
9.39% |
| Policy Management Software Market Size 2032 |
USD 4,021.72 million |
Market Overview:
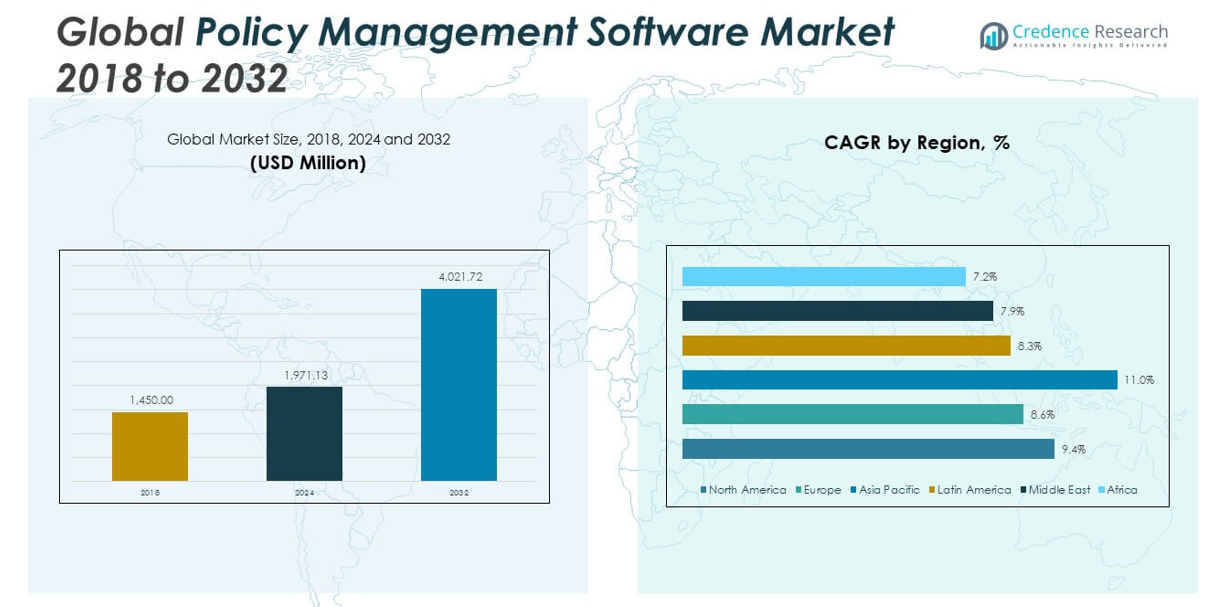
The Global Policy Management Software Market size was valued at USD 1,450.00 million in 2018 to USD 1,971.13 million in 2024 and is anticipated to reach USD 4,021.72 million by 2032, at a CAGR of 9.39% during the forecast period.
Several key drivers are fueling the growth of the global policy management software market. The increasing complexity and volume of regulations across industries have made it difficult for organizations to manage policies manually or through legacy systems. Policy management software helps centralize documentation, automate compliance tracking, and ensure real-time updates to policies and procedures, thereby minimizing non-compliance risks. The rise in cyber threats and growing importance of data governance have further elevated the role of policy enforcement tools in ensuring information security and privacy compliance. Cloud-based deployment models have gained popularity due to their scalability, cost-effectiveness, and ease of access across remote or hybrid work environments. With global workforces becoming more distributed, companies need agile tools to standardize policy dissemination, employee acknowledgment tracking, and audit documentation. Technological innovation is another growth catalyst. Advanced platforms now include features like AI-powered policy recommendations, automated workflows, and analytics dashboards that offer actionable insights into compliance performance.
Regionally, North America leads the global policy management software market. The region’s leadership is driven by high regulatory demands, digital maturity, and the presence of key software vendors. Industries in the U.S., including healthcare, BFSI, and energy, face stringent compliance requirements under frameworks such as HIPAA, SOX, and FERC, prompting widespread adoption of policy automation solutions. Europe follows closely, where regulations like the General Data Protection Regulation (GDPR), the Digital Services Act, and corporate sustainability reporting requirements are compelling organizations to adopt centralized policy management systems. Western European countries, particularly Germany, France, and the UK, are seeing increased software adoption in both public and private sectors. The Asia-Pacific region represents the fastest-growing market, driven by rapid digitization, rising regulatory standards, and increased spending on enterprise risk management infrastructure in countries such as India, China, Japan, and Australia. Government-backed digital transformation initiatives and growing investments in financial services and healthcare are accelerating the adoption of policy management tools in the region. Latin America and the Middle East & Africa are also witnessing a gradual rise in demand, supported by improving regulatory frameworks, modernization of public-sector IT systems, and increasing awareness about the benefits of automated compliance solutions.
Market Insights:
- The Global Policy Management Software Market was valued at USD 1,450.00 million in 2018, reached USD 1,971.13 million in 2024, and is projected to reach USD 4,021.72 million by 2032, with strong annual growth.
- Compliance mandates such as HIPAA, SOX, GDPR, and CCPA are key drivers behind the increasing adoption of policy management solutions across healthcare, finance, and data-sensitive sectors.
- Cloud-based platforms are in demand for their scalability, cost-efficiency, and ability to support real-time policy access across remote and hybrid workforce environments.
- Global cyberattacks have significantly increased, prompting organizations to invest in policy software that enables breach response readiness, internal control enforcement, and data privacy compliance.
- Enterprises are reducing administrative workload and enhancing audit preparedness by automating policy creation, approval cycles, and tracking using integrated software tools.
- Implementation complexity rises when integrating with legacy IT systems, often increasing deployment timelines and costs due to customization and lack of interoperability.
- North America is the current market leader by value, while Asia-Pacific is witnessing the fastest growth, driven by digitization efforts and evolving regulatory infrastructure in countries like India and China.
Access crucial information at unmatched prices!
Request your sample report today & start making informed decisions powered by Credence Research Inc.!
Download Sample
Market Drivers:
Rising Regulatory Complexity and Need for Centralized Compliance:
The increasing volume and complexity of global regulatory frameworks have placed significant pressure on organizations to maintain updated, enforceable policies. Regulatory mandates across industries—such as HIPAA in healthcare, GDPR in Europe, SOX in finance, and ESG reporting standards—require systematic tracking and version control. The Global Policy Management Software Market benefits directly from this demand, offering centralized platforms that streamline documentation, compliance audits, and internal policy communication. Manual policy handling leaves businesses vulnerable to non-compliance and reputational damage. Enterprises are adopting software solutions to ensure policy accessibility, employee acknowledgment tracking, and automatic policy updates across distributed workforces. Regulatory risk mitigation remains a top priority for compliance officers, further driving adoption.
- For instance, NAVEX’s PolicyTechplatform is used by over 1,000 organizations globally, including small businesses and large enterprises, to automate policy management.
Growth in Remote Work and Decentralized Organizational Structures:
The shift toward remote and hybrid work models has made centralized policy communication more critical than ever. Organizations now require cloud-based tools that can distribute, update, and track policy compliance in real time, regardless of employee location. The Global Policy Management Software Market responds to this challenge with scalable platforms that offer mobile access, cloud integration, and automated notifications. It supports consistent communication of policies across business units, geographies, and functions. Traditional policy delivery methods have proven inefficient in supporting decentralized operations. Policy management software enables businesses to standardize practices while maintaining flexibility across diverse operational environments.
- For instance, SAI360’s Policy Compliance Managementsoftware is a cloud-native solution that centralizes the entire policy lifecycle, from creation to attestation, and supports multi-language content and regional access controls.
Rising Cybersecurity Threats and Data Privacy Obligations:
Escalating cybersecurity risks and increasing legal scrutiny over data privacy have heightened the importance of clearly defined internal policies. Industries managing sensitive data must enforce protocols that align with evolving standards such as ISO 27001, CCPA, and NIST frameworks. The Global Policy Management Software Market plays a vital role by providing platforms that ensure data protection policies are up-to-date, well-communicated, and auditable. It helps organizations manage employee training, breach response procedures, and access control guidelines through automated workflows. Cyber incidents often stem from policy violations or gaps in awareness, making preventive enforcement critical. Policy software supports proactive governance by ensuring compliance is embedded in daily operations.
Enterprise Demand for Operational Efficiency and Audit Readiness:
Companies are under pressure to streamline internal processes while maintaining transparency and compliance. Policy management software enables automation of policy creation, approval, dissemination, and review cycles, significantly reducing administrative burden. The Global Policy Management Software Market meets this need by integrating with enterprise systems such as HR, legal, and IT infrastructure to deliver cohesive compliance management. It enhances operational efficiency while supporting real-time reporting and audit preparation. Organizations use these platforms to create audit trails and generate compliance metrics that meet internal and external reporting standards. Efficient policy workflows lead to cost savings, improved accountability, and better alignment with strategic objectives.
Market Trends:
Adoption of AI-Powered Automation and Intelligent Workflows:
Vendors are increasingly embedding artificial intelligence and machine learning capabilities into policy management platforms. These tools automate policy drafting, detect outdated content, and suggest updates based on evolving regulatory changes. AI also supports advanced analytics that identify user behavior trends, policy engagement gaps, and areas of non-compliance. The Global Policy Management Software Market is evolving toward intelligent workflows that reduce manual intervention while improving decision accuracy. It enables faster policy lifecycle management and enhances the ability to scale compliance programs across complex organizations. Predictive analytics and rule-based engines are becoming integral features in next-generation solutions.
- For instance, LogicGate’s Risk Cloudplatform integrates OpenAI technology to automate policy generation, review, and approval workflows. This AI-powered system enables organizations to quickly draft policy documents, automate evidence collection, and accelerate compliance processes.
Integration with Broader Governance, Risk, and Compliance (GRC) Platforms:
Organizations are looking to unify policy management with other GRC functions for better visibility and efficiency. Vendors are responding by offering policy tools that seamlessly integrate with incident management, audit tracking, and risk assessment modules. The Global Policy Management Software Market is aligning with this trend by positioning policy software as a core component of enterprise GRC ecosystems. It supports organizations in managing interconnected compliance responsibilities through a single interface. This integration reduces redundancies and enables more coherent reporting across compliance departments. Interoperability with business intelligence and ERP platforms is also gaining importance.
- For instance, MetricStream’s Connected GRCplatform is deployed by major enterprises worldwide and offers integrated modules for policy, risk, audit, and compliance management.
Increased Focus on User Experience and Interface Simplicity:
Modern policy management platforms emphasize intuitive design and user-friendly interfaces to encourage organization-wide engagement. Businesses recognize that user adoption directly impacts compliance performance and policy effectiveness. The Global Policy Management Software Market reflects this shift by offering mobile-friendly interfaces, multilingual support, and simplified policy navigation features. It allows employees at all levels to easily access, understand, and act on policies relevant to their roles. Software vendors are investing in interactive dashboards and visual policy maps to improve accessibility and engagement. Ease of use is now a competitive differentiator among providers.
Customization and Industry-Specific Policy Frameworks Gain Traction:
Enterprises are seeking solutions tailored to their unique regulatory and operational environments. Vendors are developing industry-specific templates, workflows, and reporting tools for sectors such as healthcare, finance, insurance, and energy. The Global Policy Management Software Market is moving toward modular platforms that allow users to configure policy libraries and compliance metrics based on sector requirements. It gives companies the flexibility to scale and adapt policies without extensive IT intervention. Industry-aligned solutions shorten deployment timelines and reduce compliance risks by aligning software with relevant regulations from the outset. Demand for configurable, sector-focused platforms is rising across mid-size and large enterprises.
Market Challenges Analysis:
Complex Integration with Legacy Systems and Disconnected Processes:
One of the major challenges in the Global Policy Management Software Market is the difficulty of integrating modern platforms with existing legacy systems. Many organizations operate with outdated infrastructure and siloed departments, making it hard to standardize policy workflows across business units. The lack of interoperability between policy tools and core systems like HR, ERP, and legal databases hinders automation and visibility. It often requires significant customization and IT support, which increases implementation time and cost. Smaller firms with limited technical resources face greater hurdles in deploying fully integrated solutions. These integration challenges reduce operational efficiency and may discourage adoption, particularly among traditional or resource-constrained enterprises.
User Adoption and Change Management Limit Implementation Success:
Organizations often underestimate the internal change management required to implement policy management software effectively. Employees may resist new tools or fail to engage with platform features, limiting the software’s ability to improve compliance outcomes. The Global Policy Management Software Market must address the human factor, where low user participation undermines system value. It depends on continuous training, leadership support, and communication strategies to encourage adoption. Lack of clarity around policy ownership and accountability can further complicate platform utilization. Vendors need to deliver not only technical capabilities but also onboarding support and user-centric design to ensure long-term success.
Market Opportunities:
Expansion Across Small and Medium Enterprises Through Scalable Cloud Solutions:
The growing availability of cloud-based, subscription-driven models presents a significant opportunity for vendors to target small and medium-sized enterprises (SMEs). These businesses often lack the resources for complex compliance infrastructure but still face increasing regulatory pressure. The Global Policy Management Software Market can scale its offerings through modular platforms and simplified deployment, making advanced compliance tools accessible to smaller organizations. It can leverage low upfront investment models, rapid onboarding, and mobile accessibility to capture demand from cost-sensitive sectors. As SMEs digitize operations, the need for streamlined policy workflows and automated documentation grows rapidly. This creates a strong entry point for SaaS providers in emerging and underserved markets.
Sector-Specific Solutions for High-Growth Regulated Industries:
Industries such as healthcare, fintech, education, and energy are undergoing rapid regulatory transformation, creating demand for specialized compliance tools. The Global Policy Management Software Market can capitalize on this by offering industry-specific templates, certifications, and analytics that align with sector regulations. It can strengthen its value proposition by addressing niche needs such as clinical policy management, financial audit tracking, or environmental compliance reporting. Companies operating in regulated environments seek tailored solutions that reduce risk exposure and simplify audits. Focused solutions enhance adoption rates and create long-term partnerships with compliance-driven clients.
Market Segmentation Analysis:
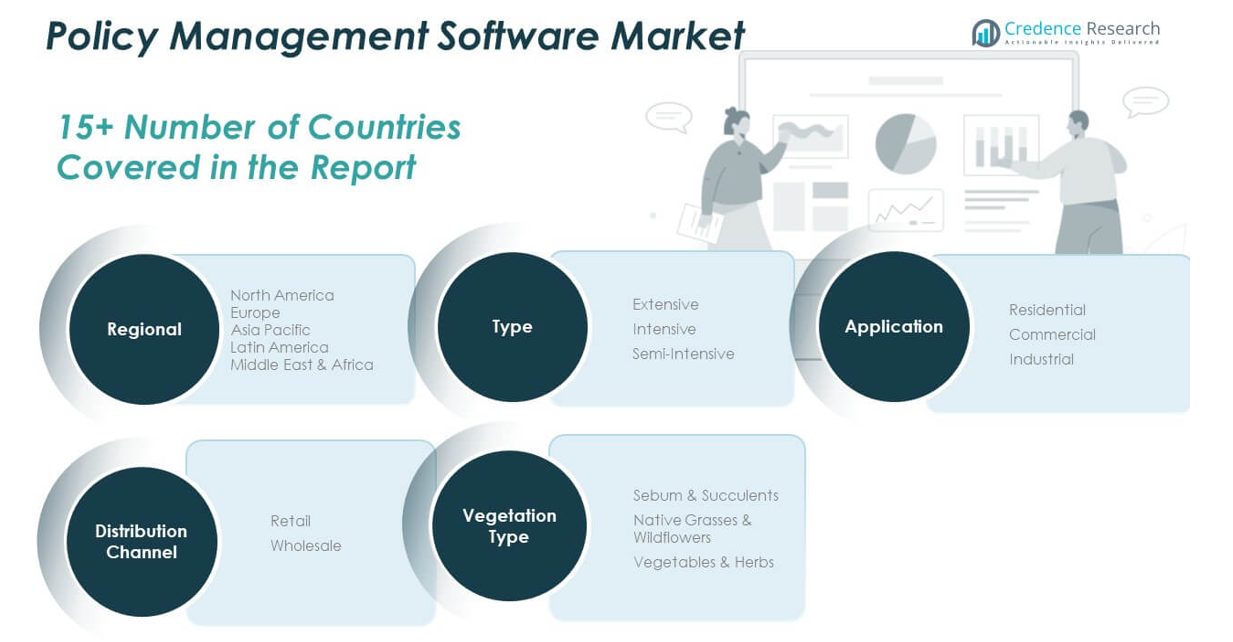
By Component
The market is divided into Solution and Service segments. The solution segment accounts for the larger revenue share due to rising adoption of centralized platforms for automated policy creation, approval, and tracking. The service segment includes implementation, support, consulting, and training services, which are essential for successful deployment and user adoption across industries.
- For instance, ConvergePoint’s Policy Managementsolution provides a centralized library for policy storage and version control, automated workflows for policy review and approval, and configurable dashboards for audit readiness.
By Deployment Type
Cloud-based policy management solutions are gaining momentum due to their flexibility, scalability, and suitability for hybrid and remote work environments. Organizations prefer cloud deployment to enable real-time updates and accessibility. On-premise solutions remain relevant, particularly in highly regulated industries such as defense and government, where data control and system customization are critical.
- For instance, PowerDMSis a cloud-based policy management platform used by over 300 organizations, including large healthcare and government entities. The platform offers secure, real-time access to policy documents and supports organizations with 50 to over 10,000 employees.
By Enterprise Size
Large enterprises dominate the market given their complex compliance requirements, higher risk exposure, and ability to invest in integrated policy platforms. Small and medium enterprises (SMEs) are increasingly adopting cloud-based policy tools to reduce manual workload, improve transparency, and ensure regulatory compliance with limited internal resources.
By Industry Vertical
The BFSI sector leads due to heavy regulatory oversight. IT and telecom companies demand scalable solutions to manage internal governance across global operations. Energy and utilities focus on environmental and safety compliance. Healthcare relies on policy software for HIPAA and data privacy. Government and defense require consistent policy enforcement aligned with national standards. Manufacturing uses it for operational uniformity, while retail implements these tools to manage workforce compliance and consumer protection regulations.
Segmentation:
By Component
By Deployment Type
By Enterprise Size
- Large Enterprise
- Small and Medium Enterprise
By Industry Vertical
- BFSI
- IT and Telecom
- Energy and Utilities
- Healthcare
- Government and Defense
- Manufacturing
- Retail
By Region
- North America
- Europe
- Germany
- France
- U.K.
- Italy
- Spain
- Rest of Europe
- Asia Pacific
- China
- Japan
- India
- South Korea
- South-east Asia
- Rest of Asia Pacific
- Latin America
- Brazil
- Argentina
- Rest of Latin America
- Middle East & Africa
- GCC Countries
- South Africa
- Rest of the Middle East and Africa
Regional Analysis:
North America
The North America Policy Management Software Market size was valued at USD 613.35 million in 2018 to USD 825.10 million in 2024 and is anticipated to reach USD 1,681.49 million by 2032, at a CAGR of 9.4% during the forecast period. North America holds the largest share in the Global Policy Management Software Market, driven by stringent regulatory frameworks such as HIPAA, SOX, and FERC. It benefits from mature digital infrastructure, high compliance awareness, and widespread adoption of governance technologies across sectors. The United States leads regional demand, particularly in healthcare, BFSI, and energy industries. Enterprises prioritize real-time compliance tracking, cloud-based deployments, and advanced analytics capabilities. The presence of leading vendors and robust regulatory enforcement continues to fuel market expansion.
Europe
The Europe Policy Management Software Market size was valued at USD 373.81 million in 2018 to USD 488.00 million in 2024 and is anticipated to reach USD 939.28 million by 2032, at a CAGR of 8.6% during the forecast period. Europe ranks second in market share due to strong policy enforcement mandates under GDPR, the Digital Services Act, and corporate sustainability disclosure rules. Countries like Germany, France, and the UK are adopting centralized policy platforms across public and private sectors. The market sees consistent growth in finance, telecom, and manufacturing verticals. Enterprises seek tools that support multilingual communication, audit readiness, and cross-border compliance. Local and EU-wide data protection laws continue to shape software demand.
Asia Pacific
The Asia Pacific Policy Management Software Market size was valued at USD 295.08 million in 2018 to USD 422.50 million in 2024 and is anticipated to reach USD 968.43 million by 2032, at a CAGR of 11.0% during the forecast period. It represents the fastest-growing region in the Global Policy Management Software Market. Rapid digitization, expanding enterprise IT infrastructure, and evolving data governance standards drive demand across India, China, Japan, and Australia. Governments support digital transformation and regulatory modernization in finance and healthcare sectors. Enterprises adopt policy tools to align with data privacy frameworks and internal controls. Demand continues to rise as organizations prioritize risk mitigation and policy automation.
Latin America
The Latin America Policy Management Software Market size was valued at USD 82.36 million in 2018 to USD 110.76 million in 2024 and is anticipated to reach USD 207.80 million by 2032, at a CAGR of 8.3% during the forecast period. The region is experiencing steady growth, driven by compliance modernization efforts across Brazil, Argentina, and Chile. Public and private enterprises are investing in IT systems to support policy enforcement and internal auditing. The BFSI and energy sectors show increased adoption, aligning with regional governance reforms. Enterprises seek scalable tools to ensure employee training, document control, and version tracking. Cloud adoption is supporting implementation across distributed business operations.
Middle East
The Middle East Policy Management Software Market size was valued at USD 50.03 million in 2018 to USD 63.26 million in 2024 and is anticipated to reach USD 115.04 million by 2032, at a CAGR of 7.9% during the forecast period. Demand is rising across Gulf countries and Israel, where digital transformation agendas are driving software deployment in finance, oil & gas, and government sectors. Organizations are adopting policy tools to meet evolving cybersecurity regulations and workforce standardization requirements. Regional cloud infrastructure improvements are facilitating remote policy access and real-time compliance updates. Market growth is also supported by expanding regulatory oversight and risk governance frameworks.
Africa
The Africa Policy Management Software Market size was valued at USD 35.38 million in 2018 to USD 61.51 million in 2024 and is anticipated to reach USD 109.67 million by 2032, at a CAGR of 7.2% during the forecast period. Market development is gradually improving with growing awareness of regulatory compliance and digital governance. South Africa, Egypt, and Nigeria are leading adoption across banking, telecom, and public-sector organizations. Enterprises are seeking affordable, cloud-based tools to manage employee compliance and policy version control. Increasing investment in IT modernization and data protection laws is creating new opportunities. Implementation remains slower in some regions due to infrastructure limitations and budget constraints.
Shape Your Report to Specific Countries or Regions & Enjoy 30% Off!
Key Player Analysis:
- Amdocs
- Comarch SA
- ConvergePoint Inc
- Huawei Technologies Co. Ltd.
- Intracom Telecom
- Juniper Networks Inc.
- LogicGate Inc
- Mitratech
- NAVEX Global Inc
- WorkflowFirst LLC
Competitive Analysis:
The Global Policy Management Software Market features a competitive mix of established enterprise software providers and specialized compliance solution vendors. Major players such as IBM, NAVEX Global, MetricStream, SAI Global, and LogicManager dominate with comprehensive platforms that integrate with broader GRC systems. It remains moderately fragmented, allowing newer entrants to compete by offering agile, cloud-based, and industry-specific solutions. Leading vendors invest in AI, automation, and user experience enhancements to differentiate their offerings. Strategic acquisitions and partnerships help expand geographic reach and product capabilities. Smaller firms target niche sectors with tailored functionalities, while larger companies focus on scalability and global compliance integration. The market rewards providers that balance technical sophistication with ease of deployment and responsive support. Competitive intensity continues to increase as organizations across all sizes and sectors prioritize compliance modernization, creating demand for flexible and future-ready policy management platforms.
Recent Developments:
- In June 2025, LogicGate Inc introduced new automation features in its Risk Cloud Policy Management Solution. The latest updates include record access automation using user groups, scoped assessments with custom layouts, and job condition enhancements for streamlined policy workflow automation. These features provide organizations with more detailed access control, flexible policy review processes, and improved compliance tracking.
- In June 2025, Mitratech enhanced its PolicyHub platform with new export capabilities for scanned notices and improved access management for government documents. The update allows organizations to configure default user access for uploaded documents, automate document distribution, and maintain centralized control over policy-related records, supporting compliance in legal and highly regulated sectors.
- In February 2025, Amdocs unveiled CES25, the next-generation Customer Experience Suite, at the Mobile World Congress. CES25 is powered by the amAIz suite, which integrates generative AI, advanced data analytics, and modular AI/ML capabilities to automate policy management, network operations, and customer experience workflows. This suite enables service providers to rapidly launch new policy-driven services, enhance compliance, and streamline business processes across cloud environments.
Market Concentration & Characteristics:
The Global Policy Management Software Market shows moderate market concentration, with a mix of dominant enterprise software providers and emerging niche players. It features characteristics such as rapid innovation, demand for cloud-native platforms, and increasing focus on user-centric design. Vendors compete on the basis of integration capabilities, regulatory coverage, scalability, and industry-specific configurations. The market favors providers that offer modular, configurable solutions aligned with evolving compliance frameworks across sectors. It continues to attract investment as digital transformation and regulatory complexity drive adoption across both large enterprises and small to mid-sized businesses. Buyers seek platforms that deliver efficiency, audit readiness, and adaptability within hybrid and remote work environments.
Report Coverage:
The research report offers an in-depth analysis based on component, deployment type, enterprise size, and industry vertical. It details leading market players, providing an overview of their business, product offerings, investments, revenue streams, and key applications. Additionally, the report includes insights into the competitive environment, SWOT analysis, current market trends, as well as the primary drivers and constraints. Furthermore, it discusses various factors that have driven market expansion in recent years. The report also explores market dynamics, regulatory scenarios, and technological advancements that are shaping the industry. It assesses the impact of external factors and global economic changes on market growth. Lastly, it provides strategic recommendations for new entrants and established companies to navigate the complexities of the market.
Future Outlook:
- The market will expand steadily, driven by increasing global regulatory requirements across all major industries.
- Cloud-native platforms will dominate new deployments, offering scalability and remote access across decentralized workforces.
- AI and machine learning integration will enhance automation, policy recommendations, and compliance analytics.
- Demand from small and mid-sized enterprises will rise due to cost-effective SaaS models and simplified onboarding.
- Industry-specific solutions will gain traction, particularly in healthcare, financial services, education, and energy.
- Integration with broader GRC, HR, and ERP systems will become a standard requirement for enterprise buyers.
- Mobile accessibility and multilingual interfaces will improve user adoption in global and field-based operations.
- Vendors will focus on customizable workflows and user experience to strengthen retention and competitive edge.
- Emerging markets in Asia-Pacific and Latin America will offer new growth avenues amid increasing regulatory maturity.
- Data privacy, cybersecurity mandates, and ESG compliance will continue to expand the scope of policy management tools.


