Market Overview:
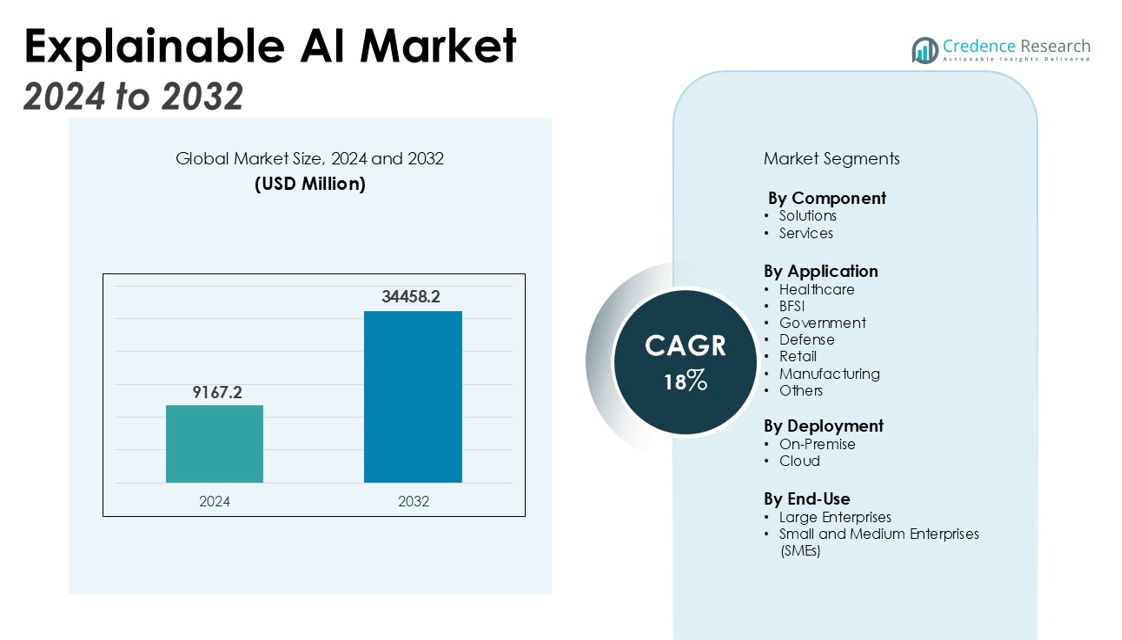
The Explainable AI Market size was valued at USD 9167.2 million in 2024 and is anticipated to reach USD 34458.2 million by 2032, at a CAGR of 18% during the forecast period (2024-2032).
| REPORT ATTRIBUTE |
DETAILS |
| Historical Period |
2020-2023 |
| Base Year |
2024 |
| Forecast Period |
2025-2032 |
| Explainable AI Market Size 2024 |
USD 9167.2 million |
| Explainable AI Market, CAGR |
18% |
| Explainable AI Market Size 2032 |
USD 34458.2 million |
Growth is fueled by stricter regulatory requirements for AI transparency and accountability, including global initiatives promoting ethical and responsible AI. The increasing complexity of AI models has created a greater need for interpretability tools that build trust, support debugging, ensure fairness, and align with compliance standards. Adoption is accelerating in healthcare, finance, and anomaly detection, where organizations require AI systems that offer clear, auditable, and justifiable outputs. The integration of Explainable AI into government services and public-sector decision-making is also gaining momentum, further broadening its application scope.
North America holds the largest market share, driven by advanced AI research capabilities, early policy frameworks, and strong enterprise adoption. Asia Pacific is emerging as the fastest-growing region due to rapid digital transformation and substantial investments in AI infrastructure. Europe continues to expand its presence in the market, supported by stringent ethical AI guidelines and a strong focus on responsible deployment across industries.
Market Insights:
- The Explainable AI Market is valued at USD 9,167.2 million and is expected to reach USD 34,458.2 million, reflecting strong global adoption and long-term growth potential.
- Regulatory mandates such as the EU AI Act and GDPR are accelerating demand for explainability tools to ensure transparency, compliance, and ethical AI deployment.
- Rising complexity of deep learning and large language models is driving the need for interpretability solutions that maintain accuracy while clarifying decision logic.
- High-risk industries including healthcare, finance, and defense are leading adoption due to the need for traceable, fair, and accountable AI-driven outcomes.
- The market faces challenges from high implementation costs, technical barriers, and the absence of standardized frameworks for integrating explainability into AI systems.
- North America holds a 41% share, supported by strong research capabilities, early policy adoption, and deep enterprise integration of XAI.
- Europe accounts for 29% of the market, while Asia Pacific holds 21% and leads in growth through rapid digital transformation, government-backed AI programs, and expanding regional innovation.
Access crucial information at unmatched prices!
Request your sample report today & start making informed decisions powered by Credence Research Inc.!
Download Sample
Market Drivers:
Regulatory Push for AI Transparency and Accountability
Stringent global regulations are a primary driver for the Explainable AI Market, with frameworks such as the EU AI Act and GDPR mandating transparency in automated decision-making. Governments and industry bodies are enforcing policies that require AI models to offer explainable, auditable, and ethical outputs. This regulatory pressure compels enterprises to invest in explainability tools to ensure compliance and avoid legal or reputational risks. It strengthens the position of XAI as a critical component in responsible AI adoption.
- For instance, to help enterprises meet these standards, IBM developed the AI Explainability 360 open-source toolkit, providing developers with 10 state-of-the-art algorithms to make complex machine learning models more transparent.
Rising Complexity of AI Models and Need for Interpretability
The growing sophistication of deep learning and large language models has increased the demand for interpretability. The Explainable AI Market benefits from organizations seeking solutions to make complex algorithms understandable to stakeholders and regulators. It enables better debugging, model optimization, and performance validation, which are essential in high-stakes applications. This capability ensures that AI decisions can be trusted and aligned with organizational objectives.
Sector-Specific Adoption in High-Risk Industries
Industries such as healthcare, finance, and defense are accelerating adoption due to the high impact of AI-driven decisions in these domains. The Explainable AI Market addresses critical needs such as traceability in medical diagnostics, compliance in financial risk assessment, and accountability in defense systems. It supports the deployment of AI where errors or biases can lead to significant consequences. This sectoral demand is reinforcing the market’s growth trajectory.
- For instance, Lockheed Martin showcased its progress in this area by demonstrating 5 distinct AI-enabled capabilities at the Yuma Proving Ground, including crewed-uncrewed teaming and real-time data fusion for improved battlefield decision-making.
Integration with AI Governance and Ethical AI Initiatives
Global focus on ethical AI has placed explainability at the center of AI governance strategies. The Explainable AI Market aligns with initiatives promoting fairness, bias mitigation, and social accountability in automated systems. It empowers organizations to demonstrate responsible AI usage to stakeholders and customers. This integration enhances trust, strengthens brand reputation, and expands the scope of AI applications across industries.
Market Trends:
Integration of XAI into Enterprise AI Workflows
The Explainable AI Market is witnessing a shift toward embedding explainability directly into enterprise AI development and deployment pipelines. Organizations are moving beyond stand-alone interpretability tools to adopt integrated platforms that combine model building, monitoring, and transparency features. It enables data scientists, compliance teams, and decision-makers to access explanations in real time, enhancing operational efficiency and trust. Enterprises are prioritizing solutions that support multi-modal AI, covering text, image, and structured data outputs. This trend aligns with the growing need to manage AI risks while accelerating innovation cycles. The adoption of cloud-based explainability solutions is also expanding, offering scalability and easier integration into existing digital infrastructure.
- For instance, the Microsoft Azure Multimodal AI & LLM Processing Accelerator, which handles text, image, audio, and video data, can be fully deployed into a company’s infrastructure in just 7 minutes to automate tasks like data extraction and classification.
Advancement in XAI Techniques and Automation Capabilities
The Explainable AI Market is advancing through the development of more sophisticated techniques, including counterfactual explanations, feature attribution methods, and causal inference models. It is driving the evolution from static post-hoc analysis to dynamic, interactive explanation systems that adapt to user needs. Vendors are focusing on automating compliance reporting and bias detection to reduce manual oversight and improve accuracy. The incorporation of natural language generation for explanation delivery is making AI insights more accessible to non-technical users. This capability is particularly valuable in regulated industries where decision justification is critical. Industry collaborations between AI developers, regulatory bodies, and academia are further accelerating innovation in XAI methodologies.
- For instance, SAP’s Joule AI copilot is now integrated with at least 1 other major platform, Microsoft 365 Copilot, allowing users to interact seamlessly with enterprise data across both systems using natural language queries, thereby streamlining complex business workflows.
Market Challenges Analysis:
Balancing Model Performance with Interpretability
The Explainable AI Market faces the challenge of maintaining high model accuracy while delivering transparent explanations. Complex deep learning models often sacrifice interpretability for performance, creating a trade-off that slows adoption in critical applications. It requires advanced methods that can clarify decision logic without oversimplifying or reducing predictive power. Achieving this balance is difficult in industries like healthcare and finance, where both precision and accountability are non-negotiable. Vendors must continuously innovate to bridge this gap and meet diverse stakeholder needs. The lack of standardized frameworks further complicates the integration of explainability into existing AI systems.
High Implementation Costs and Technical Barriers
The Explainable AI Market encounters barriers related to the cost and complexity of deployment. It demands specialized expertise, computational resources, and integration capabilities that are not readily available to all organizations. Smaller enterprises often struggle to justify investments without clear short-term returns. The diversity of AI models and data types also makes creating universal explainability solutions challenging. Limited awareness of the technology’s benefits among decision-makers restricts broader adoption. These factors collectively slow market penetration, particularly in regions with lower AI maturity.
Market Opportunities:
Expanding Role in Regulated and High-Stakes Industries
The Explainable AI Market has significant growth potential in sectors where decision transparency is critical, such as healthcare, finance, insurance, and government services. It can support compliance with strict regulations while enabling organizations to justify AI-driven outcomes to regulators and stakeholders. The ability to detect and mitigate bias strengthens its relevance in socially sensitive applications. Increasing adoption in medical diagnostics, fraud detection, and public policy decision-making creates opportunities for tailored XAI solutions. Vendors offering industry-specific interpretability frameworks stand to gain a competitive advantage. The rising demand for accountable AI systems positions XAI as an essential component of future AI strategies.
Integration with Emerging AI Technologies and Platforms
The Explainable AI Market can leverage opportunities from advancements in generative AI, autonomous systems, and multi-modal AI. It can enhance user trust by providing clear reasoning for AI outputs across text, image, and sensor-based data applications. Cloud-based deployment models offer scalability and lower barriers to entry, opening doors for adoption among small and medium-sized enterprises. Collaboration between AI developers, academic institutions, and regulatory bodies can accelerate innovation and standardization. Expanding into edge AI environments presents potential for real-time interpretability in IoT and autonomous vehicle systems. These developments create pathways for XAI to become a default feature in next-generation AI platforms.
Market Segmentation Analysis:
By Component
The Explainable AI Market is divided into solutions and services. Solutions hold a substantial share, driven by the demand for integrated interpretability frameworks in AI development environments. It enables enterprises to implement model transparency features that support compliance, bias detection, and performance monitoring. Services, including consulting, integration, and training, are also gaining momentum as organizations seek specialized expertise to embed explainability into workflows and meet industry-specific regulations.
- For instance, AI consulting firms guide clients through all stages of AI adoption, from building a strategy to final deployment. N-iX provides these specialized services with a team of over 200 AI and data professionals.
By Application
The Explainable AI Market spans healthcare, BFSI, government, defense, retail, manufacturing, and others. Healthcare leads adoption due to the necessity of transparency in diagnostics, treatment planning, and patient risk assessment. It is widely utilized in BFSI for fraud detection, credit scoring, and ensuring adherence to regulatory requirements. Government and defense sectors use XAI to enhance accountability in critical decision-making, while retail and manufacturing leverage it to optimize operational insights and supply chain performance.
- For instance, the U.S. Department of Homeland Security’s “Operation Renewed Hope” used AI with facial recognition, leading to the probable identification of 311 previously unknown victims of child exploitation.
By Deployment
The Explainable AI Market is segmented into on-premise and cloud-based deployment models. On-premise solutions are favored by organizations managing sensitive data and operating under stringent compliance mandates. Cloud deployment is expanding rapidly, offering scalability, cost efficiency, and seamless integration with modern AI platforms. It enables industries to deploy explainable models faster and adapt to evolving operational requirements, positioning cloud solutions as a major growth driver.
Segmentations:
By Component
By Application
- Healthcare
- BFSI
- Government
- Defense
- Retail
- Manufacturing
- Others
By Deployment
By End-Use
- Large Enterprises
- Small and Medium Enterprises (SMEs)
By Region
- North America
- Europe
- UK
- France
- Germany
- Italy
- Spain
- Russia
- Belgium
- Netherlands
- Austria
- Sweden
- Poland
- Denmark
- Switzerland
- Rest of Europe
- Asia Pacific
- China
- Japan
- South Korea
- India
- Australia
- Thailand
- Indonesia
- Vietnam
- Malaysia
- Philippines
- Taiwan
- Rest of Asia Pacific
- Latin America
- Brazil
- Argentina
- Peru
- Chile
- Colombia
- Rest of Latin America
- Middle East
- UAE
- KSA
- Israel
- Turkey
- Iran
- Rest of Middle East
- Africa
- Egypt
- Nigeria
- Algeria
- Morocco
- Rest of Africa
Regional Analysis:
North America: Leadership Driven by Innovation and Regulation
The Explainable AI Market in North America holds the largest share at 41%, supported by a strong AI research ecosystem, advanced technology infrastructure, and proactive regulatory measures. It benefits from early adoption of AI governance frameworks and a high concentration of leading AI solution providers. The region’s enterprises invest heavily in explainability tools to ensure compliance with evolving legal standards and to strengthen customer trust. Financial services, healthcare, and defense sectors are at the forefront of adoption, given the critical nature of their decision-making processes. Strategic collaborations between technology companies, universities, and government agencies further reinforce the region’s leadership position.
Europe: Growth Underpinned by Ethical AI Mandates
The Explainable AI Market in Europe accounts for 29% of the global share, driven by stringent data protection laws and ethical AI initiatives. It aligns closely with the European Union’s AI Act, which mandates transparency and accountability in automated systems. Organizations across industries are integrating explainability features to meet compliance requirements and enhance operational transparency. Adoption is particularly strong in finance, manufacturing, and public administration. The emphasis on bias detection and fairness in AI decision-making creates a fertile environment for innovation in XAI solutions. Collaborative research programs and funding support from the EU are accelerating market development.
Asia Pacific: Rapid Expansion Through Digital Transformation
The Explainable AI Market in Asia Pacific holds a 21% share and is the fastest-growing region, supported by large-scale investments in AI infrastructure and rapid digitalization. It is driven by government-led AI initiatives in countries such as China, Japan, India, and South Korea, aimed at boosting technological self-reliance and competitiveness. The integration of XAI in industries like healthcare, manufacturing, and smart city development is gaining momentum. Local technology firms are collaborating with global vendors to develop region-specific solutions that address language, cultural, and regulatory differences. The combination of rising AI adoption rates and expanding enterprise awareness positions Asia Pacific as a key growth engine for the market.
Shape Your Report to Specific Countries or Regions & Enjoy 30% Off!
Key Player Analysis:
Competitive Analysis:
The Explainable AI Market is characterized by a competitive landscape with the presence of established technology companies, emerging AI startups, and niche solution providers. Leading players focus on enhancing interpretability frameworks, bias detection capabilities, and integration with enterprise AI workflows to strengthen their market position. It is witnessing strategic partnerships between AI developers, cloud service providers, and regulatory bodies to accelerate innovation and compliance readiness. Companies are investing in research to develop advanced methods such as counterfactual explanations, feature attribution models, and causal inference techniques. Competition is also driven by the ability to deliver scalable, user-friendly solutions that address industry-specific requirements in healthcare, finance, defense, and government. Vendors are differentiating through domain expertise, robust security features, and the ability to provide real-time, actionable explanations. The market’s competitive intensity is expected to rise as organizations prioritize transparency, accountability, and trust in AI-driven decision-making.
Recent Developments:
- In March 2024, Amelia launched its “Amelia Answers” platform, a knowledge AI feature designed to improve enterprise digital experiences through a combination of generative and deterministic AI.
- In July 2025, DarwinAI was announced that Hold Me Ltd. signed a binding letter of intent to acquire Synthetic Darwin LLC, also known as DarwinAI, which specializes in AI agents for blockchain technology.
- In May 2025, DataRobot began a collaboration with NVIDIA to speed up the creation of agentic AI applications by making NVIDIA’s AI Enterprise software available within the DataRobot platform.
Market Concentration & Characteristics:
The Explainable AI Market demonstrates moderate to high concentration, with a mix of global technology leaders and specialized AI solution providers shaping its competitive structure. It is characterized by rapid technological advancements, strong regulatory influence, and increasing demand across high-stakes industries. Large enterprises dominate adoption, leveraging their resources to integrate explainability into complex AI workflows, while smaller players target niche applications with agile, customizable solutions. The market shows a strong emphasis on research-driven innovation, with companies investing in advanced interpretability techniques and automation capabilities. Strategic alliances, mergers, and collaborations are common, aimed at expanding portfolios and meeting evolving compliance requirements. The competitive environment favors vendors that can deliver scalable, industry-specific solutions while ensuring accuracy, fairness, and trust in AI-driven outcomes.
Report Coverage:
The research report offers an in-depth analysis based on Component, Application, Deployment, End-Use and Region. It details leading market players, providing an overview of their business, product offerings, investments, revenue streams, and key applications. Additionally, the report includes insights into the competitive environment, SWOT analysis, current market trends, as well as the primary drivers and constraints. Furthermore, it discusses various factors that have driven market expansion in recent years. The report also explores market dynamics, regulatory scenarios, and technological advancements that are shaping the industry. It assesses the impact of external factors and global economic changes on market growth. Lastly, it provides strategic recommendations for new entrants and established companies to navigate the complexities of the market.
Future Outlook:
- The Explainable AI Market will expand its role in regulated sectors such as healthcare, finance, and defense, where decision transparency is critical.
- Integration of explainability into generative AI models will enhance trust and adoption in creative and high-stakes applications.
- Advancements in automated bias detection and compliance reporting will reduce manual oversight and accelerate implementation.
- Cloud-based deployment will gain momentum, enabling scalable and cost-efficient access to explainability tools for organizations of all sizes.
- Collaboration between technology vendors, academia, and regulatory bodies will drive innovation and establish global standards.
- Demand for multi-modal explainability covering text, image, and sensor-based data will rise across diverse industries.
- Real-time interpretability for edge AI and IoT applications will become increasingly important for operational decision-making.
- Expansion into public-sector services will strengthen accountability and improve trust in AI-driven governance.
- Vendors will focus on delivering industry-specific frameworks that address unique compliance and operational needs.
- Growing enterprise awareness of ethical AI will position explainability as a default requirement in future AI solutions.


