
Market Overview
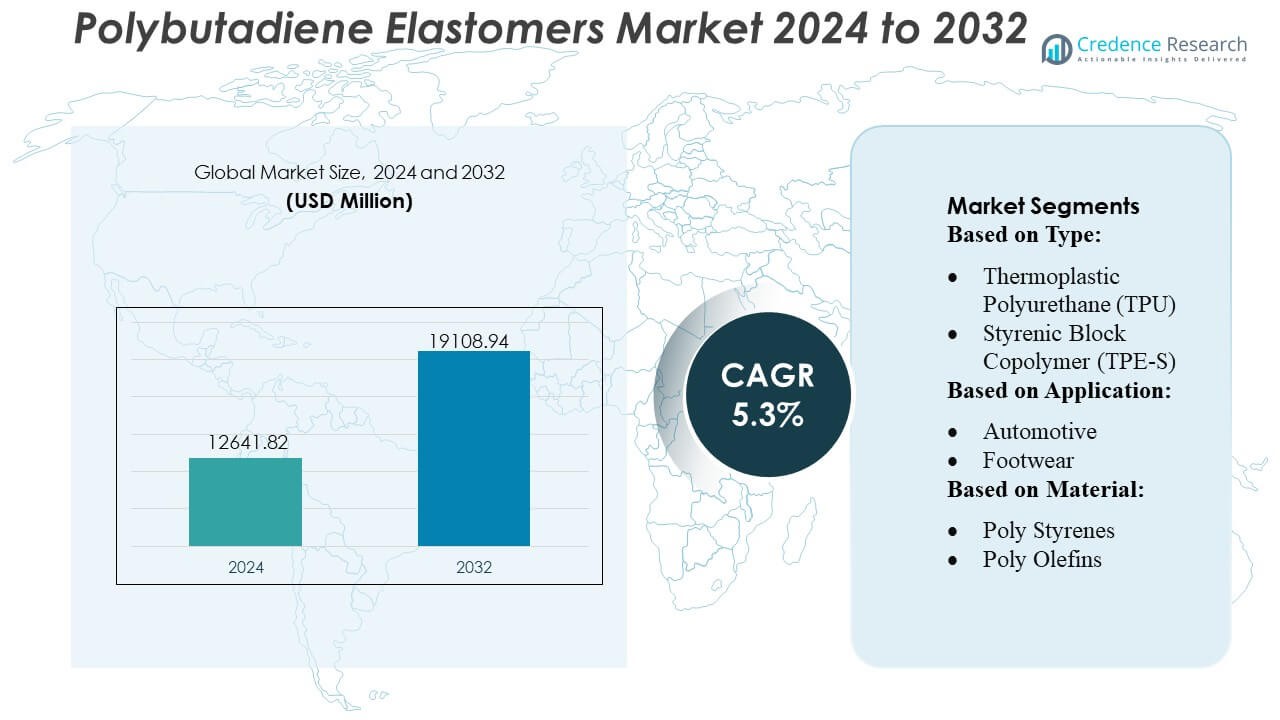
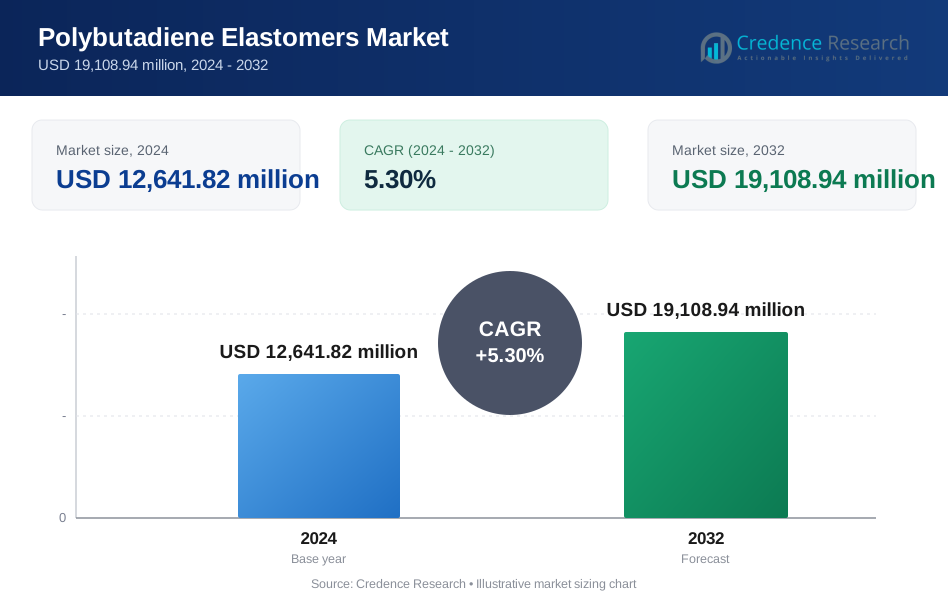
Polybutadiene Elastomers Market size was valued USD 12641.82 million in 2024 and is anticipated to reach USD 19108.94 million by 2032, at a CAGR of 5.3% during the forecast period.
| REPORT ATTRIBUTE | DETAILS |
|---|---|
| Historical Period | 2020-2023 |
| Base Year | 2024 |
| Forecast Period | 2025-2032 |
| Polybutadiene Elastomers Market Size 2024 | USD 12641.82 Million |
| Polybutadiene Elastomers Market, CAGR | 5.3% |
| Polybutadiene Elastomers Market Size 2032 | USD 19108.94 Million |
The Polybutadiene Elastomers Market is shaped by a mix of global elastomer producers and specialized polymer manufacturers that compete through high-cis, solution-grade, and neodymium-catalyzed product innovations. Leading companies focus on improving mechanical performance, advancing catalyst efficiency, and expanding sustainable feedstock adoption to strengthen their competitiveness across tire, automotive, and industrial applications. Strategic investments in production capacity, R&D, and regional supply integration further support market expansion. Asia-Pacific leads the global market with an exact 42% share, driven by its large tire manufacturing base, extensive petrochemical infrastructure, and strong demand from automotive and industrial rubber sectors.
Market Insights
- The market reached USD 12641.82 million in 2024 and is expected to hit USD 19108.94 million by 2032, registering a 3% CAGR, supported by rising consumption in tire, automotive, and polymer-modification applications.
- Strong demand for high-cis and solution-grade elastomers acts as a key driver, driven by the need for low rolling-resistance materials and improved mechanical performance in premium tire formulations.
- Market trends emphasize catalyst innovation, sustainable feedstocks, and production efficiency, with manufacturers optimizing neodymium-based systems for consistent molecular architecture.
- Competitive activity intensifies as global producers expand capacity, enhance technical service capabilities, and strengthen integration across raw material supply chains while addressing feedstock price volatility.
- Asia-Pacific holds 42% share, maintaining leadership due to large-scale tire production, while solution-grade elastomers account for the dominant product share as industries adopt higher-performance synthetic rubber solutions.
 Market Segmentation Analysis:
By Type
The Polybutadiene Elastomers Market is led by Styrenic Block Copolymer (TPE-S), holding an estimated 34% market share, driven by its superior elasticity, ease of processing, and suitability for mass-production applications. TPE-S benefits from strong adoption in consumer goods, automotive interiors, and adhesive formulations due to its consistent performance and cost-efficiency. Thermoplastic Polyurethane (TPU) and Thermoplastic Vulcanizates (TPE-V) gain traction in high-performance environments requiring abrasion resistance and durability. Growth in elastomeric alloys and thermoplastic copolyesters reflects increasing demand for lightweight materials that support OEM sustainability and fuel-efficiency goals.
- For instance, Neodymium-catalyzed BR generally has the highest cis-1,4 content (often cited as >98%) among various catalysts, leading to superior mechanical properties, high elasticity, and low heat build-up.
By Application
The automotive segment dominates with approximately 38% market share, supported by rising demand for high-impact, heat-resistant elastomers used in seals, belts, gaskets, and vibration-damping components. Automakers prefer polybutadiene elastomers for their fatigue resistance and ability to enhance long-term mechanical stability. Footwear emerges as another strong application segment, benefiting from high rebound properties and cushioning performance. Wires and cables continue to adopt polybutadiene-based compounds for insulation flexibility, while construction applications expand steadily due to increasing use in sealants, expansion joints, and weather-resistant coatings.
- For instance, Buna® CB25 compounds typically have a tensile strength in the range of 15-19 MPa and a 23°C rebound value of around 30-37% when compounded and vulcanized in a standard formulation (not above 70%).
By Material
Poly Styrenes lead the market with an estimated 32% share, driven by their broad compatibility with styrene-butadiene systems and widespread use across automotive, consumer goods, and electrical applications. Their ability to deliver high impact resistance, good dimensional stability, and cost-effective processing strengthens dominance in high-volume manufacturing. Poly Olefins and Poly Urethanes show growing demand due to their lightweight characteristics and durability, while Poly Amides and Poly Esters gain momentum in engineering applications requiring thermal stability and enhanced mechanical strength. Poly Ether Imides remain niche yet essential for advanced, high-temperature performance environments.
Key Growth Drivers
Rising Demand from Tire Manufacturing
Tire manufacturing remains the strongest growth driver as polybutadiene elastomers deliver high resilience, low rolling resistance, and superior abrasion resistance that enhance tire durability and fuel efficiency. Automotive OEMs and tire manufacturers increasingly adopt high-cis and solution-grade polybutadiene to meet performance and sustainability requirements. Growing global vehicle production, expanding replacement tire demand, and stricter energy-efficiency regulations amplify consumption across both passenger and commercial segments. Rapid electrification further accelerates use because EVs require lower rolling-resistance materials to optimize battery range and tread longevity.
- For instance, Asahi Kasei manufactures synthetic rubber, including polybutadiene (BR) and S-SBR, for the tire industry to achieve a high-level balance of braking, fuel efficiency, and improving wear resistance. High-cis BR generally achieves a very high cis-1,4 content (often cited as >98% for neodymium-catalyzed versions) leading to superior properties.
Expanding Applications in Industrial Rubber and Polymer Modification
Industrial rubber goods such as belts, hoses, gaskets, and vibration-damping components create strong growth as polybutadiene enhances tensile strength, elasticity, and fatigue resistance. Its compatibility with styrene-butadiene rubber and natural rubber supports broad use in conveyor systems, mining equipment, and manufacturing machinery. Rising demand for impact-resistant plastics, particularly ABS and HIPS, fuels additional consumption because polybutadiene significantly improves toughness and thermal stability. The continued expansion of construction, manufacturing, and consumer goods sectors amplifies the role of polybutadiene as a critical performance-enhancing additive.
- For instance, INEOS (and previously Arlanxeo/LANXESS, whose brands they sometimes use or compare against) deals in polybutadiene rubbers that exhibit the benefits mentioned (low heat build-up, high resilience). Neodymium-catalyzed BR generally achieves very high cis-1,4 content (often cited as >98%). Patents often cite Mooney viscosities for commercial grades in ranges such as 45±5, 55±5, etc., suggesting the 45-55 range is plausible for a commercial product.
Growing Use in Polymer Blends and Advanced Material Engineering
Polybutadiene elastomers are increasingly integrated into advanced polymer blends to improve flexibility, processability, and impact performance in engineered plastics. Packaging, electronics, and automotive interiors rely on these modified polymers to meet lightweighting and durability requirements. Rising adoption of high-performance materials for 3D printing, medical devices, and precision components stimulates demand for controlled-microstructure polybutadienes. Manufacturers benefit from improved consistency and enhanced customization potential enabled by catalyst-based solution polymerization, which supports development of next-generation, high-purity elastomers tailored to specific mechanical and thermal performance needs.
Key Trends & Opportunities
Shift Toward High-Cis and Solution-Grade Polybutadiene
A strong trend centers on rising adoption of high-cis and solution-polymerized polybutadiene due to their superior mechanical strength, reduced heat buildup, and consistent molecular architecture. Tire companies increasingly standardize these grades to meet advanced rolling-resistance and durability requirements. The opportunity lies in expanding solution-grade capacity and improving catalyst systems to create more energy-efficient, low-VOC elastomers. Growth in electric vehicle tires and high-precision industrial rubber products reinforces long-term demand for these premium formulations across mature and emerging markets.
- For instance, LG Chem commercial grade BR9000 (likely related to the BR900 series) which is noted for its extremely low glass transition temperature (Tg) of approximately −105°C (close to the stated −108°C).
Sustainability Opportunities via Bio-Based and Recycled Feedstocks
The shift toward sustainable elastomers creates new opportunities for bio-based butadiene derived from renewable feedstocks such as biomass, ethanol, and biogas. Resin producers and automotive OEMs invest in circular-economy pathways involving recycled-content elastomers and lower-emission polymerization technologies. Companies exploring carbon-negative or carbon-neutral production routes benefit from supportive regulations in Europe and North America. As end-users aim to reduce lifecycle emissions, demand for bio-based polybutadiene and eco-engineered blends grows, opening avenues for green product portfolios and premium-priced sustainable alternatives.
- For instance, LANXESS company has broad, corporate-level targets to reduce overall specific emissions and energy consumption, sometimes by percentage goals like 10%, 25%, or 30%, across their entire operations.
Process Optimization and Advanced Catalyst Innovation
Ongoing innovation in neodymium-based and cobalt-based catalysts enables tighter control over microstructure, cis-content, and molecular weight distribution, supporting production of elastomers with enhanced performance consistency. Manufacturers adopt advanced process automation and continuous-flow polymerization to improve yield and reduce operational costs. The trend supports development of high-precision materials for tires, engineering plastics, and specialty industrial applications. Improved catalyst efficiency and expanded pilot-scale R&D investments create opportunities for customized elastomer grades tailored to niche end-use performance requirements.
Key Challenges
Volatility in Butadiene Feedstock Supply
Feedstock volatility remains a major challenge because butadiene prices fluctuate with crude oil dynamics, refinery operating rates, and supply disruptions in major producing regions. The imbalance between regional supply and rising global demand exposes manufacturers to cost instability, affecting margins and pricing strategies. Periodic shortages, shifting cracker economics, and rising competition from synthetic rubber producers further intensify pressure on supply chains. These factors complicate long-term planning and compel companies to explore diversification strategies such as bio-based alternatives and integrated production models.
Environmental and Regulatory Pressures
Stringent regulatory frameworks concerning VOC emissions, industrial waste, and workplace safety place operational burdens on elastomer manufacturers. Environmental concerns associated with synthetic rubber disposal and microplastic pollution intensify scrutiny from policymakers and end-use industries. Companies face increased compliance costs related to emissions control, energy optimization, and wastewater treatment. As sustainability expectations grow, manufacturers must invest in cleaner polymerization technologies, circular-material pathways, and lower-impact formulations. Failure to adapt may limit market access or reduce competitiveness across tightly regulated regions.
Regional Analysis
North America
North America holds approximately 38% of the global polybutadiene elastomers market, driven by strong demand from tire manufacturing, automotive components, and industrial rubber applications. The region benefits from advanced polymer processing capabilities, high adoption of solution-grade polybutadiene, and steady growth in replacement tire consumption. U.S.-based manufacturers invest in catalyst optimization, sustainable elastomers, and energy-efficient production lines, strengthening product consistency and supply reliability. Growing EV adoption also boosts demand for low rolling-resistance tire materials, positioning the region as a key consumer of high-performance polybutadiene grades.
Europe
Europe accounts for roughly 27% of the market, supported by robust automotive manufacturing, stringent tire-performance regulations, and strong penetration of high-cis polybutadiene formulations. The region places significant emphasis on sustainable and low-emission synthetic rubber, prompting manufacturers to expand investments in bio-based feedstocks and circular polymer initiatives. Germany, France, and Italy serve as leading consumption hubs for impact-modified plastics and industrial rubber goods. Regulatory pressure around vehicle efficiency and emissions accelerates adoption of advanced elastomers tailored for fuel-efficient tire designs, while R&D-driven material innovation sustains long-term market expansion.
Asia-Pacific
Asia-Pacific dominates the global market with an estimated 42% share, anchored by large-scale tire production, expanding automotive output, and strong presence of synthetic rubber manufacturers. China, Japan, South Korea, and India drive consumption across tires, industrial components, and polymer modification applications. Rapid industrialization and infrastructure growth fuel demand for high-resilience rubber products, while rising EV penetration increases adoption of low-rolling-resistance elastomers. Regional manufacturers benefit from competitive feedstock availability, integrated production facilities, and increasing investments in neodymium-catalyst technologies. Strong export-oriented tire manufacturing further consolidates Asia-Pacific’s leadership position.
Latin America
Latin America captures close to 6% of the polybutadiene elastomers market, with demand concentrated in automotive manufacturing, aftermarket tire replacement, and industrial rubber applications. Brazil and Mexico dominate regional consumption due to their sizable vehicle production bases and growing logistics sectors. Expansion of mining, agriculture, and construction industries supports increased use of durable conveyor belts, hoses, and mechanical components. However, macroeconomic fluctuations and inconsistent polymer feedstock availability pose challenges. Ongoing modernization of rubber processing facilities and higher adoption of performance-enhancing elastomer blends reinforce moderate but steady regional growth.
Middle East & Africa (MEA)
The Middle East & Africa region holds an estimated 4% market share, driven by growing petrochemical capacity, infrastructure development, and rising demand for industrial rubber goods. Gulf countries, particularly Saudi Arabia and the UAE, invest in expanding synthetic rubber and butadiene production capabilities to strengthen regional self-sufficiency. Demand for polybutadiene increases across construction, mining, and heavy-equipment sectors due to the material’s abrasion resistance and durability. Despite limited tire manufacturing capacity, ongoing industrial diversification and stronger downstream polymer investments support gradual market expansion across MEA.
Market Segmentations:
By Type:
- Thermoplastic Polyurethane (TPU)
- Styrenic Block Copolymer (TPE-S)
By Application:
- Automotive
- Footwear
By Material:
- Poly Styrenes
- Poly Olefins
By Geography
- North America
- U.S.
- Canada
- Mexico
- Europe
- Germany
- France
- U.K.
- Italy
- Spain
- Rest of Europe
- Asia Pacific
- China
- Japan
- India
- South Korea
- South-east Asia
- Rest of Asia Pacific
- Latin America
- Brazil
- Argentina
- Rest of Latin America
- Middle East & Africa
- GCC Countries
- South Africa
- Rest of the Middle East and Africa
Competitive Landscape
The Polybutadiene Elastomers Market players such as Huntsman Corporation, JSR BST Elastomer Co., Ltd, LANXESS AG, Asahi Kasei Corporation, INEOS, LG Chem, Chemtura Corporation, DuPont de Nemours, Inc., BASF SE, and Mitsui Chemicals, Inc. The Polybutadiene Elastomers Market exhibits a competitive environment characterized by a strong focus on advanced catalyst technologies, production efficiency, and performance-driven material innovation. Manufacturers prioritize high-cis and solution-grade formulations that enhance resilience, abrasion resistance, and low rolling resistance for tire and industrial applications. Companies invest in sustainable feedstock pathways, energy-optimized polymerization systems, and digitalized production processes to strengthen product consistency and operational reliability. Expanding demand from automotive, construction, and engineered plastics sectors encourages continuous capacity upgrades and regional footprint expansion. Competitive strategies increasingly revolve around tailored elastomer grades, technical service capabilities, and long-term supply partnerships with major downstream industries.
Key Player Analysis
- Huntsman Corporation
- JSR BST Elastomer Co., Ltd
- LANXESS AG
- Asahi Kasei Corporation
- INEOS
- LG Chem
- Chemtura Corporation
- DuPont de Nemours, Inc.
- BASF SE
- Mitsui Chemicals, Inc.
Recent Developments
- In May 2025, Elkem expanded its SILCOLEASE recycled silicone range with two new low-carbon elastomers: SILCOLEASE™ RE POLY 11362 and SILCOLEASE™ RE POLY 368. These solvent-free products are designed for release liner applications and boast a 70% lower carbon footprint compared to their non-recycled counterparts.
- In April 2025, BASF introduced its Elastollan FC grade TPU designed for medical tubes and conveyor belts, showcased at CHINAPLAS 2025. The new TPU offers enhanced flexibility, chemical resistance, and biocompatibility. Its Shanghai facility is now GMP-qualified, meeting global medical standards.
- In March 2024, Dow, in partnership with HIUV Materials Technology, launched a new animal-free, POE-based artificial leather for the auto industry, offering softness, color stability, and durability (aging/low-temp resistance), meeting automotive demands for sustainable, high-performance materials, and reducing weight and VOCs compared to PVC leather.
- In February 2024, LANXESS India successfully expanded its Rhenodiv production line in Jhagadia, Gujarat, significantly boosting capacity for water-based, VOC-free tire release agents for Asian markets, underscoring its commitment to sustainability, safety, innovation, and serving the growing regional tire industry.
Report Coverage
The research report offers an in-depth analysis based on Type, Application, Material and Geography. It details leading market players, providing an overview of their business, product offerings, investments, revenue streams, and key applications. Additionally, the report includes insights into the competitive environment, SWOT analysis, current market trends, as well as the primary drivers and constraints. Furthermore, it discusses various factors that have driven market expansion in recent years. The report also explores market dynamics, regulatory scenarios, and technological advancements that are shaping the industry. It assesses the impact of external factors and global economic changes on market growth. Lastly, it provides strategic recommendations for new entrants and established companies to navigate the complexities of the market.
Future Outlook
- The market will experience steady demand growth from tire manufacturing as mobility trends expand globally.
- Adoption of high-cis and solution-grade elastomers will continue to accelerate due to superior mechanical performance.
- EV penetration will drive increased use of low rolling-resistance elastomers in next-generation tire designs.
- Industrial rubber applications will expand as manufacturing, mining, and construction activities strengthen.
- Polymer modification demand will rise as ABS and HIPS producers seek enhanced impact resistance.
- Sustainability initiatives will encourage development of bio-based and lower-emission elastomer grades.
- Catalyst innovation will improve process efficiency and support production of more consistent elastomer structures.
- Asia-Pacific will maintain its leadership position as capacity expansions and automotive output grow.
- Supply-chain integration efforts will increase to reduce feedstock volatility risks.
- Material customization will gain importance as end-use industries seek application-specific elastomer properties.
Request a Free Sample
Fill in your details and we'll send you a free sample report.
- Sample data tables & charts
- Research methodology
Need a Custom Version of This Report?
Tailor the scope, geography, or segments to your exact requirements.
- Custom geography or segment scope
- Direct access to our analyst team
Frequently Asked Questions
What is the current market size for the Polybutadiene Elastomers Market, and what is its projected size in 2032?
At what Compound Annual Growth Rate is the Polybutadiene Elastomers Market projected to grow between 2024 and 2032?
Which Polybutadiene Elastomers Market segment held the largest share in 2024?
What are the primary factors fueling the growth of the Polybutadiene Elastomers Market?
Who are the leading companies in the Polybutadiene Elastomers Market?
Which region commanded the largest share of the Polybutadiene Elastomers Market in 2024?
Table of Content
Chapter 1. Report Introduction
- 1.1 Report Description & Purpose
- 1.1.1 Report Title & Market Definition
- 1.1.2 Unique Selling Propositions (USP) & Key Differentiators
- 1.1.3 Value Proposition for Stakeholders
- 1.2 Research Objectives
- 1.2.1 Market Sizing Objectives (Volume & Revenue)
- 1.2.2 Segmentation Objectives
- 1.2.3 Competitive Intelligence Objectives
- 1.2.4 Forecast & Scenario Objectives
- 1.3 Report Scope
- 1.3.1 Polybutadiene Elastomers Scope – Types & Subtypes Covered
- 1.3.2 Geographic Scope – Regions & Countries Covered
- 1.3.3 Historical Period, Base Year & Forecast Period (2024; forecast to 2032)
- 1.3.4 Inclusions & Exclusions
- 1.4 HS Code & Classification Framework
- 1.5 Currency, Units & Pricing Basis
- 1.6 Target Stakeholders
- 1.7 Limitations & Assumptions
Chapter 2. Executive Summary
- 2.1 Global Polybutadiene Elastomers Market Snapshot
- 2.1.1 Market Size – Historical (2024) & Forecast (2024-2032) (2024: USD 12,641.82 million → 2032: USD 19,108.94 million)
- 2.1.2 Volume & Revenue – Global Totals
- 2.1.3 Key Market Highlights – Top Five Facts
- 2.2 Polybutadiene Elastomers Market Segmentation Snapshot
- 2.2.1 Market Split by Region – 2024 vs. 2032
- 2.3 Competitive Snapshot
- 2.3.1 Top 10 Players by Revenue Share – 2024
- 2.3.2 Top 10 Players by Volume Share – 2024
- 2.3.3 Recent Strategic Developments (18-Month Summary)
- 2.4 Key Investment Highlights & Strategic Conclusions
Chapter 3. Polybutadiene Elastomers Market Dynamics & Industry Analysis
- 3.1 Market Overview & Context
- 3.1.1 Polybutadiene Elastomers Market Position in the Broader Automotive Value Chain
- 3.1.2 OEM vs. Replacement Market Dynamics
- 3.1.3 Market Maturity & Development Stage by Region
- 3.2 Polybutadiene Elastomers Market Drivers
- 3.3 Polybutadiene Elastomers Market Restraints & Challenges
- 3.4 Polybutadiene Elastomers Market Opportunities
- 3.5 Porter's Five Forces Analysis
- 3.5.1 Threat of New Entrants
- 3.5.2 Bargaining Power of Suppliers
- 3.5.3 Bargaining Power of Buyers
- 3.5.4 Threat of Substitutes
- 3.5.5 Competitive Rivalry – Intensity Assessment
- 3.6 Polybutadiene Elastomers Value Chain Analysis
- 3.6.1 Upstream – Raw Material/Input Suppliers
- 3.6.1.1 Raw Material/Input 1
- 3.6.1.2 Raw Material/Input 2
- 3.6.1.3 Raw Material/Input 3
- 3.6.2 Midstream – Production/Manufacturing/Service Delivery
- 3.6.2.1 Production/Process Overview
- 3.6.2.2 Key Facility Locations & Capacity by Manufacturer
- 3.6.3 Downstream – Distribution & End Consumer
- 3.6.3.1 Primary Channel – B2B/OEM
- 3.6.3.2 Secondary Channels – Dealer, Retail, Online, Direct
- 3.6.4 Value Chain Profitability Analysis
- 3.6.1 Upstream – Raw Material/Input Suppliers
- 3.7 PESTEL Analysis
- 3.7.1 Political Factors
- 3.7.2 Economic Factors
- 3.7.3 Social Factors
- 3.7.4 Technological Factors
- 3.7.5 Environmental Factors
- 3.7.6 Legal Factors
- 3.8 Polybutadiene Elastomers Supply Chain Analysis
- 3.8.1 Raw Material/Input Supply Risk Assessment
- 3.8.2 Manufacturing Concentration Risk (Geographic Exposure)
- 3.8.3 Trade Disruption Impact Analysis
- 3.9 Regulatory & Policy Landscape
Note: The regulatory and policy landscape section covers regulations based on their applicability to the market, Polybutadiene Elastomers category, geography, and scope of the study. Only regulatory frameworks with a material impact on operations, compliance, trade, sustainability, or market access are analyzed in detail.
Chapter 4. Key Investment Pockets & Opportunity Analysis
- 4.1 Polybutadiene Elastomers Market Attractiveness Analysis
- 4.1.1 By Region – Investment Attractiveness Matrix (Volume × CAGR)
- 4.2 Absolute Revenue Growth Opportunity
- 4.2.1 By Region – Absolute USD Growth Through 2032
- 4.3 Incremental Volume Opportunity
- 4.3.1 By Region – Incremental Volume Through 2032
- 4.3.2 Segment – Incremental Volume
- 4.4 Emerging Submarket Opportunity Deep Dive (Subject to Applicability)
- 4.5 Emerging Market Opportunity Scorecards
- 4.5.1 United States
- 4.5.2 Europe
- 4.5.3 Asia
- 4.5.4 Middle East & Africa
Note: Emerging Market Opportunity Scorecards will be included based on relevance and strategic importance. Regions listed are indicative and may vary depending on data availability and market dynamics.
Chapter 5. Polybutadiene Elastomers Import-Export Analysis & Trade Flows
- 5.1 Global Trade Overview
- 5.1.1 Global Export Value by Country (2024)
- 5.1.2 Global Export Volume by Country (2024)
- 5.1.3 Global Import Value by Country (2024)
- 5.1.4 Global Import Volume by Country (2024)
- 5.1.5 Net Trade Balance by Country (2024)
- 5.2 Export Analysis – Segment
- 5.2.1 Type 1 (HS Code)
- 5.2.2 Type 2 (HS Code)
- 5.2.3 Type 3 (HS Code)
- 5.2.4 Type 4 (HS Code)
- 5.2.5 Type 5 (HS Code)
- 5.3 Import Analysis – Segment
- 5.3.1 Type 1 (HS Code)
- 5.3.2 Type 2 (HS Code)
- 5.3.3 Type 3 (HS Code)
- 5.3.4 Type 4 (HS Code)
- 5.3.5 Type 5 (HS Code)
- 5.4 Average Unit Trade Prices
- 5.4.1 Average Export Price – Segment & Country
- 5.4.2 Average Import Price – Segment & Source Country
- 5.4.3 Price Trends (2024)
- 5.5 Key Trade Route Analysis
- 5.5.1 Trade Route 1
- 5.5.2 Trade Route 2
- 5.5.3 Trade Route 3
- 5.5.4 Trade Route 4
- 5.5.5 Trade Route 5
- 5.6 Trade Policy Impact Assessment
- 5.6.1 US Anti-Dumping & Section 301 Tariffs
- 5.6.2 EU Customs Union Impact
- 5.6.3 Major Free Trade Agreements
- 5.6.4 USMCA Rules of Origin
Note: Trade policy analysis will be included only where relevant to the Polybutadiene Elastomers market.
Chapter 6. Competitive Landscape & Company Benchmarking
- 6.1 Polybutadiene Elastomers Market Concentration & Structure
- 6.1.1 Herfindahl-Hirschman Index (HHI) – vs. 2024
- 6.1.2 Tier 1, Tier 2 & Tier 3 Market Structure
- 6.1.3 Global, Regional & Local Player Dynamics
- 6.2 Polybutadiene Elastomers Market Share Analysis – 2024
- 6.2.1 Global Revenue Share by Company
- 6.2.2 Global Volume Share by Company
- 6.2.3 Regional Revenue Share
- 6.2.4 Market Share Evolution ( vs. 2024)
- 6.2.5 OEM Segment Share by Company
- 6.2.6 Replacement Segment Share by Company
- 6.3 Production/Delivery Capacity & Facility Analysis
- 6.3.1 Global Installed Capacity
- 6.3.2 Capacity Utilization Rates
- 6.3.3 Production/Output Volume
- 6.3.4 Facility Locations & Capacity Map
- 6.3.5 Planned Capacity Additions
- 6.4 Polybutadiene Elastomers Competitive Benchmarking Matrix
- 6.4.1 Revenue, Volume, CAGR & Profitability Comparison
- 6.4.2 Channel Revenue Mix
- 6.4.3 Geographic Revenue Exposure
- 6.4.4 R&D Intensity
- 6.4.5 Sustainability Maturity
- 6.5 Strategic Developments in Polybutadiene Elastomers (Last 24 Months)
- 6.5.1 Mergers, Acquisitions & Divestments
- 6.5.2 New Polybutadiene Elastomers Launches
- 6.5.3 Facility Expansions
- 6.5.4 Strategic Alliances, Joint Ventures & Partnerships
- 6.5.5 Distribution Expansion & Market Entry
- 6.5.6 Sustainability & ESG Initiatives
- 6.6 Competitive Strategy Mapping
- 6.6.1 Leader, Challenger, Follower & Niche Classification
- 6.6.2 Pricing Strategy Comparison
- 6.6.3 Channel Strategy Matrix
Note: Strategic developments are included based on their materiality and the availability of reliable information.
Chapter 7. Global Polybutadiene Elastomers Market – By Distribution Channel
- 7.1 Segment Overview
- 7.1.1 Volume & Revenue Split by Channel (2024 & 2032)
- 7.1.2 Channel Mix Evolution (2024-2032)
Chapter 8. Regional Market Analysis – Global Overview
- 8.1 Global Regional Overview
- 8.1.1 Regional Volume Share
- 8.1.2 Regional Revenue Share
- 8.1.3 Regional Volume by Region
- 8.1.4 Regional Revenue by Region
- 8.1.5 Regional Forecast Through 2032
- 8.2 Cross-Regional Segment Analysis
- 8.2.1 By Distribution Channel
- 8.2.2 By Brand/Price Tier
Chapter 9. North America Polybutadiene Elastomers Market
- 9.1 United States
- 9.2 Canada
- 9.3 Mexico
Chapter 10. Europe Polybutadiene Elastomers Market
- 10.1 Germany
- 10.2 France
- 10.3 Italy
- 10.4 United Kingdom
- 10.5 Spain
- 10.6 Poland
- 10.7 Russia
- 10.8 Netherlands
- 10.9 Belgium
- 10.10 Sweden
- 10.11 Denmark
- 10.12 Norway
- 10.13 Rest of Europe
Chapter 11. Asia Pacific Polybutadiene Elastomers Market
- 11.1 China
- 11.2 India
- 11.3 Japan
- 11.4 South Korea
- 11.5 Thailand
- 11.6 Indonesia
- 11.7 Vietnam
- 11.8 Malaysia
- 11.9 Australia
- 11.10 Rest of Asia Pacific
Chapter 12. Latin America Polybutadiene Elastomers Market
- 12.1 Brazil
- 12.2 Argentina
- 12.3 Colombia
- 12.4 Chile
- 12.5 Rest of Latin America
Chapter 13. Middle East Polybutadiene Elastomers Market
- 13.1 Saudi Arabia
- 13.2 United Arab Emirates
- 13.3 Turkey
- 13.4 Israel
- 13.5 Iran
- 13.6 Rest of the Middle East
Chapter 14. Africa Polybutadiene Elastomers Market
- 14.1 South Africa
- 14.2 Egypt
- 14.3 Nigeria
- 14.4 Morocco
- 14.5 Rest of Africa
Chapter 15. Polybutadiene Elastomers Company Profiles
- 15.1 [Company 01]
- 15.1.1 Company Overview
- 15.1.2 Key Management Personnel
- 15.1.3 Products & Services Portfolio
- 15.1.4 Financial Performance
- 15.1.5 Key Market Focus & Geographic Presence
- 15.1.6 Recent Developments & Strategic Initiatives
Note: The company profile list is preliminary and may change based on research findings, market developments, data availability, and client requirements.
Chapter 16. Appendices
- Appendix A – List of Abbreviations & Acronyms
- Appendix B – Industry Classification Code Reference – Full Series
- Appendix C – Production & Capacity Data Tables
- Appendix D – End-Use & Demand Base Tables
- Appendix E – Consumption & Replacement Rate Assumptions
- Appendix F – ASP Reference Tables
- Appendix G – Manufacturing & Facility Database
- Appendix H – Import-Export Data Tables
- Appendix I – Regulatory Summary Tables
- Appendix J – Primary Research Participant List (Anonymized)
- Appendix K – Primary Research Questionnaire Framework
- Appendix L – Data Sources & Bibliography
- Appendix M – Market Size Divergence & Source Comparison
Chapter 17. Research Methodology
- 17.1 Research Framework & Philosophy
- 17.2 Secondary Research – Sources, Hierarchy & Data Extraction
- 17.3 Data Modeling – Bottom-Up & Top-Down Market Sizing
- 17.4 Primary Research – Stakeholder Framework, LOI & Sample Sizes
- 17.5 Forecast Methodology – Regression, Scenario & Sensitivity Analysis
- 17.6 Quality Control – Four-Layer Validation Framework
- 17.7 Limitations & Standard Assumptions
- 17.8 Disclaimer
