
Market Overview
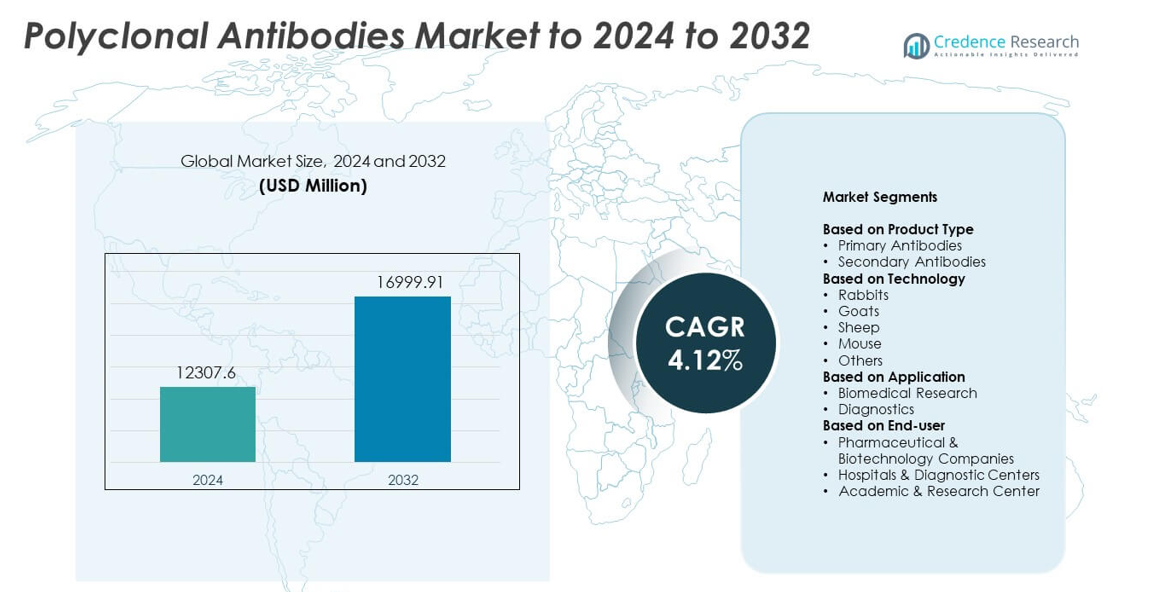
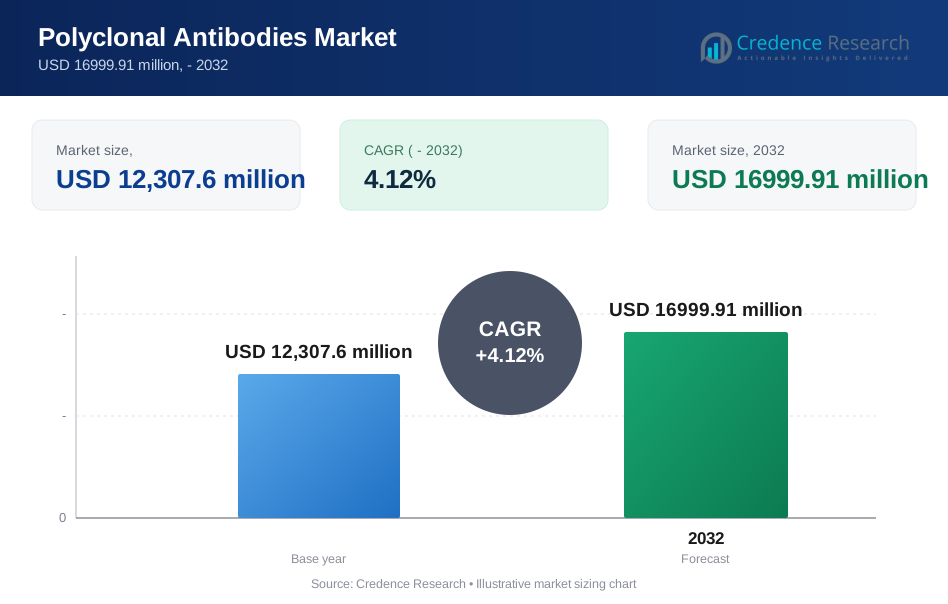
Polyclonal Antibodies Market size was valued at USD 12307.6 million in 2024 and is anticipated to reach USD 16999.91 million by 2032, at a CAGR of 4.12% during the forecast period.
| REPORT ATTRIBUTE | DETAILS |
|---|---|
| Historical Period | 2020-2023 |
| Base Year | 2024 |
| Forecast Period | 2025-2032 |
| Polyclonal Antibodies Market Size 2024 | USD 12307.6 million |
| Polyclonal Antibodies Market, CAGR | 4.12% |
| Polyclonal Antibodies Market Size 2032 | USD 16999.91 million |
The Polyclonal Antibodies Market features strong participation from major companies such as Bio-Rad Laboratories Inc, XENOTHERA, Abcam plc, Hoffmann-La Roche Ltd, Merck KGaA, Becton, Dickinson and Company, GenScript, Cell Signaling Technology Inc, and F. Hoffmann-La Roche AG (Roche). These players expand portfolios, enhance production technologies, and support rising needs in research and diagnostics. North America emerged as the leading region in 2024 with about 38% market share, driven by high R&D spending and strong diagnostic adoption. Europe followed with nearly 29% share due to its established biomedical research base, while Asia Pacific accounted for about 24%, supported by rapid growth in pharmaceutical and diagnostic development.
Market Insights
- The Polyclonal Antibodies Market was valued at USD 12307.6 million in 2024 and is projected to reach USD 16999.91 million by 2032, growing at a CAGR of 4.12%. • Market growth is driven by rising biomedical research activity and expanding diagnostic testing, with primary antibodies holding the largest share due to broad use in protein detection workflows. • Key trends include rapid expansion of custom antibody development, rising demand from emerging disease research, and increased integration into automated and multiplex assay platforms. • The competitive landscape strengthens as major suppliers invest in advanced production technologies, improved purification systems, and global distribution networks to support high-throughput research and diagnostics. • North America led the market with about 38% share in 2024, followed by Europe at nearly 29% and Asia Pacific at around 24%, while biomedical research remained the dominant application segment with about 57% share.
Market Segmentation Analysis:
By Product Type
Primary antibodies led the Polyclonal Antibodies Market in 2024 with about 61% share. Research labs and diagnostic centers relied on these products for strong binding affinity and broad epitope recognition during assays. Primary antibodies stayed in high demand because scientists used them in ELISA, Western blotting, immunohistochemistry, and flow cytometry. Secondary antibodies grew at a steady pace due to rising use in signal amplification, yet their adoption remained lower because they depend on primary antibody availability. Expanding biomedical research programs helped primary antibodies stay dominant.
- For instance, Bio-Techne (R&D Systems and Novus Biologicals) lists a catalog of over 425,000 antibodies supporting primary and secondary assay needs across ELISA, Western blot, and flow cytometry workflows.
By Technology
Rabbit-derived polyclonal antibodies held the dominant position in 2024 with nearly 48% share. Producers favored rabbits because they generate strong immune responses, high-yield antibody collections, and wide epitope coverage. Rabbit antibodies also showed improved sensitivity across diagnostics and research applications, which supported their broad use. Goat and sheep platforms expanded in specialty testing, while mouse-based production stayed important for specific lab protocols. Growth in custom antibody development and increased disease-target research helped rabbit-derived antibodies maintain leadership.
- For instance, Proteintech reports primary antibodies against over 13,000 different protein targets, with over 4,000 antibodies validated by knockdown (KD) or knockout (KO) methods, and notes that its polyclonal antibodies are specifically raised in rabbit to enhance epitope coverage.
By Application
Biomedical research accounted for the largest share in 2024 with about 57%. Research groups used polyclonal antibodies for protein detection, pathway analysis, biomarker validation, and cell-based studies. The strong need for tools that identify multiple epitopes supported steady adoption across academic and industrial R&D. Diagnostic applications grew due to expanding immunoassays and rapid tests, but their share remained lower because research labs consumed a wider antibody range. Rising investments in life sciences and drug discovery helped biomedical research remain the leading segment.
Key Growth Drivers
Rising Demand in Biomedical Research
Growing research activity increased the use of polyclonal antibodies for protein analysis, molecular profiling, and pathway studies across universities, biotech firms, and pharmaceutical labs. Researchers valued these antibodies because they recognize multiple epitopes, deliver strong signal intensity, and support a wide range of detection needs in assays like ELISA, Western blotting, and immunohistochemistry. Expanding drug discovery programs, cell biology research, and translational studies further boosted consumption. Rising investment in life sciences strengthened this demand, making biomedical research one of the most influential growth drivers in the market.
- For instance, GenScript states that as of recent reports, it has delivered over 157,000 successful antibody projects for more than 5,000 contracted organizations worldwide, reflecting strong demand from academia, biotech, and pharma research programs.
Expansion of Diagnostic Applications
Diagnostic developers adopted polyclonal antibodies for immunoassays, infectious disease screening, and routine clinical diagnostics due to their broad binding capability and strong assay performance. These antibodies supported rapid test development and offered high sensitivity across diverse platforms used in hospitals and reference labs. Increasing global testing volumes, rising disease surveillance activity, and expansion of point-of-care diagnostics strengthened procurement. As clinical labs broadened their test menus, polyclonal antibodies gained more relevance, positioning diagnostics as a major and sustained growth driver in the market.
- For instance, Bio-Rad reports a portfolio of over 11,000 antibodies and related reagents and more than 40 years of expertise in autoantibody testing solutions for clinical laboratories.
Advances in Antibody Production Technologies
Continuous improvements in purification systems, host immunization protocols, and antigen preparation enhanced antibody yield, affinity, and batch stability. Producers integrated advanced screening tools and strengthened quality control standards, which improved reproducibility across research and diagnostic workflows. Innovations in chromatography, automated purification, and scalable production methods helped meet rising custom antibody demand. These technological advancements increased manufacturing efficiency and product reliability, making production innovation a key driver shaping long-term market competitiveness.
Key Trends & Opportunities
Growth of Custom Antibody Development
Research institutions, diagnostic developers, and biotech companies increased demand for custom polyclonal antibodies tailored to novel biomarkers, emerging therapeutic targets, and specialized assay formats. Custom services offered flexibility, rapid development timelines, and compatibility with diverse research needs, making them attractive for expanding R&D pipelines. Growth in precision medicine, oncology research, and advanced biological studies further increased requests for customized solutions. This trend continued to open new revenue opportunities for producers and strengthened the role of contract antibody developers in the market.
- For instance, ProteoGenix reports having developed over 6,000 custom antibodies for its clients (as part of its service history) and offers a broad catalog of research-use antibodies.
Increasing Use in Emerging Disease Research
Global disease surveillance programs increased demand for polyclonal antibodies to support rapid-response research on new and mutating pathogens. Researchers used these antibodies for broad epitope detection, which helped accelerate early-stage studies, antigen tracking, and assay development. Investment in public health preparedness, pandemic response programs, and infectious disease laboratories expanded adoption. As governments and global health agencies strengthened research networks, emerging disease monitoring created sustained opportunities for antibody manufacturers.
- For instance, BEI Resources, managed by ATCC, documents the delivery of over 190,000 vials of SARS-CoV-2 materials to more than 3,500 researchers in 77 countries, alongside production of over 27,000 products annually for more than 900 public health laboratories.
Key Challenges
Batch-to-Batch Variability
Producers faced challenges maintaining consistent antibody performance because biological systems naturally produce variation across batches. This inconsistency affected reproducibility in research and diagnostic testing, leading labs to require tighter quality control and validation procedures. Additional testing steps increased production time and operational cost. Variability also created barriers in assays that require strict uniformity, making it a key challenge that manufacturers continued to address through improved screening and process standardization.
Competition from Monoclonal and Recombinant Antibodies
Growing adoption of monoclonal and engineered recombinant antibodies created strong competition due to their precise target recognition, consistency, and reduced variability. These alternatives gained traction in applications requiring high accuracy, such as therapeutic monitoring, biomarker quantification, and advanced diagnostics. Their expanding availability lowered reliance on polyclonal products in certain workflows. Manufacturers needed innovation, improved performance, and better customization services to maintain competitiveness. This competitive pressure remained a major long-term challenge for the polyclonal antibodies market.
Regional Analysis
North America
North America held the largest share in 2024 with about 38%. Strong demand came from research institutes, biotech firms, and diagnostic laboratories that relied on polyclonal antibodies for biomarker discovery, immunoassays, and disease mapping. The region showed steady growth due to high R&D investments, strong adoption of advanced assay platforms, and expanding clinical testing volumes. Leading universities and biotechnology clusters increased procurement as research programs broadened. Supportive funding and the presence of major life science suppliers helped North America maintain its leading position in the global market.
Europe
Europe accounted for nearly 29% share in 2024. The region benefited from strong biomedical research networks, active disease surveillance programs, and robust demand from pharmaceutical manufacturers. Research groups adopted polyclonal antibodies for proteomics, oncology studies, and cell-based analysis, driving steady consumption. Regulatory focus on high-quality antibody production pushed manufacturers toward improved processing standards. Growth remained supported by rising diagnostic activities across hospitals and reference labs. Expanding biotech startups and collaborations across EU countries helped Europe sustain a competitive position in the global market.
Asia Pacific
Asia Pacific held about 24% share in 2024 and represented the fastest-growing region. Expanding research facilities, growing pharmaceutical manufacturing, and rising investment in disease research boosted adoption. Countries such as China, India, and Japan increased spending on immunology and molecular biology programs, raising demand for high-quality polyclonal antibodies. Diagnostic labs expanded their test menus, which further supported market growth. Rising academic research output and supportive government funding improved regional competitiveness. This strong momentum positioned Asia Pacific as a major growth engine for the market.
Latin America
Latin America captured around 6% share in 2024. The region showed moderate growth driven by increasing adoption of immunoassays in public health labs and rising interest in biomedical research. Countries such as Brazil and Mexico expanded diagnostic testing capacity, which supported antibody demand. Limited local manufacturing kept reliance on imported products high, yet procurement increased as healthcare systems improved. Collaborative research programs and growing attention to infectious disease monitoring contributed to steady usage. Latin America remained a developing but expanding market opportunity.
Middle East & Africa
Middle East & Africa held nearly 3% share in 2024. Growth stayed gradual due to lower research funding and limited laboratory infrastructure, yet adoption increased as healthcare modernization expanded. Diagnostic centers used polyclonal antibodies for infectious disease testing and screening programs. Investments in clinical laboratories and rising partnerships with global suppliers improved product availability. Research activity grew in select countries with developing biotechnology sectors. Although market size remained small, the region showed rising interest in advanced testing solutions, contributing to slow but consistent growth.
Market Segmentations:
By Product Type
- Primary Antibodies
- Secondary Antibodies
By Technology
- Rabbits
- Goats
- Sheep
- Mouse
- Others
By Application
- Biomedical Research
- Diagnostics
By End-user
- Pharmaceutical & Biotechnology Companies
- Hospitals & Diagnostic Centers
- Academic & Research Center
By Geography
- North America
- U.S.
- Canada
- Mexico
- Europe
- Germany
- France
- U.K.
- Italy
- Spain
- Rest of Europe
- Asia Pacific
- China
- Japan
- India
- South Korea
- South-east Asia
- Rest of Asia Pacific
- Latin America
- Brazil
- Argentina
- Rest of Latin America
- Middle East & Africa
- GCC Countries
- South Africa
- Rest of the Middle East and Africa
Competitive Landscape
The competitive landscape of the Polyclonal Antibodies Market is shaped by leading companies such as Bio-Rad Laboratories Inc, XENOTHERA, Abcam plc, Hoffmann-La Roche Ltd, Merck KGaA, Becton, Dickinson and Company, GenScript, Cell Signaling Technology Inc, and F. Hoffmann-La Roche AG (Roche). Market participants focus on expanding antibody portfolios, improving purification methods, and strengthening quality standards to support research and diagnostic use. Companies invest in advanced production platforms to enhance yield and binding performance while meeting rising demand for custom antibody development. Strategic partnerships with research institutes, diagnostics developers, and pharmaceutical firms help suppliers increase global reach. Competitors also prioritize automation-ready products to support high-throughput workflows in modern laboratories. Continuous innovation in assay technologies and strong emphasis on reproducibility drive firms to upgrade validation processes. The market remains moderately consolidated, with suppliers competing through technology strength, product reliability, and service capabilities across key application areas.
Key Player Analysis
- Bio-Rad Laboratories Inc
- XENOTHERA
- Abcam plc
- Hoffmann-La Roche Ltd
- Merck KGaA
- Becton, Dickinson and Company
- GenScript
- Cell Signaling Technology Inc
- Hoffmann-La Roche AG (Roche)
Recent Developments
- In 2025, XENOTHERA company launched the second dose cohort at 4mg for LIS22 in the PALT trial and the fifth dose cohort at 16mg for XON7 in the FIPO trial (NCT06154291) targeting solid tumors, both validated for good tolerability.
- In 2025, Merck KGaA partnered with Biocytogen to test fully human antibodies from the RenMice platform in antibody-conjugated lipid nanoparticle delivery systems.
- In 2023, F. Hoffmann-La Roche AG (Roche) introduced the ATRX Rabbit Polyclonal Antibody.
Report Coverage
The research report offers an in-depth analysis based on Type, Technology, Application, End-User and Geography. It details leading market players, providing an overview of their business, product offerings, investments, revenue streams, and key applications. Additionally, the report includes insights into the competitive environment, SWOT analysis, current market trends, as well as the primary drivers and constraints. Furthermore, it discusses various factors that have driven market expansion in recent years. The report also explores market dynamics, regulatory scenarios, and technological advancements that are shaping the industry. It assesses the impact of external factors and global economic changes on market growth. Lastly, it provides strategic recommendations for new entrants and established companies to navigate the complexities of the market.
Future Outlook
- The market will grow steadily as research labs expand molecular and cellular studies.
- Diagnostic adoption will rise due to increasing testing volumes across global healthcare systems.
- Custom antibody development will gain traction as demand for target-specific solutions increases.
- Technological upgrades will improve antibody purity, yield, and batch consistency.
- Emerging disease surveillance will drive higher consumption in public health research.
- Automation of immunoassay platforms will boost demand for high-performance polyclonal antibodies.
- Pharmaceutical R&D programs will strengthen usage in biomarker validation and pathway analysis.
- Suppliers will expand global distribution networks to meet rising research and diagnostic needs.
- Regulatory focus on quality and reproducibility will shape future production standards.
- Competition from monoclonal and recombinant antibodies will encourage innovation and product diversification.
Request a Free Sample
Fill in your details and we'll send you a free sample report.
- Sample data tables & charts
- Research methodology
Need a Custom Version of This Report?
Tailor the scope, geography, or segments to your exact requirements.
- Custom geography or segment scope
- Direct access to our analyst team
Frequently Asked Questions
What is the current market size for Polyclonal Antibodies Market, and what is its projected size in 2032?
At what Compound Annual Growth Rate is the Polyclonal Antibodies Market projected to grow between 2024 and 2032?
Which Polyclonal Antibodies Market segment held the largest share in 2024?
What are the primary factors fueling the growth of the Polyclonal Antibodies Market?
Who are the leading companies in the Polyclonal Antibodies Market?
Table of Content
Chapter 1. Report Introduction
- 1.1 Report Description & Purpose
- 1.1.1 Report Title & Market Definition
- 1.1.2 Unique Selling Propositions (USP) & Key Differentiators
- 1.1.3 Value Proposition for Stakeholders
- 1.2 Research Objectives
- 1.2.1 Market Sizing Objectives (Volume & Revenue)
- 1.2.2 Segmentation Objectives
- 1.2.3 Competitive Intelligence Objectives
- 1.2.4 Forecast & Scenario Objectives
- 1.3 Report Scope
- 1.3.1 Polyclonal Antibodies Scope – Types & Subtypes Covered
- 1.3.2 Geographic Scope – Regions & Countries Covered
- 1.3.3 Historical Period, Base Year & Forecast Period (the historical period; forecast to 2032)
- 1.3.4 Inclusions & Exclusions
- 1.4 HS Code & Classification Framework
- 1.5 Currency, Units & Pricing Basis
- 1.6 Target Stakeholders
- 1.7 Limitations & Assumptions
Chapter 2. Executive Summary
- 2.1 Global Polyclonal Antibodies Market Snapshot
- 2.1.1 Market Size – Historical (the historical period) & Forecast (2032) (base year: USD 12,307.6 million → 2032: USD 16999.91 million)
- 2.1.2 Volume & Revenue – Global Totals
- 2.1.3 Key Market Highlights – Top Five Facts
- 2.2 Polyclonal Antibodies Market Segmentation Snapshot
- 2.2.1 Market Split by Region – vs. 2032
- 2.3 Competitive Snapshot
- 2.3.1 Top 10 Players by Revenue Share –
- 2.3.2 Top 10 Players by Volume Share –
- 2.3.3 Recent Strategic Developments (18-Month Summary)
- 2.4 Key Investment Highlights & Strategic Conclusions
Chapter 3. Polyclonal Antibodies Market Dynamics & Industry Analysis
- 3.1 Market Overview & Context
- 3.1.1 Polyclonal Antibodies Market Position in the Broader Automotive Value Chain
- 3.1.2 OEM vs. Replacement Market Dynamics
- 3.1.3 Market Maturity & Development Stage by Region
- 3.2 Polyclonal Antibodies Market Drivers
- 3.3 Polyclonal Antibodies Market Restraints & Challenges
- 3.4 Polyclonal Antibodies Market Opportunities
- 3.5 Porter's Five Forces Analysis
- 3.5.1 Threat of New Entrants
- 3.5.2 Bargaining Power of Suppliers
- 3.5.3 Bargaining Power of Buyers
- 3.5.4 Threat of Substitutes
- 3.5.5 Competitive Rivalry – Intensity Assessment
- 3.6 Polyclonal Antibodies Value Chain Analysis
- 3.6.1 Upstream – Raw Material/Input Suppliers
- 3.6.1.1 Raw Material/Input 1
- 3.6.1.2 Raw Material/Input 2
- 3.6.1.3 Raw Material/Input 3
- 3.6.2 Midstream – Production/Manufacturing/Service Delivery
- 3.6.2.1 Production/Process Overview
- 3.6.2.2 Key Facility Locations & Capacity by Manufacturer
- 3.6.3 Downstream – Distribution & End Consumer
- 3.6.3.1 Primary Channel – B2B/OEM
- 3.6.3.2 Secondary Channels – Dealer, Retail, Online, Direct
- 3.6.4 Value Chain Profitability Analysis
- 3.6.1 Upstream – Raw Material/Input Suppliers
- 3.7 PESTEL Analysis
- 3.7.1 Political Factors
- 3.7.2 Economic Factors
- 3.7.3 Social Factors
- 3.7.4 Technological Factors
- 3.7.5 Environmental Factors
- 3.7.6 Legal Factors
- 3.8 Polyclonal Antibodies Supply Chain Analysis
- 3.8.1 Raw Material/Input Supply Risk Assessment
- 3.8.2 Manufacturing Concentration Risk (Geographic Exposure)
- 3.8.3 Trade Disruption Impact Analysis
- 3.9 Regulatory & Policy Landscape
Note: The regulatory and policy landscape section covers regulations based on their applicability to the market, Polyclonal Antibodies category, geography, and scope of the study. Only regulatory frameworks with a material impact on operations, compliance, trade, sustainability, or market access are analyzed in detail.
Chapter 4. Key Investment Pockets & Opportunity Analysis
- 4.1 Polyclonal Antibodies Market Attractiveness Analysis
- 4.1.1 By Region – Investment Attractiveness Matrix (Volume × CAGR)
- 4.2 Absolute Revenue Growth Opportunity
- 4.2.1 By Region – Absolute USD Growth Through 2032
- 4.3 Incremental Volume Opportunity
- 4.3.1 By Region – Incremental Volume Through 2032
- 4.3.2 Segment – Incremental Volume
- 4.4 Emerging Submarket Opportunity Deep Dive (Subject to Applicability)
- 4.5 Emerging Market Opportunity Scorecards
- 4.5.1 United States
- 4.5.2 Europe
- 4.5.3 Asia
- 4.5.4 Middle East & Africa
Note: Emerging Market Opportunity Scorecards will be included based on relevance and strategic importance. Regions listed are indicative and may vary depending on data availability and market dynamics.
Chapter 5. Polyclonal Antibodies Import-Export Analysis & Trade Flows
- 5.1 Global Trade Overview
- 5.1.1 Global Export Value by Country (the historical period)
- 5.1.2 Global Export Volume by Country (the historical period)
- 5.1.3 Global Import Value by Country (the historical period)
- 5.1.4 Global Import Volume by Country (the historical period)
- 5.1.5 Net Trade Balance by Country (the historical period)
- 5.2 Export Analysis – Segment
- 5.2.1 Type 1 (HS Code)
- 5.2.2 Type 2 (HS Code)
- 5.2.3 Type 3 (HS Code)
- 5.2.4 Type 4 (HS Code)
- 5.2.5 Type 5 (HS Code)
- 5.3 Import Analysis – Segment
- 5.3.1 Type 1 (HS Code)
- 5.3.2 Type 2 (HS Code)
- 5.3.3 Type 3 (HS Code)
- 5.3.4 Type 4 (HS Code)
- 5.3.5 Type 5 (HS Code)
- 5.4 Average Unit Trade Prices
- 5.4.1 Average Export Price – Segment & Country
- 5.4.2 Average Import Price – Segment & Source Country
- 5.4.3 Price Trends (the historical period)
- 5.5 Key Trade Route Analysis
- 5.5.1 Trade Route 1
- 5.5.2 Trade Route 2
- 5.5.3 Trade Route 3
- 5.5.4 Trade Route 4
- 5.5.5 Trade Route 5
- 5.6 Trade Policy Impact Assessment
- 5.6.1 US Anti-Dumping & Section 301 Tariffs
- 5.6.2 EU Customs Union Impact
- 5.6.3 Major Free Trade Agreements
- 5.6.4 USMCA Rules of Origin
Note: Trade policy analysis will be included only where relevant to the Polyclonal Antibodies market.
Chapter 6. Competitive Landscape & Company Benchmarking
- 6.1 Polyclonal Antibodies Market Concentration & Structure
- 6.1.1 Herfindahl-Hirschman Index (HHI) – vs.
- 6.1.2 Tier 1, Tier 2 & Tier 3 Market Structure
- 6.1.3 Global, Regional & Local Player Dynamics
- 6.2 Polyclonal Antibodies Market Share Analysis –
- 6.2.1 Global Revenue Share by Company
- 6.2.2 Global Volume Share by Company
- 6.2.3 Regional Revenue Share
- 6.2.4 Market Share Evolution ( vs. )
- 6.2.5 OEM Segment Share by Company
- 6.2.6 Replacement Segment Share by Company
- 6.3 Production/Delivery Capacity & Facility Analysis
- 6.3.1 Global Installed Capacity
- 6.3.2 Capacity Utilization Rates
- 6.3.3 Production/Output Volume
- 6.3.4 Facility Locations & Capacity Map
- 6.3.5 Planned Capacity Additions
- 6.4 Polyclonal Antibodies Competitive Benchmarking Matrix
- 6.4.1 Revenue, Volume, CAGR & Profitability Comparison
- 6.4.2 Channel Revenue Mix
- 6.4.3 Geographic Revenue Exposure
- 6.4.4 R&D Intensity
- 6.4.5 Sustainability Maturity
- 6.5 Strategic Developments in Polyclonal Antibodies (Last 24 Months)
- 6.5.1 Mergers, Acquisitions & Divestments
- 6.5.2 New Polyclonal Antibodies Launches
- 6.5.3 Facility Expansions
- 6.5.4 Strategic Alliances, Joint Ventures & Partnerships
- 6.5.5 Distribution Expansion & Market Entry
- 6.5.6 Sustainability & ESG Initiatives
- 6.6 Competitive Strategy Mapping
- 6.6.1 Leader, Challenger, Follower & Niche Classification
- 6.6.2 Pricing Strategy Comparison
- 6.6.3 Channel Strategy Matrix
Note: Strategic developments are included based on their materiality and the availability of reliable information.
Chapter 7. Global Polyclonal Antibodies Market – By Distribution Channel
- 7.1 Segment Overview
- 7.1.1 Volume & Revenue Split by Channel ( & 2032)
- 7.1.2 Channel Mix Evolution (2032)
Chapter 8. Regional Market Analysis – Global Overview
- 8.1 Global Regional Overview
- 8.1.1 Regional Volume Share
- 8.1.2 Regional Revenue Share
- 8.1.3 Regional Volume by Region
- 8.1.4 Regional Revenue by Region
- 8.1.5 Regional Forecast Through 2032
- 8.2 Cross-Regional Segment Analysis
- 8.2.1 By Distribution Channel
- 8.2.2 By Brand/Price Tier
Chapter 9. North America Polyclonal Antibodies Market
- 9.1 United States
- 9.2 Canada
- 9.3 Mexico
Chapter 10. Europe Polyclonal Antibodies Market
- 10.1 Germany
- 10.2 France
- 10.3 Italy
- 10.4 United Kingdom
- 10.5 Spain
- 10.6 Poland
- 10.7 Russia
- 10.8 Netherlands
- 10.9 Belgium
- 10.10 Sweden
- 10.11 Denmark
- 10.12 Norway
- 10.13 Rest of Europe
Chapter 11. Asia Pacific Polyclonal Antibodies Market
- 11.1 China
- 11.2 India
- 11.3 Japan
- 11.4 South Korea
- 11.5 Thailand
- 11.6 Indonesia
- 11.7 Vietnam
- 11.8 Malaysia
- 11.9 Australia
- 11.10 Rest of Asia Pacific
Chapter 12. Latin America Polyclonal Antibodies Market
- 12.1 Brazil
- 12.2 Argentina
- 12.3 Colombia
- 12.4 Chile
- 12.5 Rest of Latin America
Chapter 13. Middle East Polyclonal Antibodies Market
- 13.1 Saudi Arabia
- 13.2 United Arab Emirates
- 13.3 Turkey
- 13.4 Israel
- 13.5 Iran
- 13.6 Rest of the Middle East
Chapter 14. Africa Polyclonal Antibodies Market
- 14.1 South Africa
- 14.2 Egypt
- 14.3 Nigeria
- 14.4 Morocco
- 14.5 Rest of Africa
Chapter 15. Polyclonal Antibodies Company Profiles
- 15.1 [Company 01]
- 15.1.1 Company Overview
- 15.1.2 Key Management Personnel
- 15.1.3 Products & Services Portfolio
- 15.1.4 Financial Performance
- 15.1.5 Key Market Focus & Geographic Presence
- 15.1.6 Recent Developments & Strategic Initiatives
Note: The company profile list is preliminary and may change based on research findings, market developments, data availability, and client requirements.
Chapter 16. Appendices
- Appendix A – List of Abbreviations & Acronyms
- Appendix B – Industry Classification Code Reference – Full Series
- Appendix C – Production & Capacity Data Tables
- Appendix D – End-Use & Demand Base Tables
- Appendix E – Consumption & Replacement Rate Assumptions
- Appendix F – ASP Reference Tables
- Appendix G – Manufacturing & Facility Database
- Appendix H – Import-Export Data Tables
- Appendix I – Regulatory Summary Tables
- Appendix J – Primary Research Participant List (Anonymized)
- Appendix K – Primary Research Questionnaire Framework
- Appendix L – Data Sources & Bibliography
- Appendix M – Market Size Divergence & Source Comparison
Chapter 17. Research Methodology
- 17.1 Research Framework & Philosophy
- 17.2 Secondary Research – Sources, Hierarchy & Data Extraction
- 17.3 Data Modeling – Bottom-Up & Top-Down Market Sizing
- 17.4 Primary Research – Stakeholder Framework, LOI & Sample Sizes
- 17.5 Forecast Methodology – Regression, Scenario & Sensitivity Analysis
- 17.6 Quality Control – Four-Layer Validation Framework
- 17.7 Limitations & Standard Assumptions
- 17.8 Disclaimer
