
Stochastic chips move from lab prototypes to early access
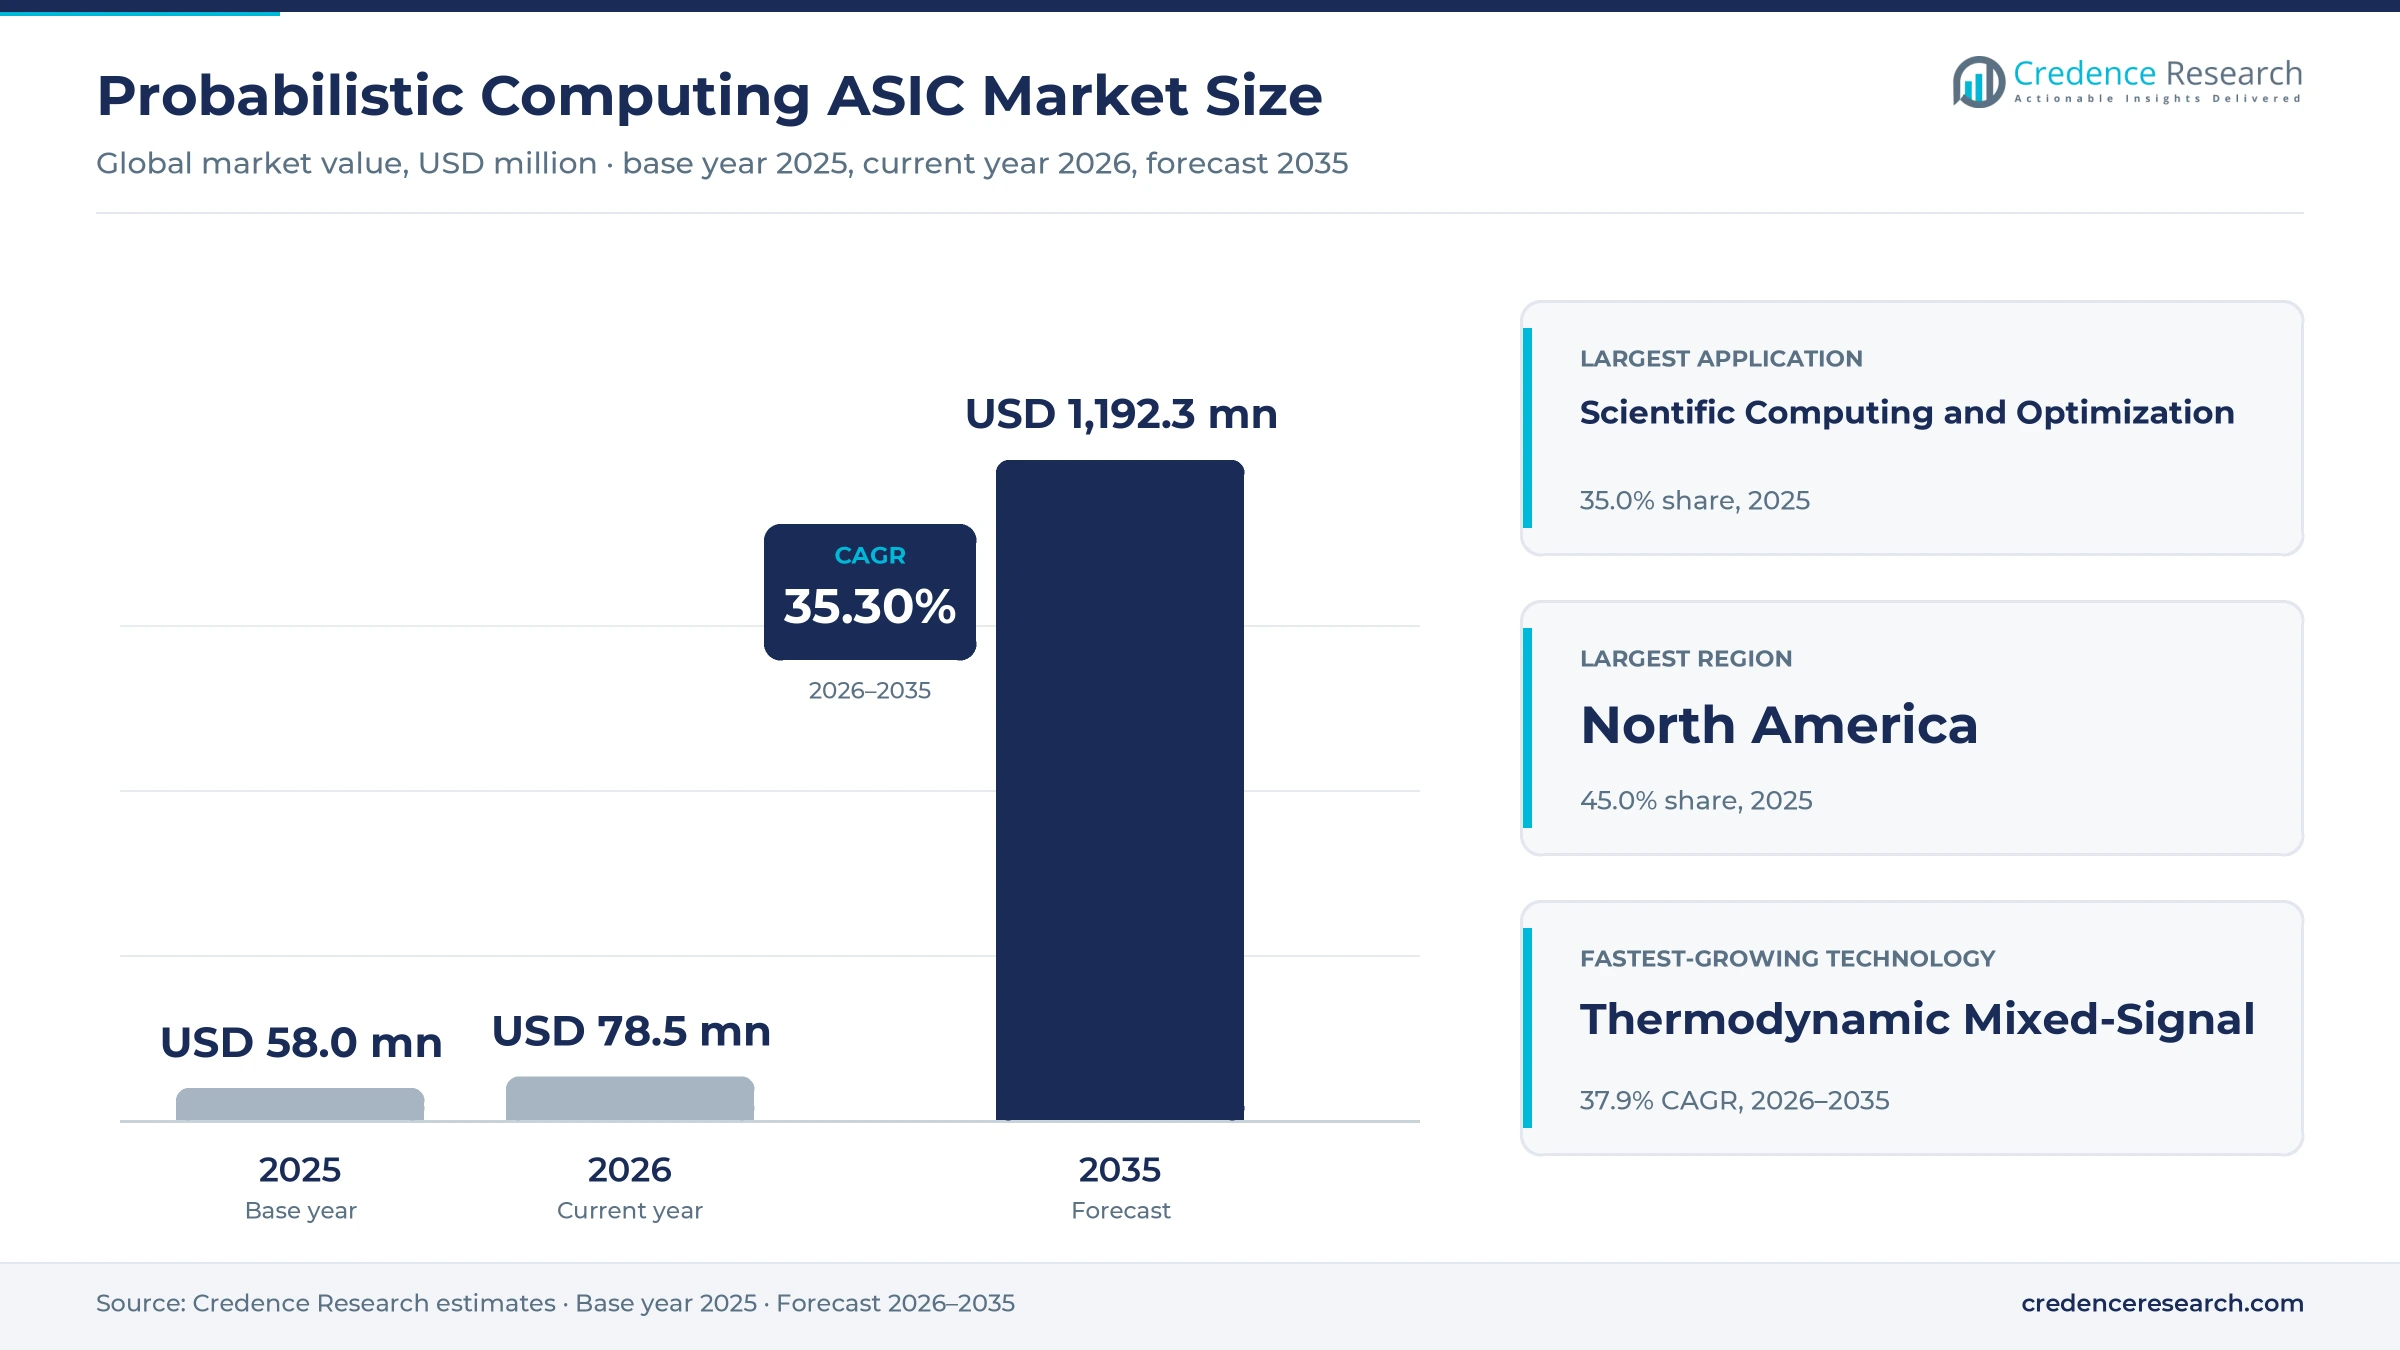
The global probabilistic computing ASIC market was valued at USD 58.0 million in 2025 and is projected to increase from USD 78.5 million in 2026 to USD 1.19 billion by 2035, registering a CAGR of 35.30% during 2026–2035. Demand comes from research laboratories, high-performance computing centers and AI developers that need hardware able to sample from probability distributions or search large optimization spaces with less energy than GPUs use. North America held the largest regional share, 45.0% in 2025, because the main public chip programs and the largest funded prototype efforts are concentrated there. Asia Pacific is the fastest-growing region at 36.0% a year, as Japanese annealing services, spintronic device research and foundry partnerships move toward integrated chips. The most important commercial change is the move from FPGA emulation and circuit-board prototypes to taped-out silicon, which lets buyers test probabilistic accelerators on real workloads. Adoption still runs through early-access programs, since volume production has not started.
Custom silicon that computes with controlled randomness
The market counts application-specific chips whose basic compute element is stochastic, including digital annealing processors, p-bit arrays built from CMOS logic or magnetic tunnel junctions, and thermodynamic sampling chips that use circuit noise to draw samples. It also counts the development systems, accelerator cards and cloud access sold around those chips, along with paid prototype programs for government and corporate sponsors. Buyers usually purchase through research contracts or early-access agreements rather than catalog orders, so terms are negotiated per project.
Gate-based quantum computers, general-purpose GPUs and CPUs, and FPGA boards used only to emulate p-bits are excluded, although they appear in the analysis as substitutes. The value chain runs from device research and chip design through foundry fabrication at mature nodes to systems integration and software, and most value today sits with the chip designers that also write the compilers.
Probabilistic Computing ASIC Market Insights
- The market was valued at USD 58.0 million in 2025 and is projected to reach USD 1.19 billion by 2035, growing at a 35.30% CAGR as developers move from prototypes to early-access accelerator cards.
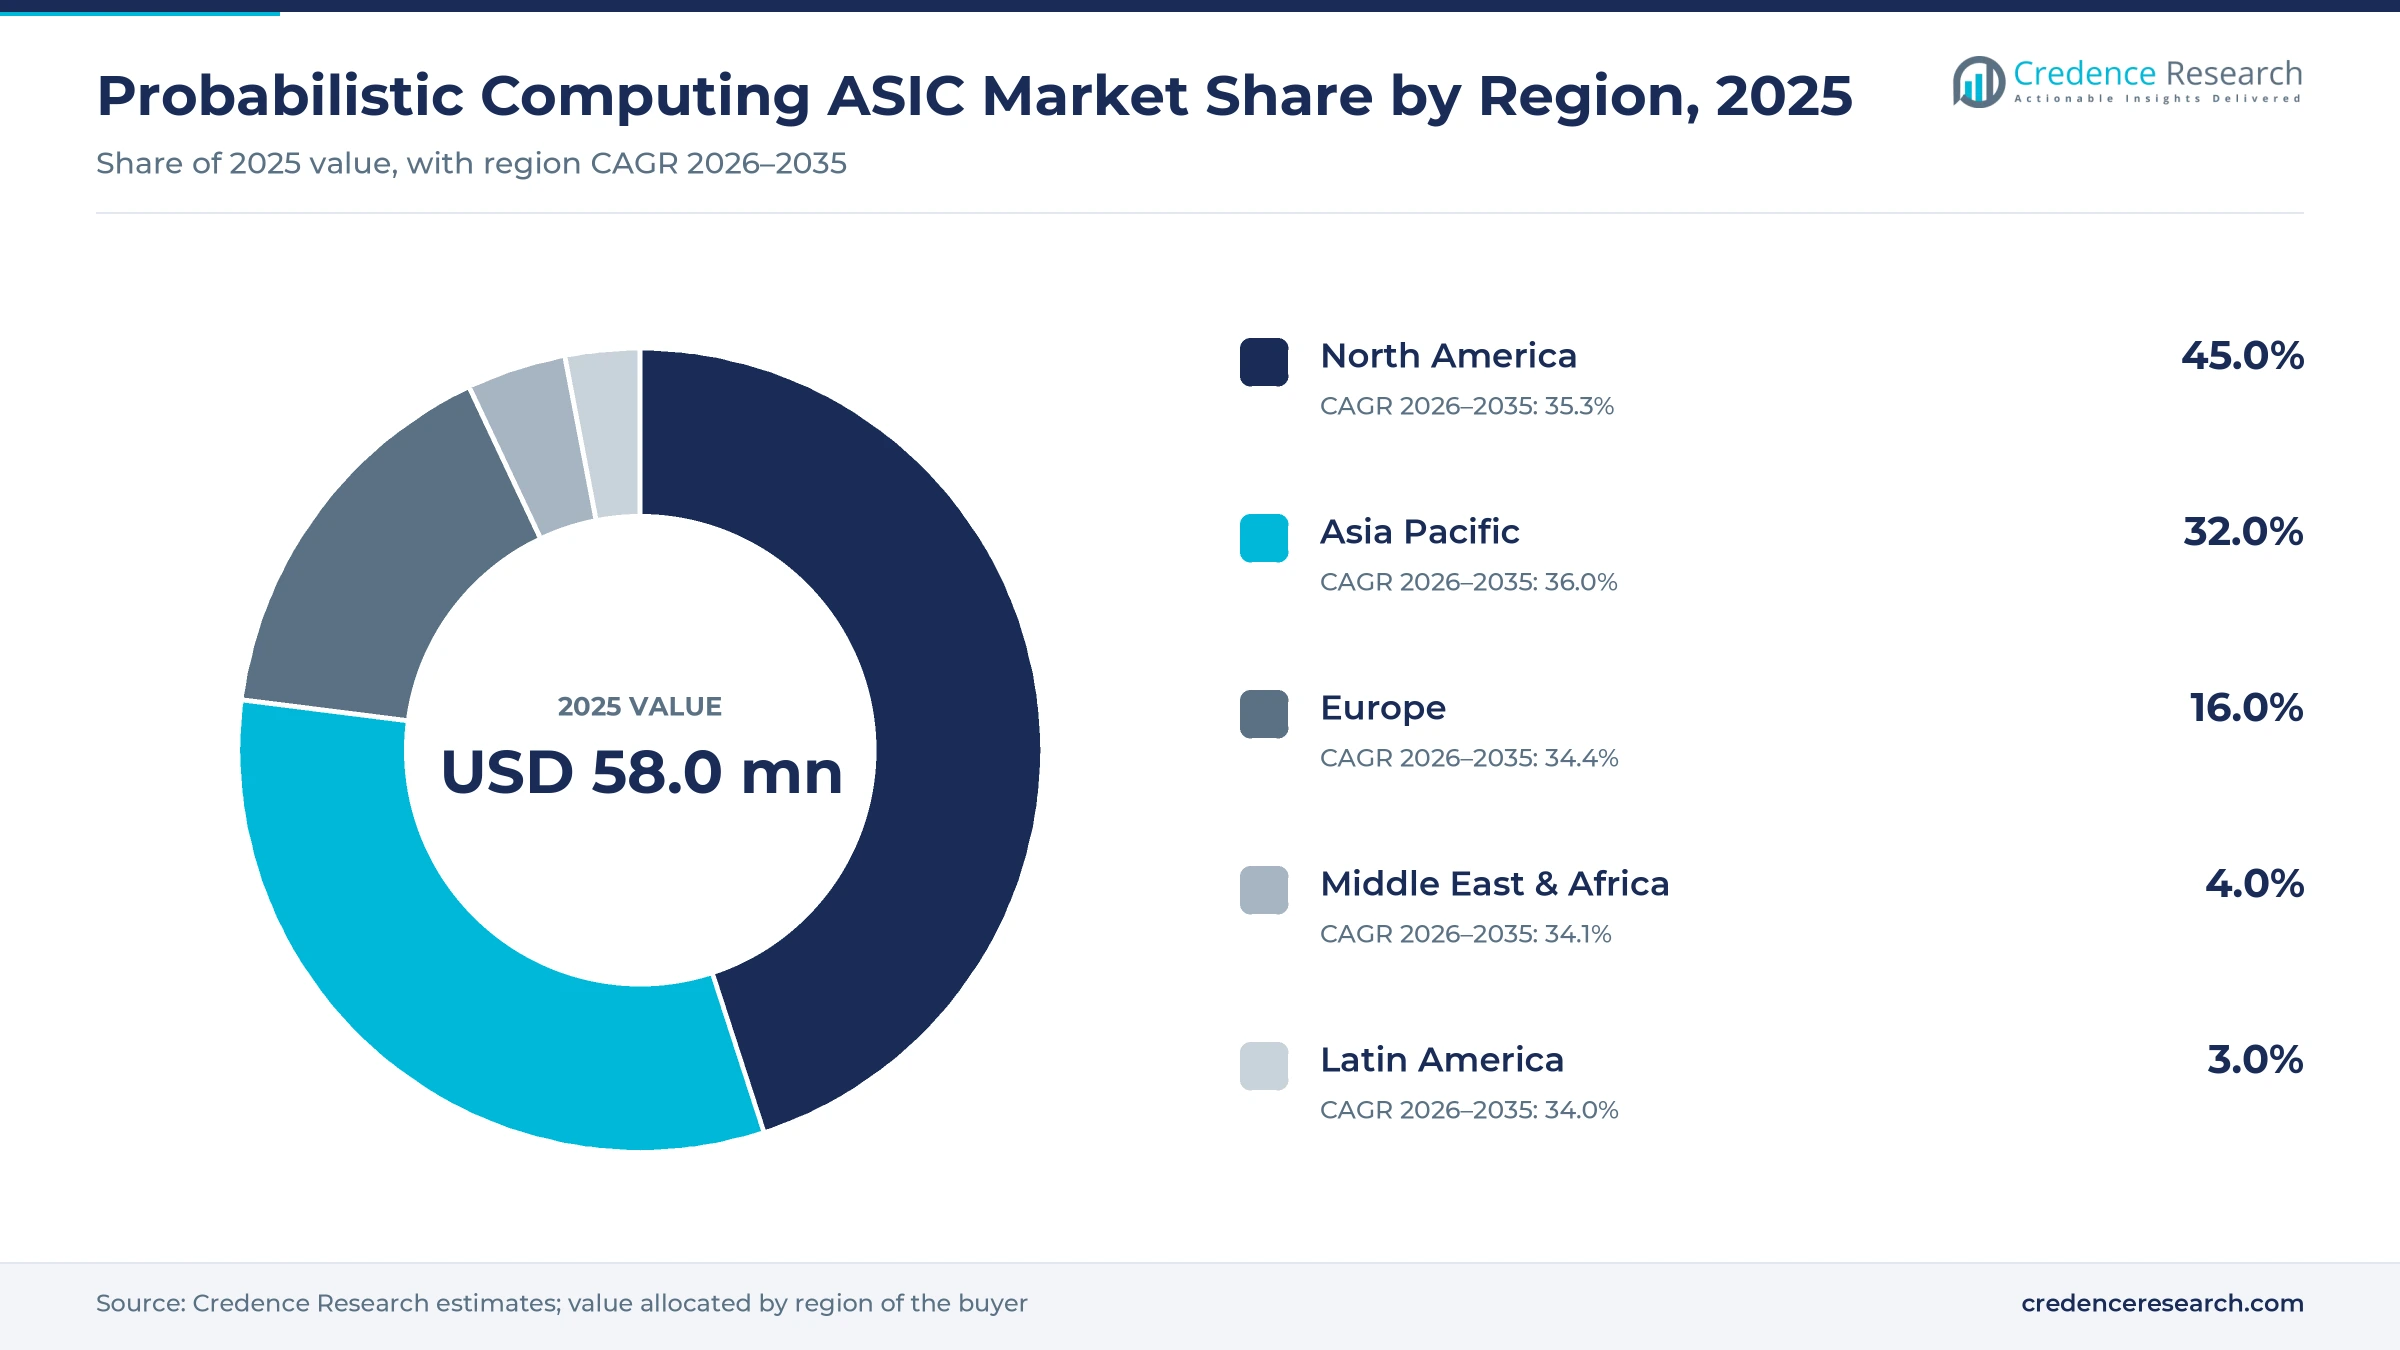
- North America held 45.0% of 2025 value on the strength of U.S. public chip programs and funded prototype efforts, while Asia Pacific grows fastest at 36.0% a year.
- Scientific Computing and Optimization led applications with 35.0% of 2025 value, reflecting Monte Carlo and scheduling workloads that annealing processors already handle in production.
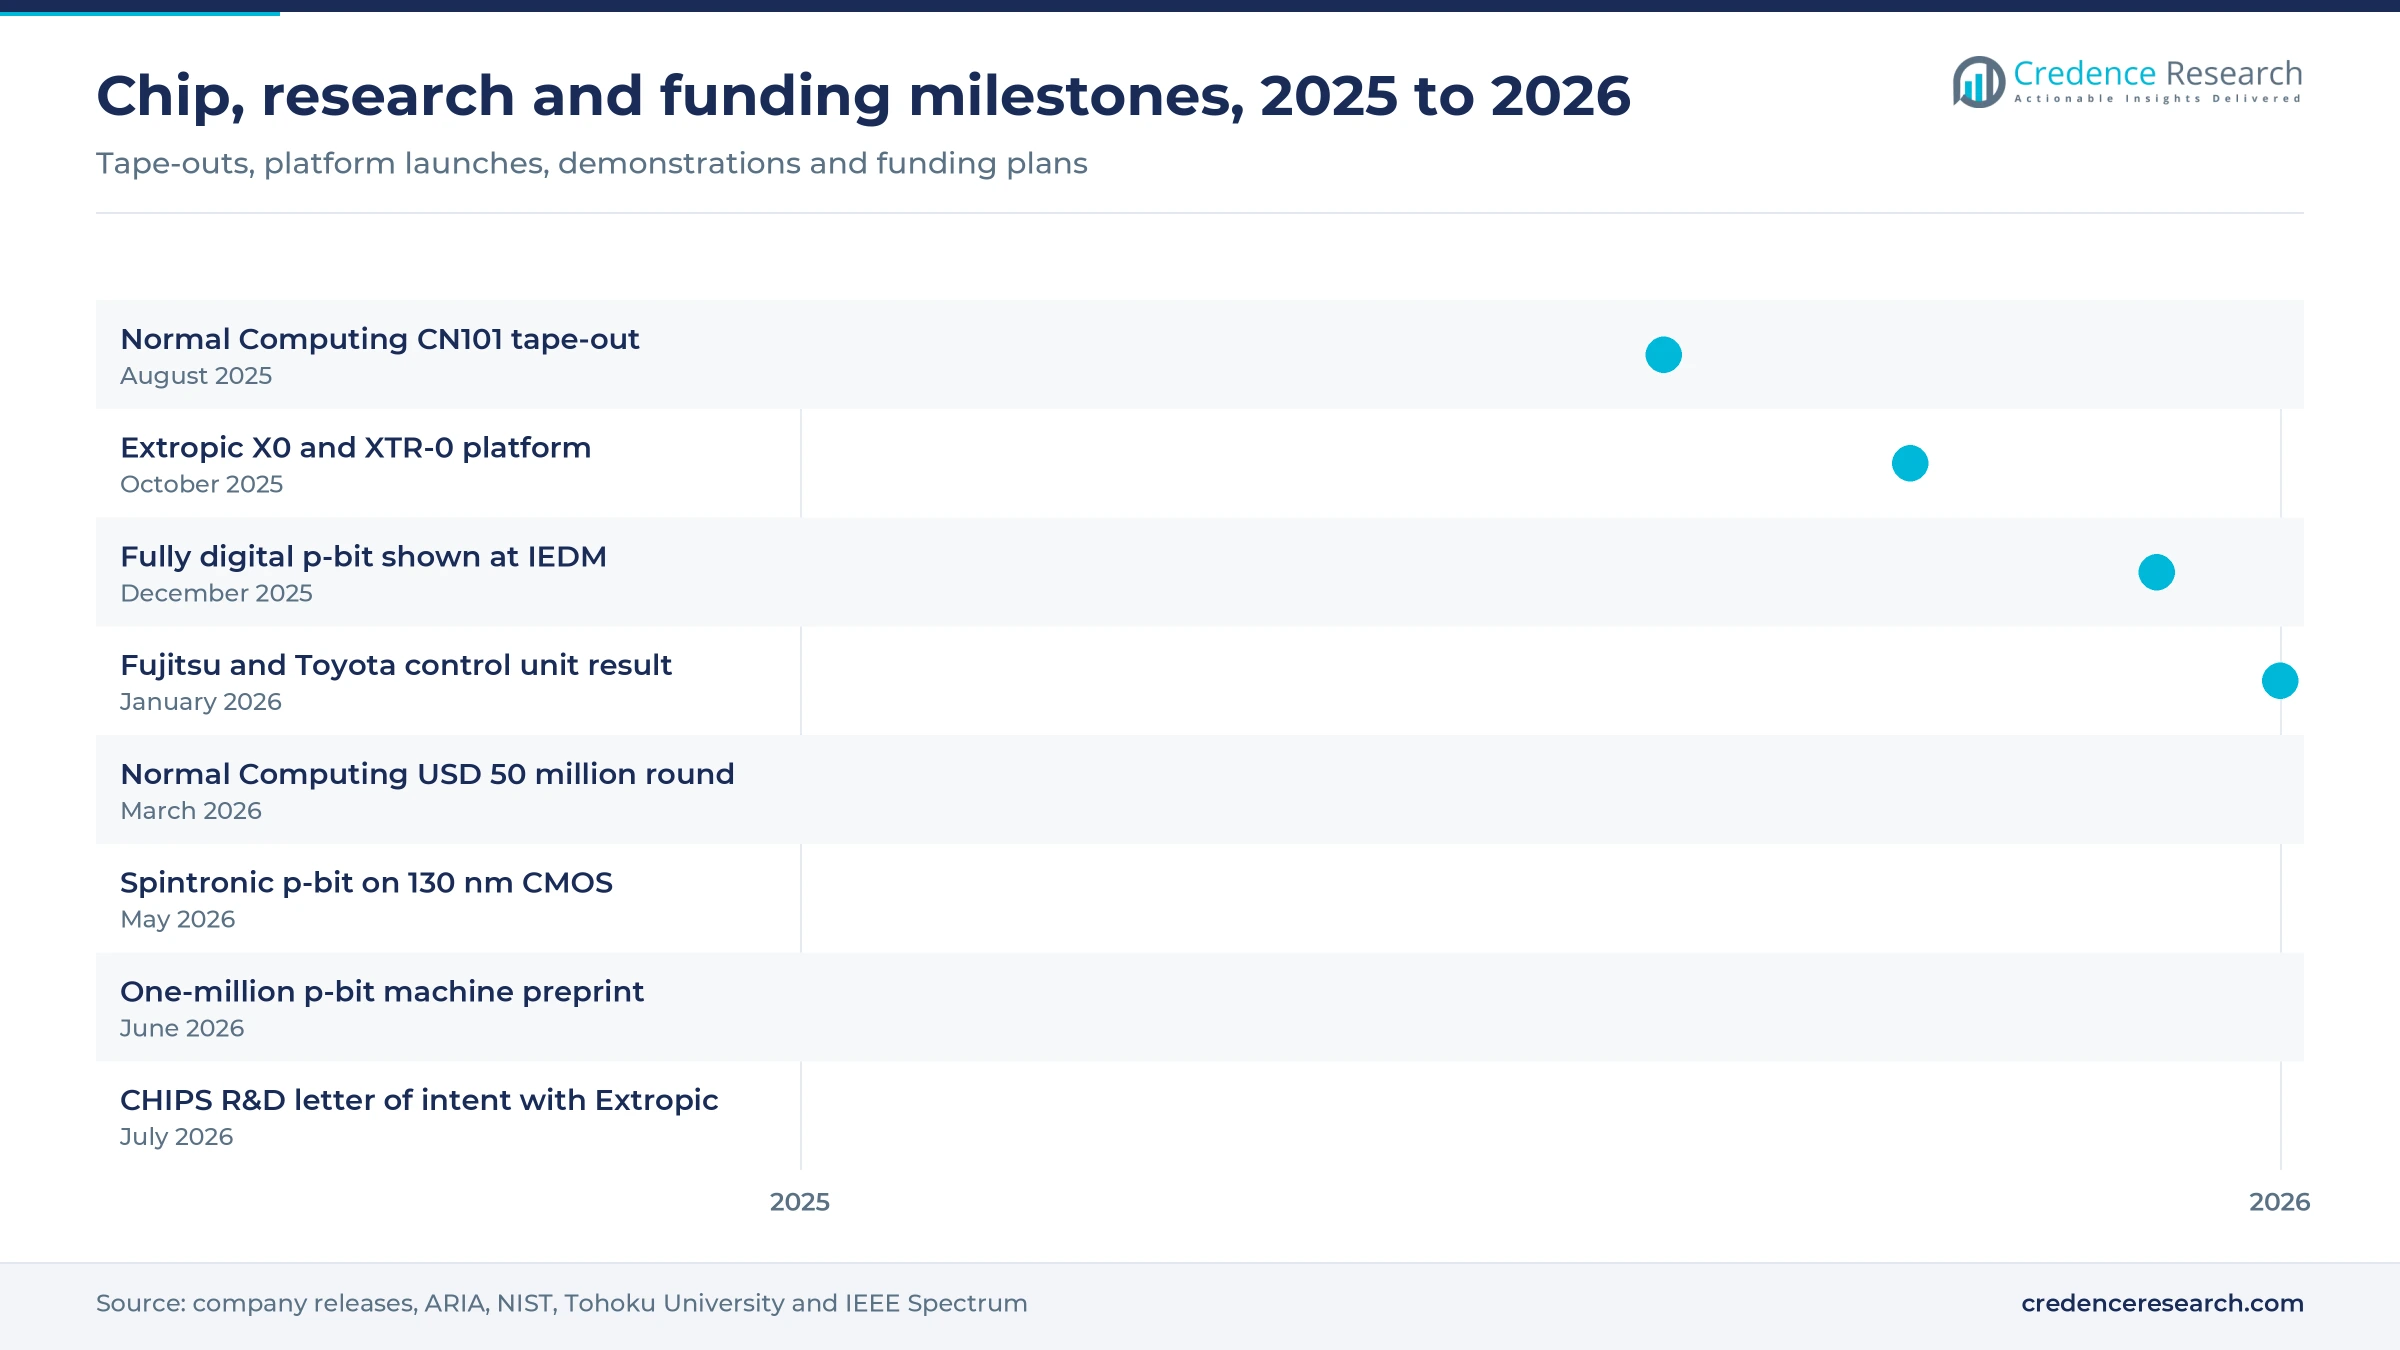
- Chip developers and university teams taped out or demonstrated new probabilistic chips between August 2025 and mid-2026, moving the field from FPGA emulation toward silicon.
- Public funding plans, including a non-binding Commerce Department letter of intent with Extropic, now shape which designs reach production at mature-node foundries.
Optimization leads while AI sampling chips grow fastest
Optimization and Monte Carlo work keep the largest share
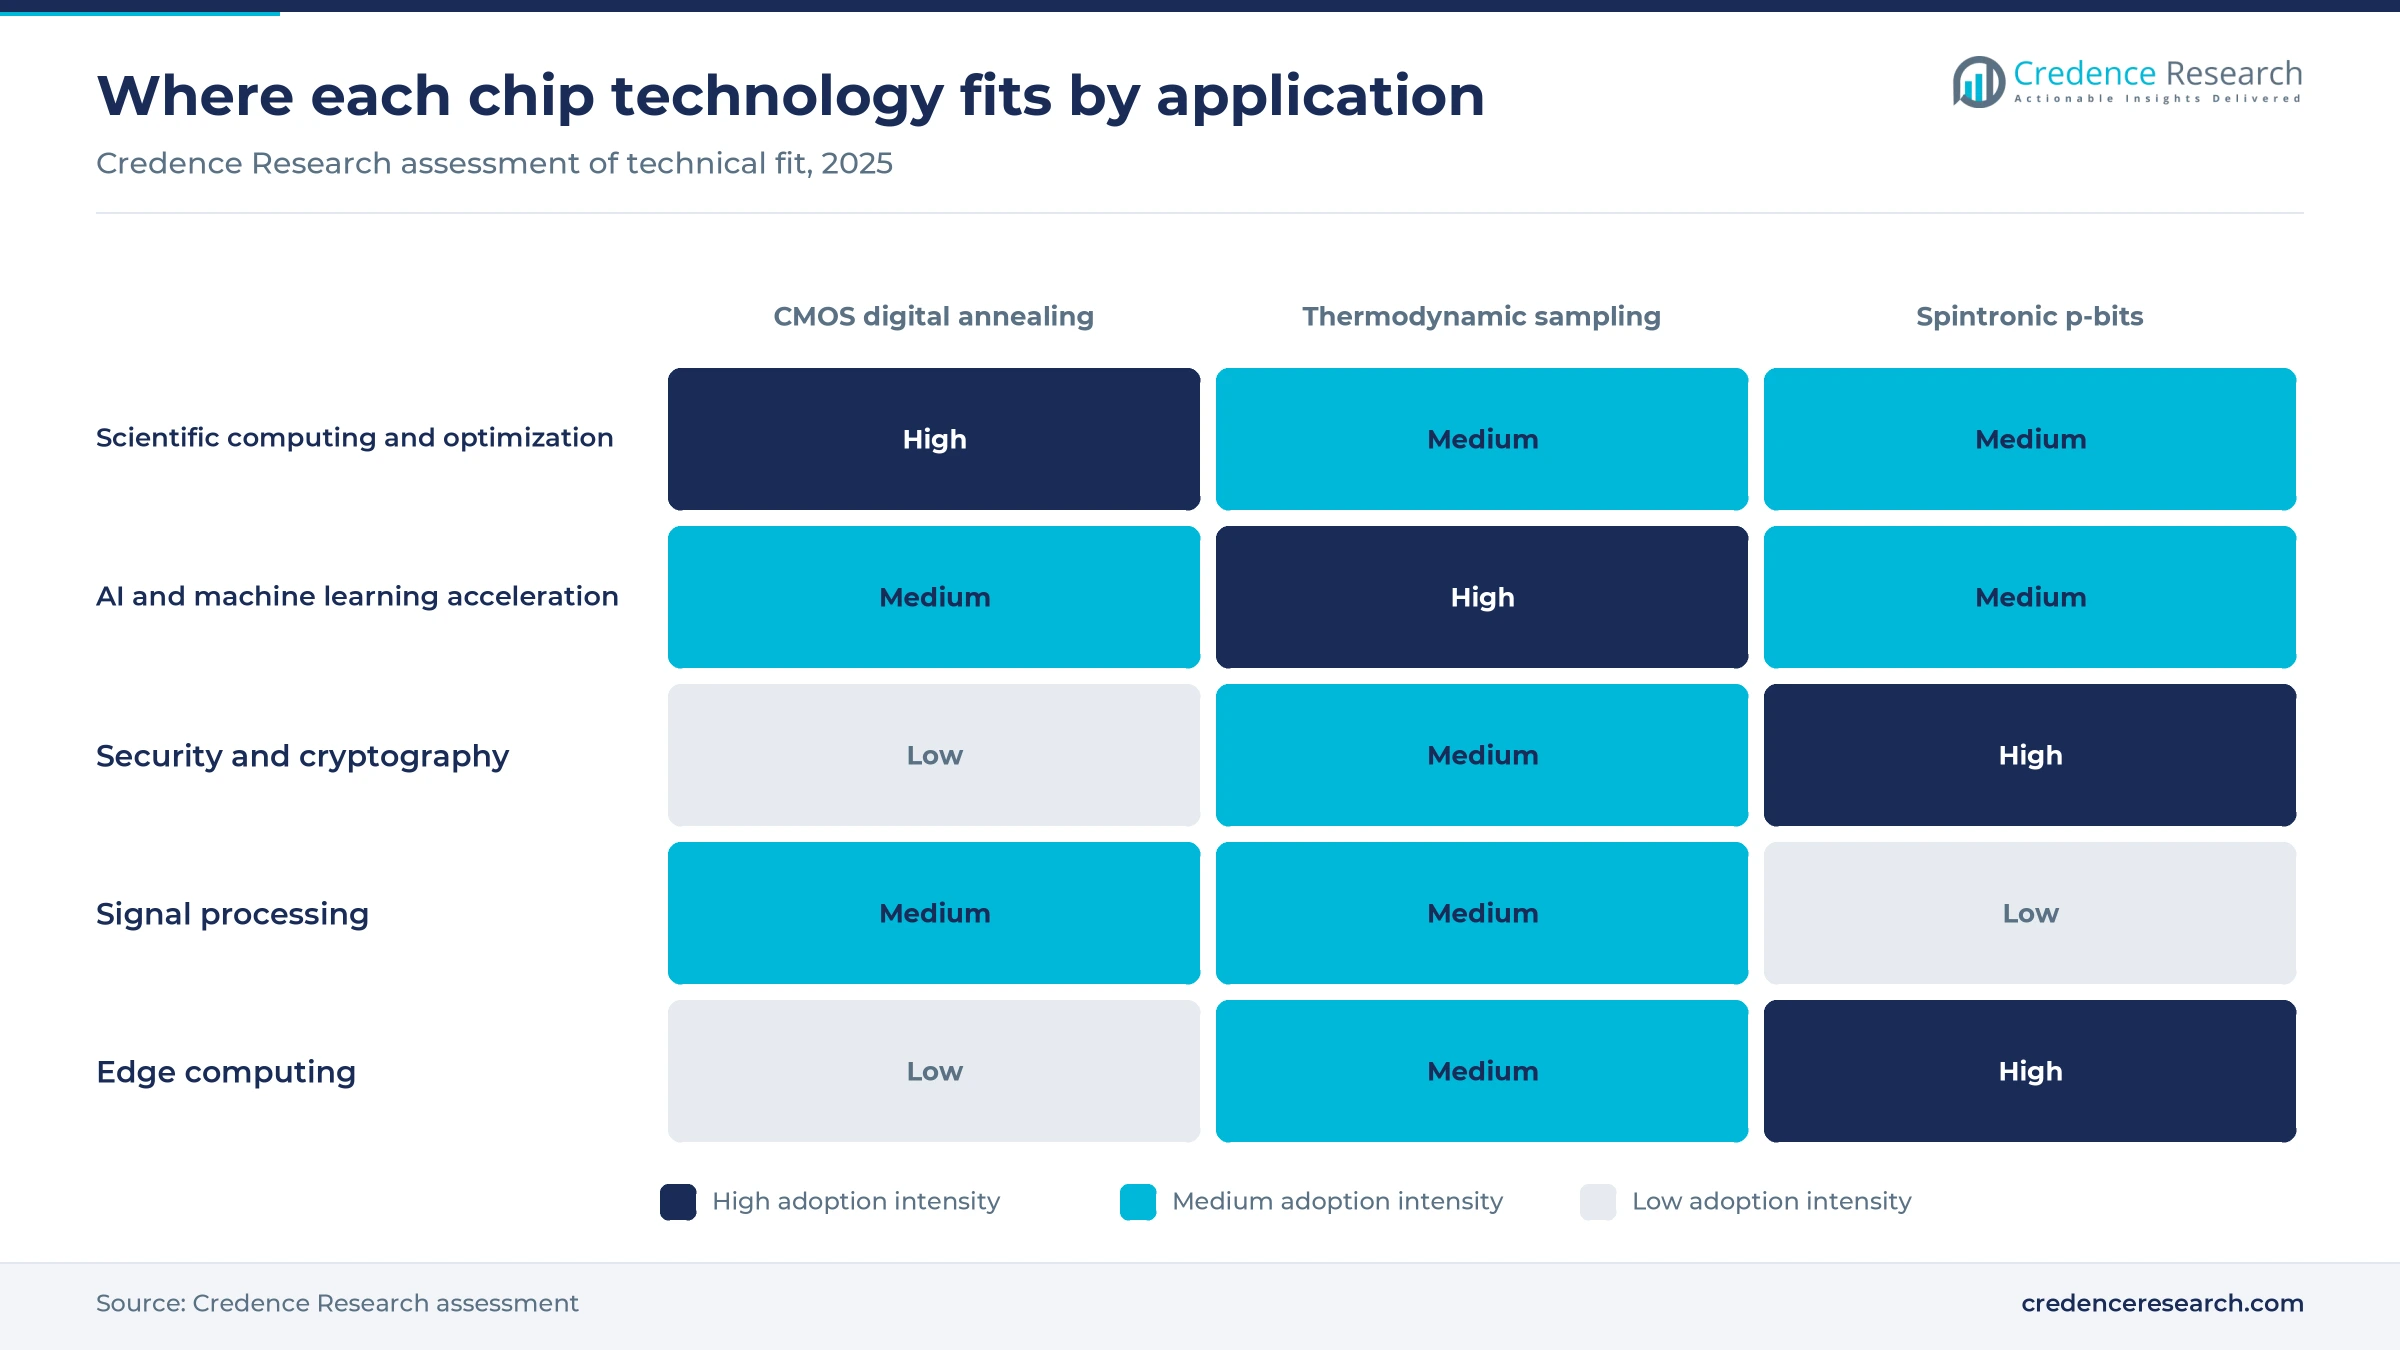
Based on application, the market is categorized into scientific computing and optimization, AI and machine learning acceleration, security and cryptography, signal processing and edge computing. Scientific Computing and Optimization led with 35.0% of 2025 value because public programs fund these workloads first, and the Sandia-led COINFLIPS project targets Monte Carlo simulations and Bayesian neural networks, according to Sandia National Laboratories. AI and Machine Learning Acceleration grows fastest at 37.4% a year as developers aim chips at generative AI sampling, with Normal Computing planning its CN201 chip for high-resolution diffusion models in 2026. Edge and security uses stay small because no low-power product has been launched yet.
Research buyers lead while computing labs scale fastest
Based on end user, the market is categorized into research institutes and universities, high-performance computing labs, semiconductor companies, AI companies and startups, and defense and aerospace. Research Institutes and Universities led with 38.0% of 2025 value because most hardware still ships as research prototypes, and the University of California, Santa Barbara team behind a one-million p-bit machine had to network 18 FPGAs to reach that scale, according to IEEE Spectrum in July 2026. High-Performance Computing Labs grow fastest at 37.1% a year as system-level testing begins, with Extropic building an XTR-0 cluster for remote use by scientific and enterprise users.
CMOS designs dominate as thermodynamic chips reach silicon
Based on technology, the market is categorized into CMOS digital p-bit and annealing chips, thermodynamic mixed-signal chips and spintronic p-bit chips. CMOS Digital p-bit and Annealing chips led with 50.0% of 2025 value because standard logic processes are mature and cheap to access, and Hitachi's CMOS annealing machine reproduces Ising-model behavior on CMOS circuits, while Fujitsu's Digital Annealer, first built as a dedicated CMOS chip, now runs on conventional servers. Thermodynamic Mixed-Signal chips grow fastest at 37.9% a year as designs that harvest circuit noise reach silicon, and the U.K. funder ARIA reports that the CN101 chip was first produced in June 2025. Spintronic chips trail because magnetic junctions are only now reaching foundry wafers.
| Segment Group | Leading Sub-segment | Share, 2025 | Fastest-growing Sub-segment | CAGR, 2026–2035 |
|---|---|---|---|---|
| By Application | Scientific Computing and Optimization | 35.0% | AI and Machine Learning Acceleration | 37.4% |
| By End User | Research Institutes and Universities | 38.0% | High-Performance Computing Labs | 37.1% |
| By Technology | CMOS Digital p-bit and Annealing | 50.0% | Thermodynamic Mixed-Signal | 37.9% |
Prototype access, not unit price, sets spending today
Pricing in this market is set by access rather than by chip volume, because developers sell development systems, cloud time and funded engineering programs while production parts are not yet available. Neither Extropic nor Normal Computing publishes hardware prices, so the development system and program ranges in the table are Credence Research estimates. The reference prices that matter come from substitutes, since a buyer can emulate p-bits on a rented FPGA instance at USD 1.98 an hour or run sampling on rented GPUs. A probabilistic chip must show a large energy or speed advantage per task to justify a premium, so supplier margins depend on published benchmarks.
| Offer or comparator | Typical price or fee | Basis |
|---|---|---|
| Cloud FPGA instance for p-bit emulation, one FPGA | USD 1.98 per hour on demand | Vantage listing of AWS f2.6xlarge, November 2026 |
| NVIDIA H100 GPU rental, comparator | About USD 2.37 per GPU-hour | IEEE Spectrum, May 2025 |
| Thermodynamic or p-bit development system | USD 15,000–60,000 per desktop unit | Credence Research estimate from FPGA host boards, custom chip packaging and low-volume assembly costs |
| Funded prototype tape-out and engineering program | USD 0.5–5 million per program | Credence Research estimate from mature-node shuttle costs and disclosed public funding ceilings |
Request a Free Sample
Fill in your details and we'll send you a free sample report.
- Sample data tables & charts
- Research methodology
AI power limits and public funds pull chips into silicon
AI power limits push buyers toward sampling hardware
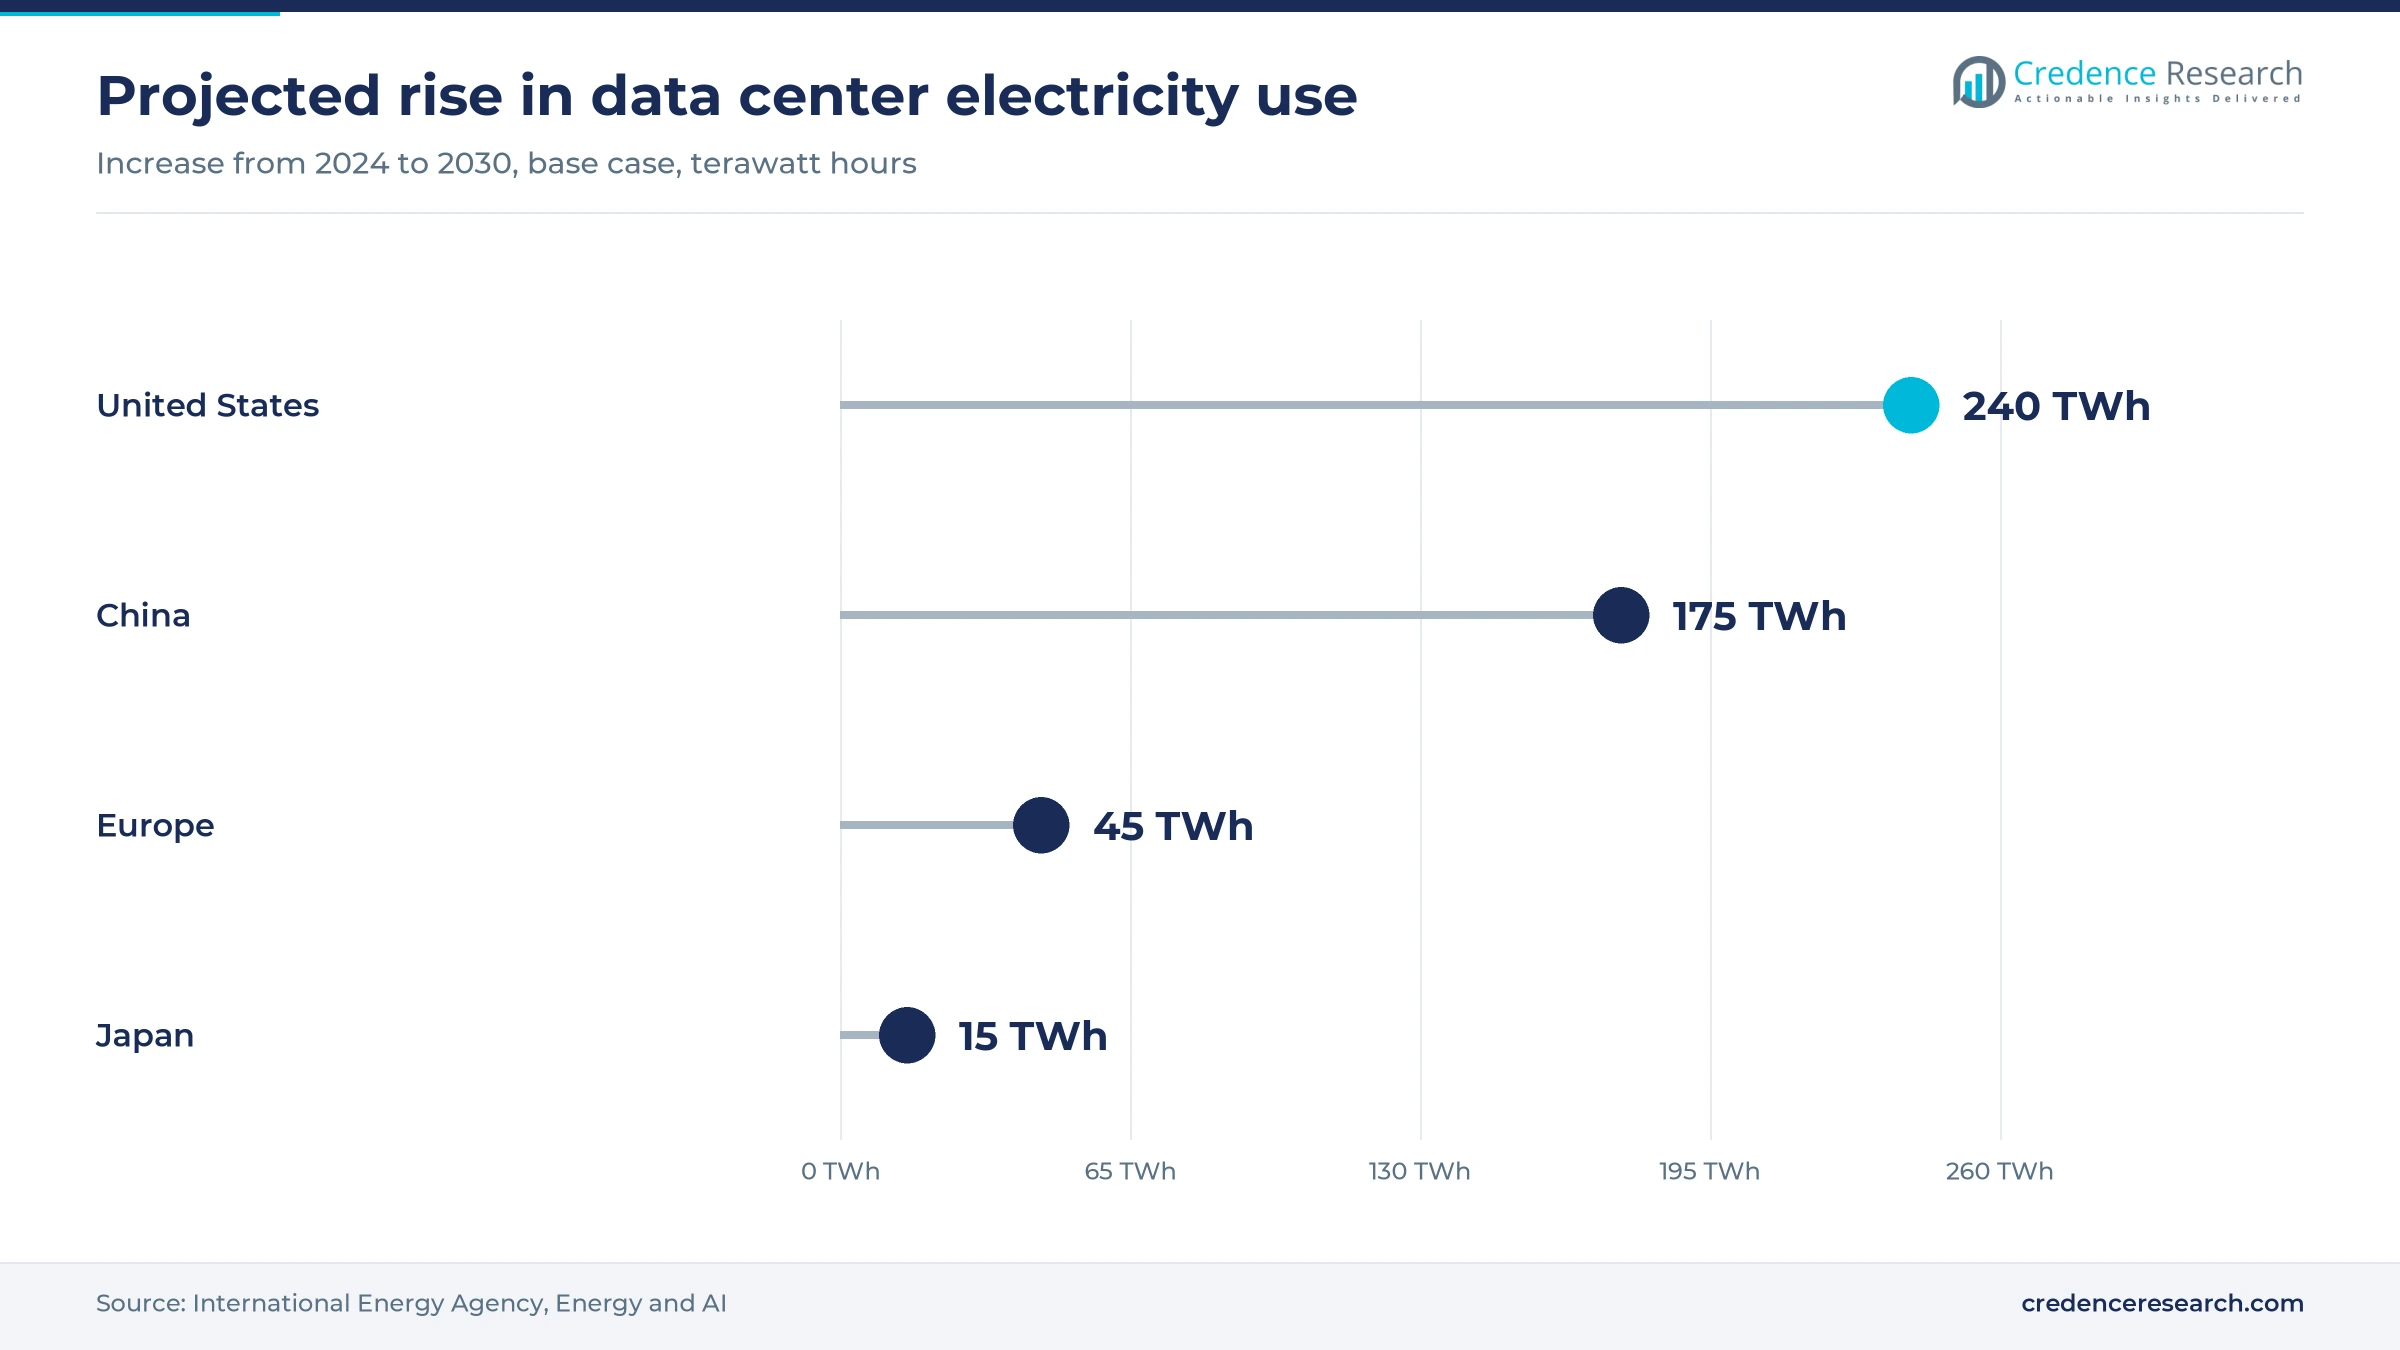
Electricity constraints at AI data centers are the strongest pull on probabilistic hardware, because sampling and optimization tasks map poorly onto deterministic GPU logic, which has to simulate randomness step by step. The International Energy Agency estimates data center electricity use at about 415 TWh in 2024 and projects roughly 945 TWh by 2030 in its base case. Normal Computing claims gains of up to 1,000 times on targeted AI and scientific workloads for its CN101 chip, while Extropic claims up to 10,000 times for suitable workloads with its compilation library. Both figures come from the developers and remain unverified at scale. Operators facing grid caps are the first commercial audience, since these chips would sit beside existing data center accelerators rather than replace them.
Public chip programs fund the step from lab to silicon
Government research budgets are paying for the costly transition from prototypes to production-grade chips, which private customers are not yet willing to fund. Extropic signed a non-binding letter of intent in July 2026 with the CHIPS Research and Development Office of the U.S. Department of Commerce for up to USD 75 million, tied to bringing its first Z1 clusters online and qualifying a domestic manufacturing path. In the United Kingdom, the Advanced Research and Invention Agency funded Normal Computing's thermodynamic matrix inversion project from October 2024, and the first CN101 chip test followed about 10 months later. ARIA has since committed an additional GBP 50 million to the same program for a Scaling Inference Lab. This public money lowers the risk for foundries and early buyers alike.
Strategic investors tie chip developers to memory makers
Strategic capital from semiconductor investors widens the route to market, because it links small chip designers to firms that can later integrate, package or buy the technology. Normal Computing raised USD 50 million in March 2026 in a round led by Samsung Catalyst, lifting its total funding above USD 85 million, according to SiliconANGLE. Micron Ventures was already among its investors, giving the company ties to two of the largest memory makers. The company also says its AI-based chip design software is used by five of the top 10 semiconductor design firms, which gives it customer relationships before its thermodynamic chips reach volume. These links shorten the path from prototype to design-in for suppliers that can show credible silicon.
Factory scheduling problems already pay for annealing
Manufacturers with large combinatorial planning problems provide the only established paying demand today, because annealing processors search scheduling and layout options faster than conventional solvers. Fujitsu and Toyota Systems launched a production instruction system using the Digital Annealer at Toyota's Tsutsumi plant in October 2022, with plans to extend it to other plants in Japan. In January 2026 the two companies reported automating connector pin placement for onboard electronic control units more than 20 times faster than conventional methods. Toyota Systems now plans to extend the approach to supplier companies, which widens the user base beyond one automaker. These references let suppliers sell measured outcomes rather than unproven chips.
Dedicated p-bit silicon and diffusion sampling openings
Shift from FPGA emulation to dedicated p-bit silicon
Developers are shifting from FPGA emulation toward dedicated chips to address the speed and power limits of software-defined p-bits, creating openings for custom silicon across optimization and sampling workloads. The one-million p-bit machine led by UCSB performs a trillion p-bit updates per second on reconfigurable chips, and a companion 7-nanometer design study projects one partition at about 0.66 square millimeters and 248 milliwatts, according to the university. Extropic says it has taped out its Z1 chip with 269,568 pbits and 215,904 coupling parameters, a large step from its earlier X0 prototype. The 7-nanometer figures are still projections rather than fabricated parts. Buyers will therefore judge this shift on measured results from the first dedicated chips.
Spintronic p-bits move onto foundry CMOS wafers
Research groups are shifting toward building stochastic magnetic tunnel junctions directly on foundry CMOS to address the cost of hand-assembled spintronic prototypes, creating openings for dense p-bit arrays in sampling hardware. Tohoku University and NIST built a spintronic p-bit on a silicon chip using SkyWater Technology's 130-nanometer process, with results published in IEEE Electron Device Letters in May 2026. In December 2025, Tohoku, UCSB and TSMC presented a fully digital p-bit design at IEDM that removes digital-to-analog converters, tolerates device-to-device variability and solved a 512-spin three-dimensional spin-glass test problem. Foundry participation matters because it turns spintronic p-bits from a laboratory device into a process option.
Diffusion model sampling opens an accelerator niche
Generative AI developers running diffusion models represent the clearest commercial opening, because these models spend most of their compute on repeated sampling steps that thermodynamic chips perform natively. Normal Computing plans CN301 for late 2027 or early 2028 to scale toward video diffusion, following the CN201 step. Extropic has released Torx, an open-source framework for stochastic differentiable programming that runs on its XTR-0 systems and on GPU simulators, and ARIA describes CN101 itself as designed for multi-modal diffusion inference. Inference providers that cut sampling energy would gain a cost advantage per generated image or video frame, although no independent benchmark against GPUs has been published yet.
Mature-node domestic fabs gain a new customer class
Mature-node foundries and packaging houses gain an opening because probabilistic chips do not need leading-edge transistors, so they can be made on older and cheaper lines. Extropic plans to fabricate its Z1.5 chip at a U.S. foundry and notes that mature-node capacity is available domestically, according to its July 2026 statement. Its X0 prototype, introduced in October 2025, was taped out in two variants and tested at two different fabs, the company says. The Tohoku and NIST device noted above, built on a 130-nanometer process, shows that magnetic junctions can be added above standard transistors. For mature-node fabs facing weaker legacy demand, these designs offer low-volume, high-mix wafer orders and engineering fees.
Unproven benchmarks and cheap GPUs slow adoption
Production silicon is still a year or more away
Buyers cannot yet budget for volume deployments, because no developer has shipped production probabilistic accelerators. Extropic made only dozens of XTR-0 desktop systems for early adopters, and its Z1 M.2 sticks, PCIe cards and clusters are scheduled for early access in 2027. Normal Computing's follow-on chips remain on its roadmap rather than in customer hands. Data center operators and AI startups are most exposed, since they must run pilots on prototypes while competing hardware ships today.
Problems must be rewritten before chips can help
Software conversion is a hidden cost, because existing AI and optimization code must be recast as energy-based models or Ising formulations before stochastic hardware can run it. The January 2026 control unit project required converting a trained AI model into mathematical expressions before the Digital Annealer could optimize pin placement. Fujitsu moves customers through workshops, trial access and proof-of-concept validation before commercial deployment, according to a Fujitsu-sponsored CIO article in August 2026. Engineering teams without that modeling skill face long pilot cycles.
Cheap GPU and FPGA time sets a hard price ceiling
General-purpose hardware keeps getting cheaper to rent, which limits the premium a new accelerator can charge. NVIDIA H100 rental averaged about USD 2.37 per GPU-hour in May 2025, according to IEEE Spectrum, and the same CIO article says Fujitsu's annealing service now runs on servers with conventional CPUs and GPUs. Startups without an independently measured efficiency lead over established AI chips are most exposed, because buyers can emulate p-bits in software at low cost.
Funding commitments are conditional and concentrated
Much of the near-term spending depends on conditional public money and on two venture-backed thermodynamic chip developers. The Commerce Department letter of intent described above was announced in July 2026 as non-binding and subject to definitive agreements and project milestones. Foundries, packaging partners and investors are exposed if those milestones slip, because few other chip programs could replace the lost volume. A delay at either developer would push supplier revenue further out.
North America leads as Asia Pacific grows fastest
| Region | Value, 2025 (USD million) | Share, 2025 | CAGR, 2026–2035 |
|---|---|---|---|
| North America | 26.1 | 45.0% | 35.3% |
| Asia Pacific | 18.6 | 32.0% | 36.0% |
| Europe | 9.3 | 16.0% | 34.4% |
| Middle East & Africa | 2.3 | 4.0% | 34.1% |
| Latin America | 1.7 | 3.0% | 34.0% |
North America leads on public programs and chip designers
North America held 45.0% of 2025 value in the market and grows at 35.3% a year. The lead exists because U.S. agencies fund most system-level work, and the Commerce Department and Department of Energy programs described above would anchor both prototype testing and a domestic manufacturing path. The IEA projects U.S. data center electricity use to rise by about 240 TWh, or 130%, between 2024 and 2030, which keeps hyperscale operators interested in lower-power accelerators. Canada and Mexico add little direct demand to the regional total so far.
Asia Pacific grows fastest on Japanese devices and services
Asia Pacific held 32.0% of 2025 value and is the fastest-growing region at 36.0% a year. Growth comes from Japan, which combines CMOS annealing chip development at Hitachi, spintronic device research at Tohoku University and foundry partners. Fujitsu began offering Digital Annealer cloud computing in Japan in May 2018, and Tohoku University leads much of the published p-bit device work. TSMC's role in the IEDM design gives the region a manufacturing route for magnetic p-bits. The IEA projects Chinese data center electricity use to rise by about 175 TWh, or 170%, by 2030, although no Chinese probabilistic chip program could be verified for this edition.
Europe builds demand through U.K. research funding
Europe held 16.0% of 2025 value and grows at 34.4% a year, with the United Kingdom as its most active market for probabilistic chip demand. The new ARIA inference lab noted above, announced in March 2026, gives European researchers access to new inference hardware. The IEA expects European data center electricity use to grow by more than 45 TWh, or 70%, by 2030, a slower rise than in the United States or China. No European developer of production probabilistic chips could be verified, so most demand flows to imported prototypes.
Middle East & Africa enters through Gulf research ties
Middle East & Africa held 4.0% of 2025 value and grows at 34.1% a year, with demand led by Gulf research universities. King Fahd University of Petroleum and Minerals in Saudi Arabia is named among the authors of the one-million p-bit study, according to UCSB, which places the region inside one of the field's main research collaborations. No commercial deployment could be verified for this edition, and the regional rate reflects a small base rather than any verified program. Demand from African buyers remains negligible over the forecast period.
Latin America remains the smallest and least certain region
Latin America held 3.0% of 2025 value and grows at 34.0% a year, which makes it the smallest region in the market. Its rate reflects a small base rather than any verified program. No verified probabilistic chip program, annealing deployment or supplier office was found in the region for this edition, so the estimate rests on university purchases of development systems and cloud access to annealing services. Demand depends on whether cloud delivery reaches local research networks, since importing on-premises prototypes is costly. This evidence gap makes the regional estimate the least certain in the report.
Tape-outs, research platforms and funding, 2025 to 2026
| Development | Status and market relevance |
|---|---|
| In August 2025, Normal Computing announced the tape-out of CN101, which it describes as the first thermodynamic computing chip, for matrix operations and stochastic sampling. | Tape-out completed and first chip test reported successful in August 2025; a working prototype, not yet a product. |
| In October 2025, Extropic introduced its X0 chip and the XTR-0 desktop research platform, its first way of linking probabilistic circuits to a conventional computer. | Launch of a research platform shipped to early adopters; X0 itself is too small for commercial workloads. |
| In March 2026, Normal Computing announced a USD 50 million funding round led by Samsung Catalyst for its thermodynamic chips and chip design software. | Completed financing announced March 25, 2026, bringing total funding above USD 85 million. |
| In May 2026, Tohoku University and NIST published a spintronic p-bit integrated on a CMOS chip made with SkyWater Technology's foundry process. | Research demonstration in IEEE Electron Device Letters; the next step is raising the number of integrated p-bits. |
| In July 2026, Extropic signed a letter of intent with the U.S. Department of Commerce CHIPS Research and Development Office for up to USD 75 million. | Non-binding plan subject to definitive agreements and milestones, covering Z1 clusters and a U.S. foundry for Z1.5. |
Annealing, spintronic and thermodynamic designs compete
- Digital annealing processors update many binary variables in parallel in CMOS logic to search optimization problems, and they are the most mature commercial form.
- FPGA-emulated p-bits implement probabilistic bits in reconfigurable logic, which lets researchers scale designs before committing to a custom chip.
- Stochastic magnetic tunnel junctions flip between two resistance states under thermal noise, giving each p-bit a compact and low-power random source.
- Thermodynamic sampling circuits let noisy analog or mixed-signal cells settle into probability distributions, so the chip returns samples instead of computing them step by step.
- Energy-based model software maps AI and optimization tasks onto these chips, with open frameworks such as Torx running on both hardware and GPU simulators.
Need a Custom Version of This Report?
Tailor the scope, geography, or segments to your exact requirements.
- Custom geography or segment scope
- Direct access to our analyst team
A few chip designers and foundries shape supply
Competition in the probabilistic computing ASIC market is decided by who can show working silicon and a usable software stack, not yet by price or volume. Fujitsu competes with the only long-running commercial service, selling optimization outcomes to manufacturers through staged trials and proof-of-concept projects. Extropic and Normal Computing compete as venture-backed thermodynamic chip designers, each pairing its chips with its own software and seeking public co-funding to reach production. Hitachi competes as a developer of CMOS annealing machines that reproduce Ising-model behavior on standard circuits for combinatorial optimization. Large GPU and CPU vendors are not profiled, because no probabilistic chip product from them could be verified, but they remain the benchmark every buyer uses. University partnerships give the developers access to device research without building their own fabs.
A thin supply base split between designers and foundries
The supply side is highly concentrated, with one long-running annealing service, two venture-backed thermodynamic chip developers and a group of university laboratories producing most verified hardware. Entry barriers are lower in fabrication than for conventional AI processors, since the designs run on mature nodes, but higher in software, because each architecture needs its own compiler and model library. Margins today sit with design teams that sell research systems, cloud access and funded engineering work rather than chips in volume. Foundries such as TSMC and SkyWater Technology sit outside the profiled players but earn modest wafer and engineering fees, and their share of value rises only once production volumes start.
Companies profiled and their roles in this market
| Company | Type | Role in the market |
|---|---|---|
| Fujitsu Limited | Annealing processor supplier | Sells Digital Annealer optimization as a computing service, now delivered mostly on conventional servers |
| Extropic | Thermodynamic chip developer | Develops X0 and Z1 thermodynamic sampling chips and XTR-0 development systems |
| Normal Computing | Thermodynamic chip developer | Develops the CN101 thermodynamic chip series and AI-based chip design software |
| Hitachi, Ltd. | Annealing chip developer | CMOS annealing machine reproducing Ising-model behavior on CMOS circuits for combinatorial optimization |
An early market priced on a few silicon results
Credence Research's view is that the probabilistic computing ASIC market is still research-funded, with one commercial foothold in industrial optimization, and its forecast is best read as an option on a few silicon results. The chips taped out in 2025 and 2026 will show by 2027 whether developer efficiency claims hold outside the lab. Unlike quantum computers, these chips run at room temperature on standard CMOS lines, which keeps the cost of a pilot low. High-performance computing labs, the fastest-growing end-user segment at 37.1% a year, should be the first buyers to test cards at system scale. Suppliers that pair silicon with compilers and published benchmarks should capture most of the value.
Earlier estimate rolled forward and rebuilt bottom up
The report uses 2025 as the base year and forecasts to 2035. The earlier published estimate for the probabilistic computing ASIC market was rolled forward one year at its own growth rate and then checked against a bottom-up view of annealing service revenue, publicly funded prototype programs, development system shipments and foundry engineering work. This edition lowers the earlier value to USD 58.0 million for 2025, because annealing services that now run on conventional servers fall outside a chip-based scope, and the figure remains a model estimate because no official statistic separates this activity. Regional and segment shares are Credence Research estimates built from the location of chip developers, funding programs and research groups. Sources used are government agency releases, company announcements, peer-reviewed publications and technology press. No interviews or surveys were conducted for this edition of the report.
Shipped accelerator cards will set the pace to 2035
Through 2035 growth depends on the move from tape-outs to shipped accelerator cards. The next two years will be decided by early-access results on Z1 and the CN series, and by whether public funding plans become signed awards. If those steps succeed, data center operators should start buying probabilistic cards for sampling-heavy inference around the end of the decade, while annealing services keep growing in manufacturing. Spintronic p-bits are likely to follow later, once foundries offer integrated magnetic junctions as a standard option. In the base case, market value rises from USD 78.5 million in 2026 to USD 1.19 billion in 2035, with most of the gain arriving after 2030.
Silicon results decide which growth path holds
The range of outcomes depends mainly on whether the chips taped out in 2025 and 2026 match their developers' efficiency claims on real workloads. If independent benchmarks confirm large energy savings on diffusion sampling and optimization, early-access buyers convert into volume orders after 2027 and growth runs above the base case. If results are modest, GPUs and FPGA emulation keep most workloads and spending stays inside research budgets. The pace at which conditional public funding turns into signed awards shifts the timing in both directions.
| Scenario | CAGR, 2026–2035 | Value, 2035 | What has to hold |
|---|---|---|---|
| Downside | 27.3% | USD 688.9 million | Benchmarks disappoint and spending stays in research budgets and optimization services |
| Base | 35.30% | USD 1.19 billion | Early-access cards ship in 2027 and public funding plans become signed awards |
| Upside | 40.3% | USD 1.65 billion | Independent tests confirm large energy savings and data centers order cards in volume |
Frequently Asked Questions
How big is the probabilistic computing ASIC market?
What does the probabilistic computing ASIC market include?
Which application holds the largest share?
Which technology is growing fastest?
Which region leads the market?
Which companies lead the market?
Are probabilistic chips commercially available?
How do probabilistic chips differ from quantum computers?
Table of Content
Chapter 1 Market Segmentation
- 1.1 Segmentation Framework
- 1.1.1 Product and Service Classification
- 1.1.2 Application and End-Use Classification
- 1.1.3 Technology and Solution Classification
- 1.1.4 Customer and Distribution Channel Classification
- 1.1.5 Geographic Segmentation
- 1.1.6 Market Segment Definitions and Boundaries
- 1.2 By Application
- 1.2.1 Scientific Computing and Optimization
- 1.2.2 AI and Machine Learning Acceleration
- 1.2.3 Security and Cryptography
- 1.2.4 Signal Processing
- 1.2.5 Edge Computing
- 1.3 By End User
- 1.3.1 Research Institutes and Universities
- 1.3.2 High-Performance Computing Labs
- 1.3.3 Semiconductor Companies
- 1.3.4 AI Companies and Startups
- 1.3.5 Defense and Aerospace
- 1.4 By Technology
- 1.4.1 CMOS Digital p-bit and Annealing
- 1.4.2 Thermodynamic Mixed-Signal
- 1.4.3 Spintronic p-bit
Chapter 2 Introduction
- 2.1 Report Objectives and Scope
- 2.2 Product Definition and Industry Terminology
- 2.3 Market Inclusions and Exclusions
- 2.4 Research Process
- 2.4.1 Primary Research and Expert Interviews
- 2.4.2 Secondary Research and Source Review
- 2.4.3 Top-Down and Bottom-Up Estimation
- 2.4.4 Data Triangulation and Verification
- 2.5 Market Size Measurement Basis
- 2.5.1 2025: USD 58.0 million → 2035: USD 1.19 billion
- 2.6 Historical and Forecast Reference Periods
- 2.6.1 Historical Period: 2018-2025
- 2.6.2 Base Year: 2025
- 2.6.3 Forecast Period: 2025-2035
- 2.7 Research Assumptions and Limitations
Chapter 3 Executive Summary
- 3.1 Market Snapshot and Key Findings
- 3.2 Base-Year Market Size, 2025
- 3.3 Forecast Market Size, 2035
- 3.4 Revenue and Volume Growth Outlook
- 3.5 Key Demand and Supply Indicators
- 3.6 Leading Market Segments
- 3.7 Fastest-Growing Market Opportunities
- 3.8 Regional Performance Highlights
- 3.9 Technology and Industry Transformation
- 3.10 Competitive Landscape Summary
- 3.11 Analyst View and Strategic Implications
Chapter 4 Global Probabilistic Computing ASIC Market Trends and Developments
- 4.1 Historical Industry Development, 2018-2025
- 4.2 Recent Market Trends and Developments
- 4.3 Demand and Customer Behavior Trends
- 4.4 Technology and Product Innovation
- 4.5 Artificial Intelligence, Automation and Digitalization
- 4.6 Local Manufacturing and Supply Chain Realignment
- 4.7 Industry Partnerships, Mergers and Acquisitions
- 4.8 Sustainability and Circular Economy Developments
- 4.9 Government and Private Sector Investment Trends
- 4.10 Emerging Business Models and Commercialization
- 4.11 Industry Developments and Announcements
Chapter 5 Global Probabilistic Computing ASIC Market Production, Supply and Demand Analysis
- 5.1 Demand Trend and Consumption Analysis, 2018-2025
- 5.2 Demand Forecast, 2025-2035
- 5.3 Production and Output Trend, 2018-2025
- 5.4 Production and Output Forecast, 2025-2035
- 5.5 Installed Capacity and Capacity Utilization
- 5.6 Company-Wise Production Plants and Statistics
- 5.6.1 Installed Production Capacity
- 5.6.2 Actual Production
- 5.6.3 Planned Capacity and Expansion Targets
- 5.7 Supply Chain Structure and Procurement Trends
- 5.8 Supply-Demand Gap and Bottlenecks
- 5.9 Import Dependence and Sourcing Structure
- 5.10 Contract Manufacturing and Outsourcing
- 5.11 Regional Supply and Demand Concentration
Chapter 6 Global Probabilistic Computing ASIC Market Pricing Analysis
- 6.1 Pricing Structure and Measurement
- 6.2 Historical Pricing Trends, 2018-2025
- 6.3 Pricing Outlook, 2025-2035
- 6.4 Average Selling Price and Unit Economics
- 6.5 Pricing by Product and Market Segment
- 6.6 Geographic Pricing Differences
- 6.7 Key Input, Energy, Labor and Logistics Costs
- 6.8 Contract Pricing and Purchasing Models
- 6.9 Pricing Sensitivity and Competitive Positioning
- 6.10 Price, Margin and Profitability Implications
Chapter 7 Global Probabilistic Computing ASIC Market Dynamics
- 7.1 Market Growth Drivers
- 7.1.1 Demand-Side Drivers
- 7.1.2 Technology and Innovation Drivers
- 7.1.3 Infrastructure and Investment Drivers
- 7.1.4 Regulatory and Policy Drivers
- 7.2 Market Restraints
- 7.2.1 Cost and Affordability Constraints
- 7.2.2 Technology and Adoption Barriers
- 7.2.3 Supply Chain and Operational Constraints
- 7.3 Market Challenges
- 7.3.1 Competitive Pressure and Margin Erosion
- 7.3.2 Skills, Infrastructure and Implementation Gaps
- 7.4 Emerging Market Opportunities
- 7.5 Market Dynamics Impact and Time-Horizon Assessment
Chapter 8 Global Probabilistic Computing ASIC Value Chain Analysis
- 8.1 Industry Value Chain Overview
- 8.2 Upstream Suppliers and Critical Inputs
- 8.3 Technology and Component Providers
- 8.4 Manufacturing or Service Delivery
- 8.5 Distribution, Channel Partners and Integrators
- 8.6 Downstream Applications and End Users
- 8.7 Value Addition and Profit Pools
- 8.8 Vertical Integration and Outsourcing
- 8.9 Supplier Concentration and Risk
- 8.10 Supply Chain Localization and Resilience
Chapter 9 Global Probabilistic Computing ASIC Market Regulations and Policies
- 9.1 Relevant Laws, Standards and Compliance Frameworks
- 9.2 Product, Service, Safety and Quality Requirements
- 9.3 Government Policies, Incentives and Subsidies
- 9.4 Imports, Exports and Trade Barriers
- 9.5 Public Procurement and Local Content Requirements
- 9.6 Environmental and Sustainability Compliance
- 9.7 Data Protection, AI and Cybersecurity Compliance
- 9.8 Upcoming Policy Changes and Market Implications
Chapter 10 Global Probabilistic Computing ASIC Market Hotspots and Opportunities
- 10.1 Market Opportunity Mapping and Growth Hotspots
- 10.2 High-Growth Applications and Customer Groups
- 10.3 Underserved Markets and White-Space Opportunities
- 10.4 Emerging Technology and Product Opportunities
- 10.5 New Capacity and Investment Hotspots
- 10.6 Market Entry and Expansion Opportunities
- 10.7 Distribution and Partnership Opportunities
- 10.8 Near-Term and Long-Term Commercial Potential
- 10.9 Opportunity Attractiveness and Execution Risks
Chapter 11 Global Probabilistic Computing ASIC Market Outlook, 2025-2035
- 11.1 Market Size and Analysis
- 11.1.1 Revenue (Market Measurement: 2025: USD 58.0 million → 2035: USD 1.19 billion)
- 11.1.2 Market Volume and Quantity Sold
- 11.1.3 Historical Market Size, 2018-2025
- 11.1.4 Base-Year Market Size, 2025
- 11.2 Market Forecast, 2025-2035
- 11.2.1 Revenue Forecast to 2035
- 11.2.2 Volume Forecast to 2035
- 11.2.3 CAGR and Year-on-Year Growth
- 11.2.4 Incremental Revenue Opportunity
- 11.3 Forecast Assumptions and Scenario Analysis
- 11.3.1 Base-Case Forecast
- 11.3.2 Optimistic and Conservative Scenarios
- 11.3.3 Technology, Pricing and Policy Sensitivities
- 11.4 Market Attractiveness and Growth Outlook
Chapter 12 Global Probabilistic Computing ASIC Market Segmentation and Outlook
- 12.1 Segmentation Summary and Market Shares, 2025
- 12.2 Largest and Fastest-Growing Segments
- 12.3 By Application - Market Size and Forecast, 2025-2035
- 12.3.1 Segment Definition and Scope
- 12.3.2 Historical Market Size, 2018-2025
- 12.3.3 Revenue Forecast, 2025-2035
- 12.3.4 Volume Forecast, 2025-2035
- 12.3.5 Base-Year Market Share, 2025
- 12.3.6 Segment CAGR and Growth Drivers
- 12.3.7 Subsegment Market Size and Forecast
- 12.3.7.1 Scientific Computing and Optimization
- 12.3.7.2 AI and Machine Learning Acceleration
- 12.3.7.3 Security and Cryptography
- 12.3.7.4 Signal Processing
- 12.3.7.5 Edge Computing
- 12.3.8 Subsegment Pricing and Adoption Trends
- 12.3.9 Leading Suppliers and Competition
- 12.3.10 Regional Demand and Opportunities
- 12.4 By End User - Market Size and Forecast, 2025-2035
- 12.4.1 Segment Definition and Scope
- 12.4.2 Historical Market Size, 2018-2025
- 12.4.3 Revenue Forecast, 2025-2035
- 12.4.4 Volume Forecast, 2025-2035
- 12.4.5 Base-Year Market Share, 2025
- 12.4.6 Segment CAGR and Growth Drivers
- 12.4.7 Subsegment Market Size and Forecast
- 12.4.7.1 Research Institutes and Universities
- 12.4.7.2 High-Performance Computing Labs
- 12.4.7.3 Semiconductor Companies
- 12.4.7.4 AI Companies and Startups
- 12.4.7.5 Defense and Aerospace
- 12.4.8 Subsegment Pricing and Adoption Trends
- 12.4.9 Leading Suppliers and Competition
- 12.4.10 Regional Demand and Opportunities
- 12.5 By Technology - Market Size and Forecast, 2025-2035
- 12.5.1 Segment Definition and Scope
- 12.5.2 Historical Market Size, 2018-2025
- 12.5.3 Revenue Forecast, 2025-2035
- 12.5.4 Volume Forecast, 2025-2035
- 12.5.5 Base-Year Market Share, 2025
- 12.5.6 Segment CAGR and Growth Drivers
- 12.5.7 Subsegment Market Size and Forecast
- 12.5.7.1 CMOS Digital p-bit and Annealing
- 12.5.7.2 Thermodynamic Mixed-Signal
- 12.5.7.3 Spintronic p-bit
- 12.5.8 Subsegment Pricing and Adoption Trends
- 12.5.9 Leading Suppliers and Competition
- 12.5.10 Regional Demand and Opportunities
- 12.6 Segment Growth Comparison
- 12.7 Segment Attractiveness and Priority Matrix
Chapter 13 Global Probabilistic Computing ASIC End-Use and Application Market Outlook
- 13.1 End-Use Industry and Customer Demand Structure
- 13.2 Leading Applications and Customer Groups
- 13.3 End-Use Market Size, Share and Forecast
- 13.4 Major End-Use Industry Deep Dives
- 13.4.1 Customer Requirements and Use Cases
- 13.4.2 Demand and Replacement Cycles
- 13.4.3 Technical and Regulatory Considerations
- 13.4.4 Purchasing and Procurement Models
- 13.4.5 Leading Vendors and Distribution Channels
- 13.4.6 Forecast and Commercial Opportunities
- 13.5 Emerging Applications and Cross-Segment Demand
- 13.6 End-Use Industry Investment Priorities
Chapter 14 Global Probabilistic Computing ASIC Geographic Market Outlook, 2025-2035
- 14.1 Regional Market Size and Share, 2025
- 14.2 Regional Market Forecast, 2025-2035
- 14.3 Regional Pricing, Production and Demand Differences
- 14.4 North America
- 14.4.1 United States
- 14.4.2 Canada
- 14.4.3 Mexico
- 14.5 Europe
- 14.5.1 Germany
- 14.5.2 France
- 14.5.3 Italy
- 14.5.4 United Kingdom
- 14.5.5 Spain
- 14.5.6 Poland
- 14.5.7 Russia
- 14.5.8 Netherlands
- 14.5.9 Belgium
- 14.5.10 Sweden
- 14.5.11 Denmark
- 14.5.12 Norway
- 14.5.13 Rest of Europe
- 14.6 Asia Pacific
- 14.6.1 China
- 14.6.2 India
- 14.6.3 Japan
- 14.6.4 South Korea
- 14.6.5 Thailand
- 14.6.6 Indonesia
- 14.6.7 Vietnam
- 14.6.8 Malaysia
- 14.6.9 Australia
- 14.6.10 Rest of Asia Pacific
- 14.7 Latin America
- 14.7.1 Brazil
- 14.7.2 Argentina
- 14.7.3 Colombia
- 14.7.4 Chile
- 14.7.5 Rest of Latin America
- 14.8 Middle East
- 14.8.1 Saudi Arabia
- 14.8.2 United Arab Emirates
- 14.8.3 Turkey
- 14.8.4 Israel
- 14.8.5 Iran
- 14.8.6 Rest of the Middle East
- 14.9 Africa
- 14.9.1 South Africa
- 14.9.2 Egypt
- 14.9.3 Nigeria
- 14.9.4 Morocco
- 14.9.5 Rest of Africa
- 14.10 Regional Investment, Policy and Supply Chain Differences
- 14.11 Regional Competitive Landscape
- 14.12 Geographic Growth Hotspots
Chapter 15 Global Probabilistic Computing ASIC Technology, Innovation and Sustainability Outlook
- 15.1 Technology Landscape and Maturity
- 15.2 Product, Process and Service Innovation
- 15.3 AI, Automation and Digital Tools in the Industry
- 15.4 Technology Adoption and Performance Benchmarking
- 15.5 Innovation Pipeline and R&D Investment
- 15.6 Patent and Intellectual Property Trends
- 15.7 Energy Efficiency and Resource Management
- 15.8 Sustainability, Recycling and Circularity
- 15.9 Technology Roadmap, 2025-2035
- 15.10 Risks of Obsolescence and Technology Substitution
Chapter 16 Global Probabilistic Computing ASIC Market Key Strategic Imperatives
- 16.1 Growth and Market Entry Priorities
- 16.2 High-Return Products and Segments
- 16.3 Pricing, Profitability and Cost Optimization
- 16.4 Technology Investment and Product Differentiation
- 16.5 Supply Chain Localization and Resilience
- 16.6 Distribution and Customer Acquisition
- 16.7 Partnership, Acquisition and Capacity Strategy
- 16.8 Regional Expansion Priorities
- 16.9 Short-, Medium- and Long-Term Actions
Chapter 17 Competition Outlook
- 17.1 Industry Competition Characteristics
- 17.2 Market Structure and Concentration
- 17.3 Market Share and Competitive Positioning, 2025
- 17.4 Company-Wise Revenue and Product Benchmarking
- 17.5 Production and Service Capacity Benchmarking
- 17.6 Technology, Pricing and Differentiation
- 17.7 Regional Footprint and Distribution Strength
- 17.8 Mergers, Acquisitions and Strategic Alliances
- 17.9 New Entrants and Competitive Threats
- 17.10 Porter's Five Forces and Industry Attractiveness
- 17.11 Competitive Outlook, 2025-2035
Chapter 18 Company Profiles
- 18.1 Company Coverage and Selection Criteria
- 18.2 Fujitsu Limited
- 18.2.1 Business Description
- 18.2.2 Company Ownership and Geographic Presence
- 18.2.3 Product and Service Portfolio
- 18.2.4 Manufacturing and Operating Footprint
- 18.2.5 Production Capacity and Expansion Plans
- 18.2.6 Financial Performance and Investment
- 18.2.7 Market Share and Competitive Position
- 18.2.8 Technology and Innovation Capabilities
- 18.2.9 Strategic Alliances or Partnerships
- 18.2.10 Recent Developments
- 18.2.11 Growth Strategy and Outlook
- 18.3 Extropic
- 18.4 Normal Computing
- 18.5 Hitachi, Ltd.
- 18.6 Other Relevant Market Participants
Note: Every listed company is profiled on the structure shown under the first company. The company list is preliminary and may change based on research findings, market developments, data availability and client requirements.
Chapter 19 Disclaimer
- 19.1 Research and Forecast Disclaimer
- 19.2 Data Source and Estimation Limitations
Note: The depth of individual sections depends on data availability for this market. Volume, capacity, trade and other unit-based metrics are included where applicable.

