Home » Chemicals » Red Phosphorus Market

Red Phosphorus Market by Type (High Purity, Low Purity) by Distribution Channel (Textile, Plastic, Electricity & Electronics, Chemical, Agricultural, Metallurgical, Others)- Growth, Future Prospects And Competitive Analysis, 2016 – 2028

Price: $4999

Published: | Report ID: 9114 | Report Format : PDF

Market Insights

Red Phosphorus is an allotrope of phosphorous that appears reddish, soft, and highly reactive. It does not occur naturally but is created in controlled environments with organic phosphorous and oxygen supplies. It is a form of the chemical element phosphorous – Phosphorous is a fundamental part and is essential for life on earth, but it is a highly toxic halogen gas. Red Phosphorus is available in two grades: High Purity and Low Purity.

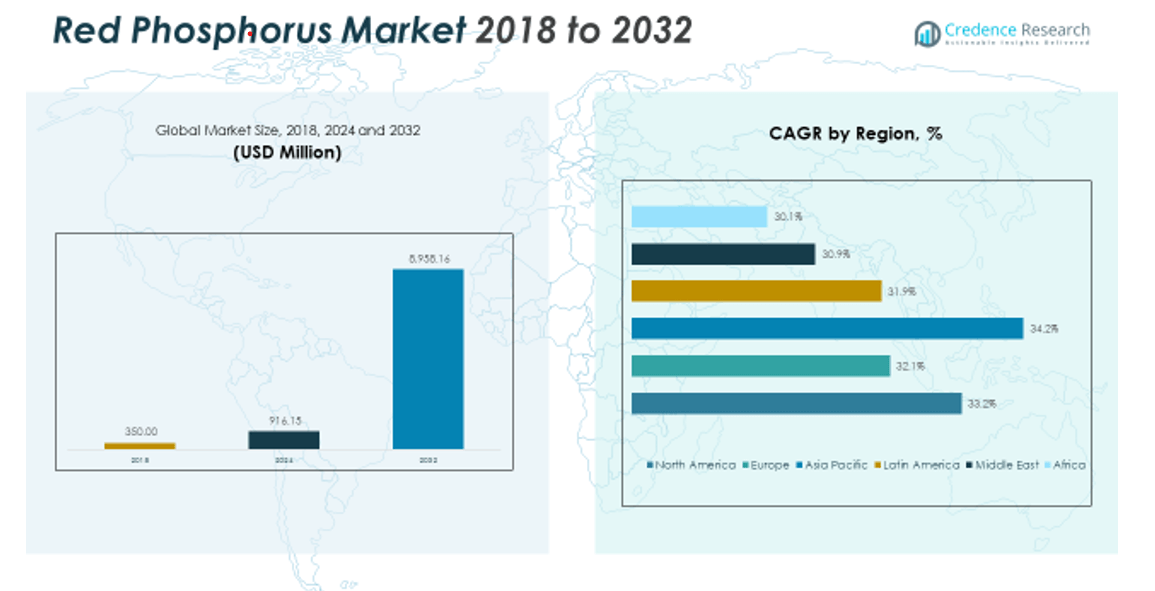
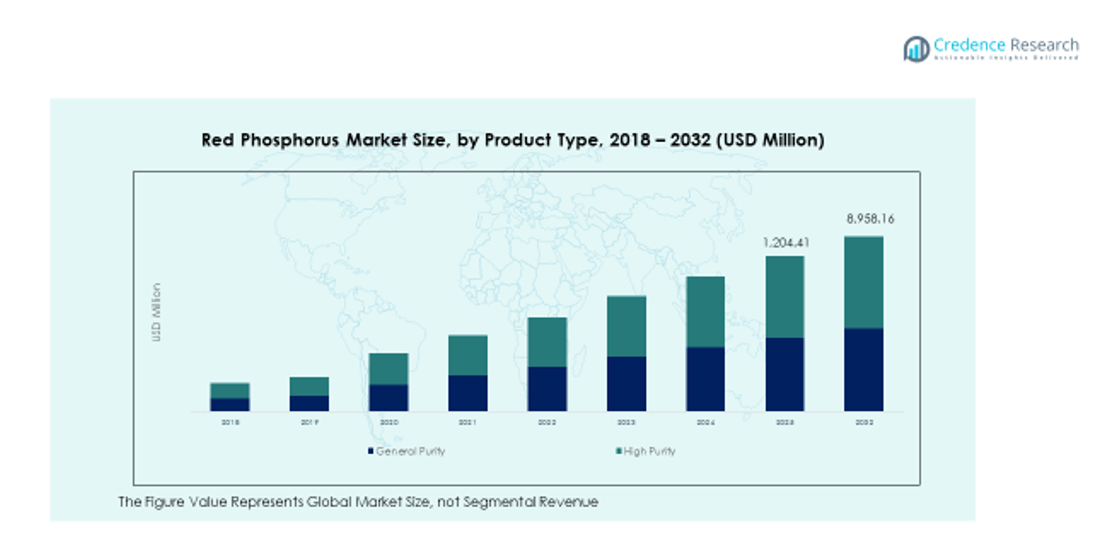
The Global Red Phosphorus market is expected to witness a CAGR of 4.80% during the forecast period. The revenue generated by the global Red Phosphorus market in 2021 was over USD 403.41 million and is expected to generate revenue worth USD 566.52 million in 2028. Therefore, the incremental growth opportunity offered by the global Red Phosphorus is estimated to be USD 3.46 billion between 2022 and 2028.

Design Element 2

Access crucial information at unmatched prices!

Request your free sample report today & start making informed decisions powered by Credence Research!

Download Free Sample
CTA Design Element 3

Interesting Facts about Red Phosphorus Industry

  • Red Phosphorus is widely used in flame retardant applications.
  • Red Phosphorus is in massive demand from fertilizers manufacturers.
  • Europe dominates the consumption of Red Phosphorus.
  • Red Phosphorus is derived from phosphate rock; in 2021, over 10 million tons of phosphate rock were produced.
  • The plastic and Textile industry also consumes a large volume of Red Phosphorus.

Wide-Ranging Applications

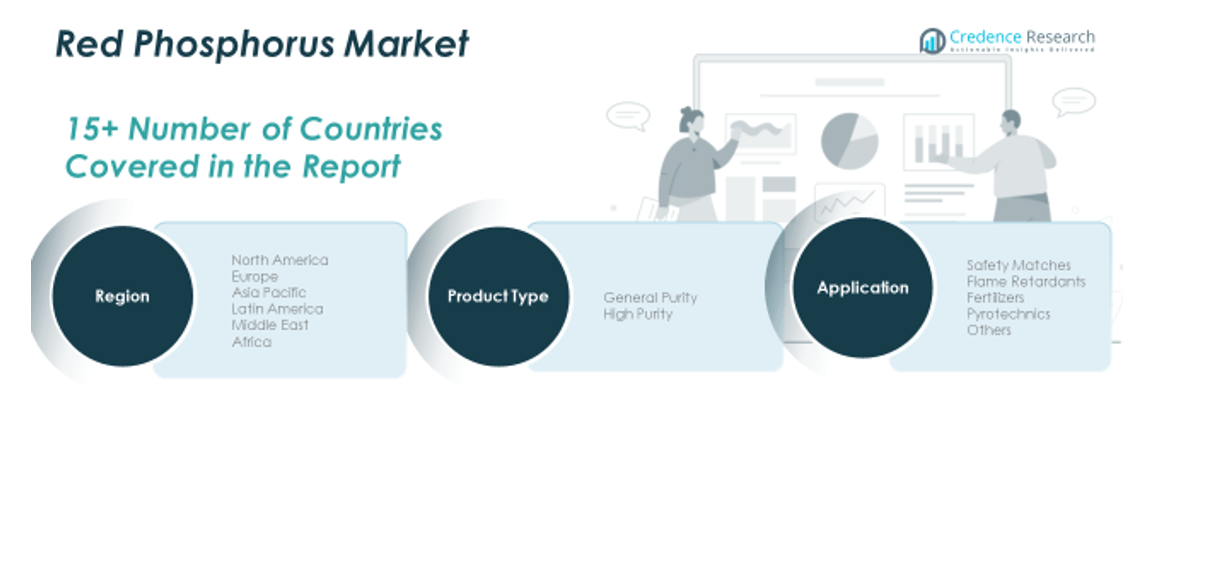
Some major application areas of Red Phosphorus include Textile, Plastic, Electricity & Electronics, chemicals, Agricultural, Metallurgical, and Others. Red Phosphorus is used in many different industries globally. However, the most significant sector using Red Phosphorus to improve the soil is the fertilizer and crop industry. Variants of Red Phosphorus include phosphoric acid, phosphorous pentaoxide, and phosphorous chloride, all of which have various uses in different industries.

Advancement in Technology

New and improved technological innovations have created new avenues for the Red Phosphorus manufacturing industries. However, the most significant driving factor of this market is the fertilizer market. Red Phosphorus is a crucial ingredient in manufacturing fertilizers and pesticides, which is expected to fuel this market further.

Red Phosphorus, specifically the 6N and 7N types, is also essential in the electronics and semiconductor industries. And the ever-increasing growth of the electronic industry, which in turn grows the semiconductor industry, will push this industry further over the forecasted period.

Electronics Industry to Boost the Demand for Red Phosphorus

Another industry that will be a key to the growth of the Red Phosphorus market is the lighting and LED industry. High purity Red Phosphorus is used in lighting applications like the Phosphor-converted white-light-emitting diodes, which have become the next generation in lighting applications. The demand for LED lights keeps rising due to their energy efficiency, longer lifespans than traditional lighting applications, and cost-effectiveness, all of which will assist in driving this market forward. Even further improvements and innovations in the lighting industry are expected to stimulate the market’s growth.

Furthermore, red Phosphorus is widely used in safety matches, pyrotechnics, smoke bombs, fireworks, and flame retardants. Therefore, all of these industries also affect the growth of the red phosphorus market.

Significant Environmental Concerns

The most significant restraining factor in this market is the prohibitions and regulations placed on the consumption and production of phosphorous. Governments, especially in developed countries, have been banning the import of red Phosphorus and other chemicals, which will hamper the growth of this market crucially. Due to this, market players will have to go for regions with more lenient or flexible policies.

Environmental concern is another factor that will slow down this market considerably. In addition, new research showing biodegradability issues regarding inorganic phosphates is also causing governments to ban its use in specific industries, impacting the Phosphorus and its derivatives industries.

Shape Your Report to Specific Countries or Regions & Enjoy 30% Off!

Battery Market to Offer Future Growth Avenue 

The use of red phosphorous in rechargeable batteries is a trend that is likely to take off during the forecasted period. With the rising production and demand for electric vehicles worldwide, there will be a rise in demand for lithium iron phosphate batteries, which have proven to be more stable and cost-effective than other batteries. In addition, the rising electric vehicle industry creates opportunities for new market players to enter and capture new contracts.

Akzo Nobel, Albemarle Corporation, BASF SE, Chemtura Corporation Limited, Clariant International Ltd., Huber Engineered Materials, Israel Chemicals Limited (ICL), Italmatch Chemicals, Lanxess AG, and Nabaltech AG are some of the leading players in the global Red Phosphorus market.

1. Preface
1.1. Report Description
1.1.1. Purpose of the Report
1.1.2. Target Audience
1.1.3. USP and Key Offerings
1.2. Research Scope
1.3. Research Methodology
1.3.1. Phase I – Secondary Research
1.3.2. Phase II – Primary Research
1.3.3. Phase III – Expert Panel Review
1.3.4. Approach Adopted
1.3.4.1. Top-Down Approach
1.3.4.2. Bottom-Up Approach
1.3.5. Assumptions
1.4. Market Segmentation

2. Executive Summary
2.1. Market Snapshot: Global Red Phosphorus Market

3. Market Dynamics & Factors Analysis
3.1. Introduction
3.1.1. Global Red Phosphorus Market Value, 2016-2028, (US$ Bn)
3.2. Market Dynamics
3.2.1. Key Growth Trends
3.2.2. Major Industry Challenges
3.2.3. Key Growth Pockets
3.3. Attractive Investment Proposition,2021
3.3.1. Type
3.3.2. Application
3.3.3. Geography
3.4. Porter’s Five Forces Analysis
3.4.1. Threat of New Entrants
3.4.2. Bargaining Power of Buyers/Consumers
3.4.3. Bargaining Power of Suppliers
3.4.4. Threat of Substitute Types
3.4.5. Intensity of Competitive Rivalry
3.5. Value Chain Analysis

4. Market Positioning of Key Players, 2021
4.1. Company market share of key players, 2021
4.2. Top 6 Players
4.3. Top 3 Players
4.4. Major Strategies Adopted by Key Players

5. COVID 19 Impact Analysis
5.1. Global Red Phosphorus Market Pre Vs Post COVID 19, 2019 – 2028
5.2. Impact on Import & Export
5.3. Impact on Demand & Supply

6. North America
6.1. North America Red Phosphorus Market, by Country, 2016-2028(US$ Bn)
6.1.1. U.S.
6.1.2. Canada
6.1.3. Mexico
6.2. North America Red Phosphorus Market, by Type, 2016-2028(US$ Bn)
6.2.1. Overview
6.2.2. High Purity
6.2.3. Low Purity
6.3. North America Red Phosphorus Market, by Application, 2016-2028(US$ Bn)
6.3.1. Overview
6.3.2. Textile
6.3.3. Plastic
6.3.4. Electricity & Electronics
6.3.5. Chemical
6.3.6. Agricultural
6.3.7. Metallurgical
6.3.8. Others

7. Europe
7.1. Europe Red Phosphorus Market, by Country, 2016-2028(US$ Bn)
7.1.1. UK
7.1.2. France
7.1.3. Germany
7.1.4. Italy
7.1.5. Russia
7.1.6. Spain
7.1.7. Belgium
7.1.8. Netherland
7.1.9. Austria
7.1.10. Sweden
7.1.11. Poland
7.1.12. Denmark
7.1.13. Switzerland
7.1.14. Rest of Europe
7.2. Europe Red Phosphorus Market, by Type, 2016-2028(US$ Bn)
7.2.1. Overview
7.2.2. High Purity
7.2.3. Low Purity
7.3. Europe Red Phosphorus Market, by Application, 2016-2028(US$ Bn)
7.3.1. Overview
7.3.2. Textile
7.3.3. Plastic
7.3.4. Electricity & Electronics
7.3.5. Chemical
7.3.6. Agricultural
7.3.7. Metallurgical
7.3.8. Others

8. Asia Pacific
8.1. Asia Pacific Red Phosphorus Market, by Country, 2016-2028(US$ Bn)
8.1.1. China
8.1.2. Japan
8.1.3. South Korea
8.1.4. India
8.1.5. Australia
8.1.6. New Zealand
8.1.7. Taiwan
8.1.8. Southeast Asia
8.1.9. Central Asia
8.1.10. Rest of Asia Pacific
8.2. Asia Pacific Red Phosphorus Market, by Type, 2016-2028(US$ Bn)
8.2.1. Overview
8.2.2. High Purity
8.2.3. Low Purity
8.3. Asia Pacific Red Phosphorus Market, by Application, 2016-2028(US$ Bn)
8.3.1. Overview
8.3.2. Textile
8.3.3. Plastic
8.3.4. Electricity & Electronics
8.3.5. Chemical
8.3.6. Agricultural
8.3.7. Metallurgical
8.3.8. Others

9. Latin America
9.1. Latin America Red Phosphorus Market, by Country, 2016-2028(US$ Bn)
9.1.1. Brazil
9.1.2. Argentina
9.1.3. Peru
9.1.4. Chile
9.1.5. Colombia
9.1.6. Rest of Latin America
9.2. Latin America Red Phosphorus Market, by Type, 2016-2028(US$ Bn)
9.2.1. Overview
9.2.2. High Purity
9.2.3. Low Purity
9.3. Latin America Red Phosphorus Market, by Application, 2016-2028(US$ Bn)
9.3.1. Overview
9.3.2. Textile
9.3.3. Plastic
9.3.4. Electricity & Electronics
9.3.5. Chemical
9.3.6. Agricultural
9.3.7. Metallurgical
9.3.8. Others

10. Middle East
10.1. Middle East Red Phosphorus Market, by Country, 2016-2028(US$ Bn)
10.1.1. UAE
10.1.2. KSA
10.1.3. Israel
10.1.4. Turkey
10.1.5. Iran
10.1.6. Rest of Middle East
10.2. Middle East Red Phosphorus Market, by Type, 2016-2028(US$ Bn)
10.2.1. Overview
10.2.2. High Purity
10.2.3. Low Purity
10.3. Middle East Red Phosphorus Market, by Application, 2016-2028(US$ Bn)
10.3.1. Overview
10.3.2. Textile
10.3.3. Plastic
10.3.4. Electricity & Electronics
10.3.5. Chemical
10.3.6. Agricultural
10.3.7. Metallurgical
10.3.8. Others

11. Africa
11.1. Africa Red Phosphorus Market, by Country, 2016-2028(US$ Bn)
11.1.1. South Africa
11.1.2. Egypt
11.1.3. Nigeria
11.1.4. Rest of Africa
11.2. Africa Red Phosphorus Market, by Type, 2016-2028(US$ Bn)
11.2.1. Overview
11.2.2. High Purity
11.2.3. Low Purity
11.3. Africa Red Phosphorus Market, by Application, 2016-2028(US$ Bn)
11.3.1. Overview
11.3.2. Textile
11.3.3. Plastic
11.3.4. Electricity & Electronics
11.3.5. Chemical
11.3.6. Agricultural
11.3.7. Metallurgical
11.3.8. Others

12. Global
12.1. Global Red Phosphorus Market, by Type, 2016-2028(US$ Bn)
12.1.1. Overview
12.1.2. High Purity
12.1.3. Low Purity
12.2. lobal Red Phosphorus Market, by Application, 2016-2028(US$ Bn)
12.2.1. Overview
12.2.2. Textile
12.2.3. Plastic
12.2.4. Electricity & Electronics
12.2.5. Chemical
12.2.6. Agricultural
12.2.7. Metallurgical
12.2.8. Others

13. Company Profiles
13.1. Akzo Nobel
13.2. Albemarle Corporation
13.3. BASF SE
13.4. Chemtura Corporation Limited
13.5. Clariant International Ltd.
13.6. Huber Engineered Materials
13.7. Israel Chemicals Limited (ICL)
13.8. Italmatch Chemicals
13.9. Lanxess AG
13.10. Nabaltech AG
13.11. Others

List of Figures

FIG. 1 Global Red Phosphorus Market: Research Methodology
FIG. 2 Market Size Estimation – Top Down & Bottom up Approach
FIG. 3 Global Red Phosphorus Market Segmentation
FIG. 4 Global Red Phosphorus Market, by Type, 2019 (US$ Bn)
FIG. 5 Global Red Phosphorus Market, by Application, 2021 (US$ Bn)
FIG. 6 Global Red Phosphorus Market, by Geography, 2021 (US$ Bn)
FIG. 7 Attractive Investment Proposition, by Geography, 2021
FIG. 8 Global Market Positioning of Key Red Phosphorus Market Manufacturers, 2019
FIG. 9 Global Red Phosphorus Market Value Contribution, By Type, 2021 & 2028 (Value %)
FIG. 10 Global Red Phosphorus Market, by High Purity, Value, 2016-2028 (US$ Bn)
FIG. 11 Global Red Phosphorus Market, by Low Purity, Value, 2016-2028 (US$ Bn)
FIG. 12 Global Red Phosphorus Market Value Contribution, By Application, 2021 & 2028 (Value %)
FIG. 13 Global Red Phosphorus Market, by Textile, Value, 2016-2028 (US$ Bn)
FIG. 14 Global Red Phosphorus Market, by Plastic, Value, 2016-2028 (US$ Bn)
FIG. 15 Global Red Phosphorus Market, by Electricity & Electronics, Value, 2016-2028 (US$ Bn)
FIG. 16 Global Red Phosphorus Market, by Chemical, Value, 2016-2028 (US$ Bn)
FIG. 17 Global Red Phosphorus Market, by Agricultural, Value, 2016-2028 (US$ Bn)
FIG. 18 Global Red Phosphorus Market, by Metallurgical, Value, 2016-2028 (US$ Bn)
FIG. 19 U.S. Red Phosphorus Market, 2016-2028 (US$ Bn)
FIG. 20 Rest of North America Red Phosphorus Market, 2016-2028 (US$ Bn)
FIG. 21 U.K. Red Phosphorus Market, 2016-2028 (US$ Bn)
FIG. 22 Germany Red Phosphorus Market, 2016-2028 (US$ Bn)
FIG. 23 France Red Phosphorus Market, 2016-2028 (US$ Bn)
FIG. 24 Italy Red Phosphorus Market, 2016-2028 (US$ Bn)
FIG. 25 Spain Red Phosphorus Market, 2016-2028 (US$ Bn)
FIG. 26 Russia Red Phosphorus Market, 2016-2028 (US$ Bn)
FIG. 27 BENELUX Red Phosphorus Market, 2016-2028 (US$ Bn)
FIG. 28 Poland Red Phosphorus Market, 2016-2028 (US$ Bn)
FIG. 29 Austria Red Phosphorus Market, 2016-2028 (US$ Bn)
FIG. 30 Rest of Europe Red Phosphorus Market, 2016-2028 (US$ Bn)
FIG. 31 Japan Red Phosphorus Market, 2016-2028 (US$ Bn)
FIG. 32 China Red Phosphorus Market, 2016-2028 (US$ Bn)
FIG. 33 India Red Phosphorus Market, 2016-2028 (US$ Bn)
FIG. 34 South Korea Red Phosphorus Market, 2016-2028 (US$ Bn)
FIG. 35 Australia Red Phosphorus Market, 2016-2028 (US$ Bn)
FIG. 36 Southeast Asia Red Phosphorus Market, 2016-2028 (US$ Bn)
FIG. 37 Rest of Asia Pacific Red Phosphorus Market, 2016-2028 (US$ Bn)
FIG. 38 Middle East & Africa Red Phosphorus Market, 2016-2028 (US$ Bn)
FIG. 39 South Africa Red Phosphorus Market, 2016-2028 (US$ Bn)
FIG. 40 Nigeria Red Phosphorus Market, 2016-2028 (US$ Bn)
FIG. 41 Egypt Red Phosphorus Market, 2016-2028 (US$ Bn)
FIG. 42 GCC Red Phosphorus Market, 2016-2028 (US$ Bn)
FIG. 43 Israel Red Phosphorus Market, 2016-2028 (US$ Bn)
FIG. 44 Latin America Red Phosphorus Market, 2016-2028 (US$ Bn)
FIG. 45 Mechanicalzil Red Phosphorus Market, 2016-2028 (US$ Bn)
FIG. 46 Argentina Red Phosphorus Market, 2016-2028 (US$ Bn)
FIG. 47 Colombia Red Phosphorus Market, 2016-2028 (US$ Bn)
FIG. 48 Peru Red Phosphorus Market, 2016-2028 (US$ Bn)
FIG. 49 Chile Red Phosphorus Market, 2016-2028 (US$ Bn)

List of Tables

TABLE 1 Market Snapshot: Global Beauty Devices (Red Phosphorus) Market
TABLE 2 Global Red Phosphorus Market, by Type, 2016-2028 (US$ Bn)
TABLE 3 Global Red Phosphorus Market, by Application, 2016-2028 (US$ Bn)
TABLE 4 Global Red Phosphorus Market, by Geography, 2016-2028 (US$ Bn)
TABLE 5 North America Red Phosphorus Market, by Type, 2016-2028 (US$ Bn)
TABLE 6 North America Red Phosphorus Market, by Application, 2016-2028 (US$ Bn)
TABLE 7 North America Red Phosphorus Market, by Country, 2016-2028 (US$ Bn)
TABLE 8 Europe Red Phosphorus Market, by Type, 2016-2028 (US$ Bn)
TABLE 9 Europe Red Phosphorus Market, by Application, 2016-2028 (US$ Bn)
TABLE 10 Europe Red Phosphorus Market, by Country/Region, 2016-2028 (US$ Bn)
TABLE 11 Asia Pacific Red Phosphorus Market, by Type, 2016-2028 (US$ Bn)
TABLE 12 Asia Pacific Red Phosphorus Market, by Application, 2016-2028 (US$ Bn)
TABLE 13 Asia Pacific Red Phosphorus Market, by Country/Region, 2016-2028 (US$ Bn)
TABLE 14 Latin America Red Phosphorus Market, by Type, 2016-2028 (US$ Bn)
TABLE 15 Latin America Red Phosphorus Market, by Application, 2016-2028 (US$ Bn)
TABLE 16 Latin America Red Phosphorus Market, by Country/Region, 2016-2028 (US$ Bn)
TABLE 17 Middle East Red Phosphorus Market, by Type, 2016-2028 (US$ Bn)
TABLE 18 Middle East Red Phosphorus Market, by Application, 2016-2028 (US$ Bn)
TABLE 19 Middle East Red Phosphorus Market, by Country/Region, 2016-2028 (US$ Bn)
TABLE 20 Africa Red Phosphorus Market, by Type, 2016-2028 (US$ Bn)
TABLE 21 Africa Red Phosphorus Market, by Application, 2016-2028 (US$ Bn)
TABLE 22 Africa Red Phosphorus Market, by Country/Region, 2016-2028 (US$ Bn)

Frequently Asked Questions

How COVID 19 Impacted Red Phosphorus Market?

Likewise other industries, COVID 19 also taken a toll on Red Phosphorus market with around 10.22% decline in its revenue in 2020 as compare to 2019

Which is the leading regional market for Red Phosphorus?

Europe is the largest regional market with highest share in the total volume of Red Phosphorus consumed in 2021

What is the major growth driving factors for global Red Phosphorus market?

Growing demand in fire retardant application and ever-growing demand for phosphorus-based fertilizers

Which is major segment in Red Phosphorus market by Type?

High purity segment dominated the Red Phosphorus market in 2021 with over 55% share

Which is major segment in Red Phosphorus market by application?

Agriculture segment was the largest application of Red Phosphorus in 2021 with over 25% share

South Africa Graphene Market

Published:
Report ID: 36617

Specialty Nitrile Butadiene Rubber Market

Published:
Report ID: 36614

Roofing Chemicals Market

Published:
Report ID: 36599

Radiation Curable Coatings Market

Published:
Report ID: 36596

1,4 Butanediol Market

Published:
Report ID: 36581

Palm Kernel Fatty Acids Market

Published:
Report ID: 36574

Crop Protection Chemicals Market

Published:
Report ID: 36441

Cosmetic Ingredients Market

Published:
Report ID: 3703

Hydrocolloids Market

Published:
Report ID: 36265

Ion Exchange Resins Market

Published:
Report ID: 36220

Herbal Extract Market

Published:
Report ID: 36211

Fiber Reinforced Polymer (FRP) Composites Market

Published:
Report ID: 36197

Purchase Options

$2999
Delivery Format: Excel.
$4999
Designed for the individual purchaser.
$6999
Users located at a single corporate site or regional office.
$7999
Allowed for unlimited sharing globally within one company.
Smallform of Sample request

Have a question?

User Profile

Don’t settle for less – trust Mitul to help you find the best solution.

Report delivery within 24 to 48 hours

– Other Info –

What people say?-

User Review

I am very impressed with the information in this report. The author clearly did their research when they came up with this product and it has already given me a lot of ideas.

Jana Schmidt
CEDAR CX Technologies

– Connect with us –

Phone

+91 6232 49 3207


support

24/7 Research Support


sales@credenceresearch.com

– Research Methodology –

Going beyond the basics: advanced techniques in research methodology

– Trusted By –

Pepshi, LG, Nestle
Motorola, Honeywell, Johnson and johnson
LG Chem, SIEMENS, Pfizer
Unilever, Samsonite, QIAGEN