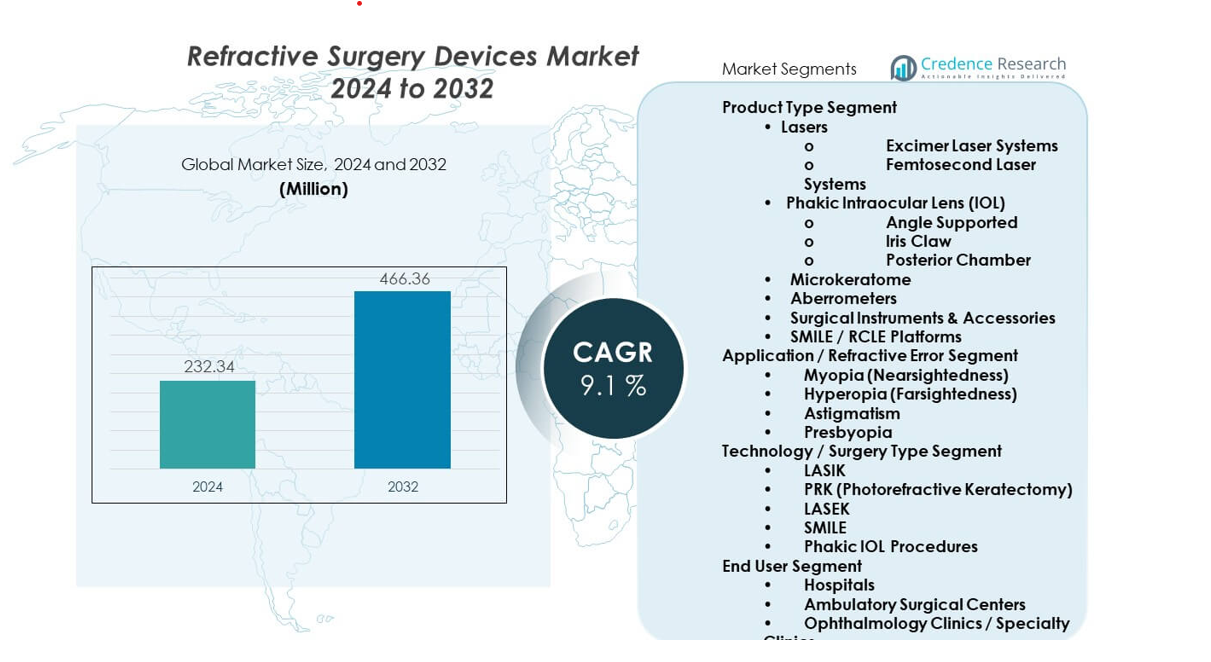
Home » Healthcare » Refractive Surgery Devices Market

Refractive Surgery Devices Market By Product (Lasers, Microkeratome, Aberrometers, Others) By Application (Myopia, Hyperopia, Astigmatism, Presbyopia, Dry Eyes)-Growth, Future Prospects & Competitive Analysis, 2016 – 2030

Price: $4999

Published: | Report ID: 18367 | Report Format : PDF

Key Highlights of the Report

The global refractive surgery devices market is segmented by product, application, end use, and region. Lasers refractive surgery devices are the most popular, while myopia is the leading category in application. The hospitals are the dominant category in end use, with North America leading the market growth.

The global refractive surgery devices market has several drivers, including rise in elder population and the increased screen time on smart devices of the global population due to the changing working conditions and COVID-19 pandemic. However, issues such as high prices, poor adoption rates, and restricted product reach are likely to impede the market growth.

Nonetheless, the global refractive surgery devices market offers significant growth opportunities, owing to the launch of technologically advanced minimally invasive surgeries, including LASIK and PRK is expected to accelerate the demand for refractive surgery devices during the forecast period.

Market Overview

The global refractive surgery devices market has witnessed steady growth in recent years and is expected to continue growing at a CAGR of 7.90% between 2023 and 2030. The market was valued at USD 171.5 million in 2022 and is expected to reach USD 292.02 million in 2030.

What Are The Main Drivers Of The Global Refractive Surgery Devices Market?

The global refractive surgery devices market is driven by several factors, including a rise in elder population and the increased screen time on smart devices of the global population due to the changing working conditions and COVID-19 pandemic.

What Are The Major Challenges Faced By The Global Refractive Surgery Devices Market?

The global refractive surgery devices market also faces several challenges, including high prices, poor adoption rates, and restricted product reach.

What Are The Growth Opportunities In The Global Refractive Surgery Devices Market?

The global refractive surgery devices market offers significant growth opportunities, including advent of technologically advanced minimally invasive surgeries, such as LASIK and PRK.

Design Element 2

Access crucial information at unmatched prices!

Request your free sample report today & start making informed decisions powered by Credence Research!

Download Free Sample
CTA Design Element 3

Executive Summary

Overview of the Global Refractive Surgery Devices Market

The market for medical devices used in the field of refractive surgery is known as the global market for refractive surgery devices. Astigmatism, farsightedness (hyperopia), nearsightedness (myopia), and presbyopia are only a few of the vision issues that can be treated surgically with refractive surgery.

Market Definition

Medical tools used in refractive surgery are used to treat astigmatism, farsightedness, and other types of vision impairments. These tools modify the cornea or lens of the eye to improve its capacity to enhance visual acuity. Advanced technology used in these tools include microkeratomes and lasers. Devices for refractive surgery provide patients with a personalised and exact method of vision correction, potentially reducing their need on glasses or contact lenses.

Market Insights

  • The global demand for refractive surgery devices was valued at USD 171.5 Million in 2022 and is expected to reach USD 292.02 Million in 2030, growing at a CAGR of 7.90% between 2023 and 2030.
  • Lasers is the leading segment by product in terms of value in 2022, while the Microkeratome and Aberrometers segments are likely to exhibit the fastest CAGR during the forecast period.
  • Myopia segment in application governs the demand for refractive surgery devices globally in 2022, and is expected to grow at a rapid CAGR.
  • Hospitals segment is expected to post the highest CAGR during the forecast period in end use and is anticipated to continue its dominance during the forecast period.
  • North America is fueling the growth of the refractive surgery devices industry with over one-third share in 2022, while Europe and Asia Pacific are collectively estimated to witness boost in forecast period.
  • The rise in geriatric population and the increased screen time of the global population are the major drivers of the market. At the same time, high prices, poor adoption rates, and restricted product reach are the main restraints.
  • Advent of technologically advanced minimally invasive surgeries, such as LASIK and PRK are the major opportunities in the market.

SegmenRefractive Surgery Devices Markettation by Product

  • Lasers are the leading segment by product and is projected to witness significant growth throughout the forecast period.
  • The Microkeratome segment will likely exhibit the fastest CAGR during the forecast period.
  • Aberrometers is another segment but contributes very little to the global refractive surgery devices market.

Segmentation by Application

  • The Myopia segment is the dominant in terms of demand for refractive surgery devices in the world, and is also expected to grow at a rapid CAGR.
  • The Hyperopia segment is anticipated to show growth owing to rising screen time of individuals across the globe.
  • Astigmatism and Presbyopia are also expected to propel the application segment over the forecast period.
  • Dry Eyes segment contributes the rest to the demand for refractive surgery devices. It is expected to boost the market owing to rising dry eyes cases due to the deficiency of vitamin d across the globe.

Segmentation by End Use

  • The Hospitals segment is expected to post the highest CAGR during the forecast period.
  • Ambulatory Surgery Centers is anticipated to show growth in CAGR over the forecast period.
  • Ophthalmology Clinics is anticipated to witness growth over the forecast period.

Segmentation by Region

  • North America is fueling the growth of the refractive surgery devices industry with over one-third share in 2022.
  • Europe and Asia Pacific collectively are anticipated to witness the growth over the forecast period.
  • The rest of the World, including Latin America, The Middle East, and Africa, contributes the remainder to the demand for refractive surgery devices.

The increasing demand for refractive surgery devices can be attributed to the rise in elder population and the increased screen time on smart devices of the global population due to the changing working conditions and COVID-19 pandemic. However, the market is restrained by high prices, poor adoption rates, and restricted product reach.

North America is the dominating region in the global market owing to the presence of established market players, favourable reimbursement regulations, and the high frequency of refractive defects, the regional market is predicted to increase. According to data from the WHO (World Health Organisation), the nation’s old population is anticipated to grow to 78 million by 2035, which will favourably impact product demand. Additionally, it is projected that the adoption of cutting-edge technology in the creation of surgical products will further accelerate market expansion in the region.

Asia Pacific is anticipated to grow with the fastest CAGR during the forecast period. The WHO predicts that high-income nations in the Asia Pacific would have a higher frequency of myopia. Recent changes in lifestyle and environmental factors, such as an ageing population, air pollution, and increased use of phones and laptops, are driving the need for refractive surgical equipment. A number of Western businesses have benefited from Asia’s growing need for ophthalmic technologies. Some businesses with a presence in Asia include Ellex, Carl Zeiss Meditec, and STAAR Surgical with plans to continue growing across the continent.

Therefore, the increasing demand for refractive surgery devices can be attributed to the rise in elder population and the increased screen time on smart devices of the global population due to the changing working conditions.

While the refractive surgery devices market is growing, it faces challenges from high prices, poor adoption rates, and restricted product reach, as advent of technologically advanced minimally invasive surgeries, including LASIK and PRK are expected to sustain demand. Manufacturers are innovating and forming partnerships to stay competitive.

Rise in Geriatric Population and the Increased Screen Time of the Global Population

Myopia has been a significant problem throughout the epidemic, especially among children due to increasing screen time, claims JAMA Ophthalmology. 52 percent of the world’s population is predicted to have myopia by 2050, according to the World Health Organisation, which indicates that the condition is on the rise. Additionally, refractive errors are more likely to occur in the elderly population. The National Institute on Ageing (NIA) projects that by 2030, there will be 72 million people who are elderly.

Rising Rate of Refractive Errors and Other Eye Conditions

The market base is expected to expand because to the rising prevalence of refractive errors and other eye disorders like hyperopia, myopia, presbyopia, astigmatism, and dry eyes. By eliminating the need for spectacles, refractive surgery increases an individual’s level of independence. Refractive surgery facilitates vision correction and the management of numerous eye conditions that could otherwise result in blindness. According to the WHO, untreated refractive errors affect 88.4 million individuals globally, and they are the primary cause of blindness and vision impairment. This is anticipated to increase demand for refractive procedures.

High Prices

Refractive surgical device creation and improvement require significant research and development efforts. This entails carrying out clinical trials, investing in cutting-edge technology, and making sure that all legal requirements are met. The price of the gadgets frequently reflects the expenses related to these activities.

To ensure the safety and effectiveness of refractive surgery equipment, high precision manufacturing techniques are needed. Femtosecond lasers and excimer lasers are manufactured using sophisticated components, advanced electronics, and intricate optical systems. The entire cost is increased by the complex manufacturing process and the usage of premium materials.

Poor Adoption Rates

Refractive surgery device adoption rates that are low can be attributed to a number of things, including inadequate education and awareness. Low adoption rates may be caused by patients’ and healthcare providers’ lack of knowledge about the advantages of refractive surgical equipment. The surgical options and technical developments in refractive surgery may not be known to patients. Similarly, medical practitioners might not be up to date on the newest gadgets and their possible advantages. Additionally, some people might be reluctant to have refractive surgery because of possible side effects and perceived risks. People may decide against having these operations if they have worries about the discomfort, risks, or long-term repercussions on their vision. In order to improve, it is crucial to give correct information and respond to patients’ concerns.

Advent of Technologically Advanced Minimally Invasive Surgeries

The demand for refractive surgical equipment is anticipated to increase during the projected period due to the introduction of technologically sophisticated minimally invasive procedures like LASIK and PRK. Better patient results from the aforementioned surgeries include an enhanced safety profile, quicker recovery times, varied government programmes, and increased acceptance of refractive surgery. As more sophisticated surgical techniques have been developed over time, ophthalmic surgical procedures have undergone substantial alterations. The da Vinci system, the current gold standard for robotic surgery in the field of ophthalmology, is incredibly precise and error-free.

Recent Changes in Environmental and Lifestyle Variables

Recent changes in environmental and lifestyle factors, such as an ageing population, air pollution, and increased use of phones and computers, are driving the need for refractive surgical equipment. A number of Western businesses have benefited from Asia’s growing need for ophthalmic technologies. Some businesses that have a presence in various parts of Asia and intend to keep growing there include Ellex and Carl Zeiss Meditec. In addition, a top hospital chain for eye treatment said in December 2019 that it would open 60 new eye facilities in South Asian countries like India during the following two to three years.

Advances in Wave-Front Aberrometer Devices

The development of wave-front aberrometer technology is anticipated to be one of the major drivers of market expansion. About 8 million Americans were diagnosed with refractive error-related vision impairment in 2017, according to the Centres for Disease Control and Prevention (CDC). Thus, it is anticipated that the segment would rise throughout the forecast period due to increasing aberrometer adoption and a growing patient base.

Competitive Landscape

Key Players

The global refractive surgery devices market is highly competitive, with the presence of several key players. Some of the major players in the market and their market share are as follows:

  • Johnson & Johnson Services, Inc.
  • Carl Zeiss Meditec AG
  • Alcon
  • Bausch & Lomb Incorporated
  • Quantel Medical
  • TOPCON CORPORATION
  • Essilor
  • NIDEK CO., LTD.
  • SCHWIND eye-tech-solutions
  • Others

These companies focus on product innovation, expanding their end uses, and mergers and acquisitions to stay ahead in the market. The major players in the global refractive surgery devices market are constantly striving to stay ahead by introducing new products and innovations.

In April 2021, Johnson & Johnson Vision introduced ACUVUE Abiliti in as a new brand for upcoming services and goods to assist parents and eye care professionals in managing the growing prevalence and concern of myopia in youngsters.

In June 2021, The Therapeutic Goods Administration (TGA) of Australia granted regulatory approval to Glaukos Corporation for PRESERFLO MicroShunt. The PRESERFLO MicroShunt was designed to lower intraocular pressure (IOP) in individuals with primary open-angle glaucoma where IOP would continue to be unmanageable despite being the most tolerable medication treatment and/or when glaucoma progression required surgery.

In June 2021, a contract was inked by Bausch & Lomb Inc. and Lochan, a provider of information technology services. These businesses sought to create the next iteration of the clinical decision support software eyeTELLIGENCE from Bausch & Lomb Incorporated. This programme would be created to enable surgeons to easily combine all aspects of the cataract, retinal, and refractive surgical operations in order to increase the efficiency of their overall practise. It would do this by utilising the existing cloud-based infrastructure of eyeTELLIGENCE.

Summary of Key Findings

  • Rise in geriatric population and the increased screen time of the global population are driving market growth
  • Market segmented by product, application, end use, and region.
  • Lazers product refractive surgery devices are the most popular.
  • Myopia in application is the dominant category
  • Hospitals are leading category in end use segment.
  • North America is leading market growth; the market is highly competitive with key players including Johnson & Johnson Services, Inc., Bausch & Lomb Incorporated, and NIDEK CO., LTD.

Shape Your Report to Specific Countries or Regions & Enjoy 30% Off!

Future Outlook

  • Positive outlook for the global refractive surgery devices market with significant growth potential in the North America region
  • Rise in geriatric population and the increased screen time of the global population to drive growth
  • Challenges include high prices and poor adoption rates of refractive surgery devices
  • Key players to focus on product innovation, expanding market reach and maintaining competitive pricing to stay ahead in the market.

Segmentation

  • By Product
    • Lasers
    • Microkeratome
    • Aberrometers
    • Others
  • By Application
    • Myopia
    • Hyperopia
    • Astigmatism
    • Presbyopia
    • Dry Eyes
  • By End Use
    • Hospitals
    • Ambulatory Surgery Centers
    • Ophthalmology Clinics
  • By Region
  • North America
    • U.S
    • Canada
    • Mexico
  • Europe
    • Germany
    • France
    • U.K.
    • Italy
    • Spain
    • Rest of Europe
  • Asia Pacific
    • China
    • Japan
    • India
    • South Korea
    • South-east Asia
    • Rest of Asia Pacific
  • Latin America
    • Brazil
    • Argentina
    • Rest of Latin America
  • Middle East & Africa
    • GCC Countries
    • South Africa
    • Rest of Middle East and Africa

1. Preface
1.1. Report Description
1.1.1. Purpose of the Report
1.1.2. Target Audience
1.1.3. USP and Key Offerings
1.2. Research Scope
1.3. Research Methodology
1.3.1. Phase I – Secondary Research
1.3.2. Phase II – Data Modelling
1.3.2.1. Company Share Analysis Model
1.3.2.2. Revenue Based Modelling
1.3.3. Phase III – Primary Research
1.3.4. Research Limitations
1.3.5. Assumptions
1.4. Market Introduction
1.5. Market Research Scope

2. Executive Summary
2.1. Market Snapshot: Global Refractive Surgery Devices Market
2.2. Global Refractive Surgery Devices Market, By Application
2.3. Global Refractive Surgery Devices Market, By Product
2.4. Global Refractive Surgery Devices Market, By End-use
2.5. Global Refractive Surgery Devices Market, By Region

3. Market Dynamics & Factors Analysis
3.1. Introduction
3.1.1. Global Refractive Surgery Devices Market Value, 2017-2030, (US$ Mn)
3.1.2. Y-o-Y Growth Trend Analysis
3.2. Market Dynamics
3.2.1. Market Drivers
3.2.1.1. Driver 1
3.2.1.2. Driver 2
3.2.1.3. Driver 3
3.2.2. Market Restraints
3.2.2.1. Restraint 1
3.2.2.2. Restraint 2
3.2.3. Market Opportunities
3.2.3.1. Opportunity 1
3.2.3.2. Opportunity 2
3.2.4. Major Industry Challenges
3.2.4.1. Challenge 1
3.2.4.2. Challenge 2
3.3. Growth and Development Patterns
3.4. Investment Feasibility Analysis
3.5. Market Opportunity Analysis
3.5.1. Application
3.5.2. Product
3.5.3. End-use
3.5.4. Geography

4. Premium Insights
4.1. STAR (Situation, Task, Action, Results) Analysis
4.2. Porter’s Five Forces Analysis
4.2.1. Threat of New Entrants
4.2.2. Bargaining Power of Buyers/Consumers
4.2.3. Bargaining Power of Suppliers
4.2.4. Threat of Substitute Types
4.2.5. Intensity of Competitive Rivalry
4.3. Key Market Trends
4.3.1. Demand Side Trends
4.3.2. Supply Side Trends
4.4. Value Chain Analysis
4.5. Technology Analysis
4.6. Analysis and Recommendations
4.7. Marketing Strategy Analysis
4.7.1. Direct Marketing
4.7.2. Indirect Marketing
4.7.3. Marketing Channel Development Trend

5. Market Positioning of Key Players, 2022
5.1. Company market share of key players, 2022
5.2. Competitive Benchmarking
5.3. Market Positioning of Key Vendors
5.4. Geographical Presence Analysis
5.5. Major Strategies Adopted by Key Players
5.5.1. Key Strategies Analysis
5.5.2. Mergers and Acquisitions
5.5.3. Partnerships
5.5.4. Product Launch
5.5.5. Geographical Expansion
5.5.6. Dry Eyes

6. Economic Impact Analysis
6.1. Recession Impact
6.1.1. North America
6.1.2. Europe
6.1.3. Asia Pacific
6.1.4. Latin America
6.1.5. Middle East and Africa
6.2. Ukraine-Russia War Impact
6.2.1. North America
6.2.2. Europe
6.2.3. Asia Pacific
6.2.4. Latin America
6.2.5. Middle East and Africa
6.3. COVID-19 Impact Analysis
6.3.1. North America
6.3.2. Europe
6.3.3. Asia Pacific
6.3.4. Latin America
6.3.5. Middle East and Africa

7. Global Refractive Surgery Devices Market, By Application
7.1. Global Refractive Surgery Devices Market Overview, by Application
7.1.1. Global Refractive Surgery Devices Market Revenue Share, By Application, 2022 Vs 2030 (in %)
7.2. Myopia
7.2.1. Global Refractive Surgery Devices Market, By Region, 2017-2030 (US$ Mn)
7.3. Hyperopia
7.3.1. Global Refractive Surgery Devices Market, By Region, 2017-2030 (US$ Mn)
7.4. Astigmatism
7.4.1. Global Refractive Surgery Devices Market, By Region, 2017-2030 (US$ Mn)
7.5. Presbyopia
7.5.1. Global Refractive Surgery Devices Market, By Region, 2017-2030 (US$ Mn)
7.6. Dry Eyes
7.6.1. Global Refractive Surgery Devices Market, By Region, 2017-2030 (US$ Mn)

8. Global Refractive Surgery Devices Market, by Product, 2017-2030 (US$ Mn)
8.1. Global Refractive Surgery Devices Market Overview, by Product
8.1.1. Global Refractive Surgery Devices Market, By Product, 2022 vs 2030 (in%)
8.2. Lasers
8.2.1. Global Refractive Surgery Devices Market, By Region, 2017-2030 (US$ Mn)
8.3. Microkeratome
8.3.1. Global Refractive Surgery Devices Market, By Region, 2017-2030 (US$ Mn)
8.4. Aberrometers
8.4.1. Global Refractive Surgery Devices Market, By Region, 2017-2030 (US$ Mn)
8.5. Others
8.5.1. Global Refractive Surgery Devices Market, By Region, 2017-2030 (US$ Mn)

9. Global Refractive Surgery Devices Market, By End-use
9.1. Global Refractive Surgery Devices Market Overview, by End-use
9.1.1. Global Refractive Surgery Devices Market, By End-use, 2022 vs 2030 (in %)
9.2. Hospital
9.2.1. Global Refractive Surgery Devices Market, By Region, 2017-2030 (US$ Mn)
9.3. Ambulatory Surgery Centers
9.3.1. Global Refractive Surgery Devices Market, By Region, 2017-2030 (US$ Mn)
9.4. Ophthalmology Clinics
9.4.1. Global Refractive Surgery Devices Market, By Region, 2017-2030 (US$ Mn)

10. Global Refractive Surgery Devices Market, By Region
10.1. Global Refractive Surgery Devices Market Overview, by Region
10.1.1. Global Refractive Surgery Devices Market, By Region, 2022 vs 2030 (in%)
10.2. Application
10.2.1. Global Refractive Surgery Devices Market, By Application, 2017-2030 (US$ Mn)
10.3. Product
10.3.1. Global Refractive Surgery Devices Market, By Product, 2017-2030 (US$ Mn)
10.4. End-use
10.4.1. Global Refractive Surgery Devices Market, By End-use, 2017-2030 (US$ Mn)

11. North America Refractive Surgery Devices Market Analysis
11.1. North America Refractive Surgery Devices Market, by Application, 2017-2030(US$ Mn)
11.1.1. Overview
11.1.2. SRC Analysis
11.2. North America Refractive Surgery Devices Market, by Product, 2017-2030(US$ Mn)
11.2.1. Overview
11.2.2. SRC Analysis
11.3. North America Refractive Surgery Devices Market, by End-use, 2017-2030(US$ Mn)
11.3.1. Overview
11.3.2. SRC Analysis
11.4. North America Refractive Surgery Devices Market, by Country, 2017-2030 (US$ Mn)
11.4.1. North America Refractive Surgery Devices Market, by Country, 2022 Vs 2030 (in%)
11.4.2. U.S.
11.4.2.1. U.S. Refractive Surgery Devices Market Estimates and Forecast, 2017-2030 (US$ Mn)
11.4.2.2. U.S. Refractive Surgery Devices, By Application, 2017-2030 (US$ Mn)
11.4.2.3. U.S. Refractive Surgery Devices, By Product, 2017-2030 (US$ Mn)
11.4.2.4. U.S. Refractive Surgery Devices, By End-use, 2017-2030 (US$ Mn)
11.4.3. Canada
11.4.3.1. Canada Refractive Surgery Devices Market Estimates and Forecast, 2017-2030 (US$ Mn)
11.4.3.2. Canada Refractive Surgery Devices, By Application, 2017-2030 (US$ Mn)
11.4.3.3. Canada Refractive Surgery Devices, By Product, 2017-2030 (US$ Mn)
11.4.3.4. Canada Refractive Surgery Devices, By End-use, 2017-2030 (US$ Mn)
11.4.4. Mexico
11.4.4.1. Mexico Refractive Surgery Devices Market Estimates and Forecast, 2017-2030 (US$ Mn)
11.4.4.2. Mexico Refractive Surgery Devices, By Application, 2017-2030 (US$ Mn)
11.4.4.3. Mexico Refractive Surgery Devices, By Product, 2017-2030 (US$ Mn)
11.4.4.4. Mexico Refractive Surgery Devices, By End-use, 2017-2030 (US$ Mn)

12. Europe Refractive Surgery Devices Market Analysis
12.1. Europe Refractive Surgery Devices Market, by Application, 2017-2030(US$ Mn)
12.1.1. Overview
12.1.2. SRC Analysis
12.2. Europe Refractive Surgery Devices Market, by Product, 2017-2030(US$ Mn)
12.2.1. Overview
12.2.2. SRC Analysis
12.3. Europe Refractive Surgery Devices Market, by End-use, 2017-2030(US$ Mn)
12.3.1. Overview
12.3.2. SRC Analysis
12.4. Europe Refractive Surgery Devices Market, by region, 2017-2030 (US$ Mn)
12.4.1. Europe Refractive Surgery Devices Market, by Country, 2022 Vs 2030 (in%)
12.4.2. Germany
12.4.2.1. Germany Refractive Surgery Devices Market Estimates and Forecast, 2017-2030 (US$ Mn)
12.4.2.2. Germany Refractive Surgery Devices, By Application, 2017-2030 (US$ Mn)
12.4.2.3. Germany Refractive Surgery Devices, By Product, 2017-2030 (US$ Mn)
12.4.2.4. Germany Refractive Surgery Devices, By End-use, 2017-2030 (US$ Mn)
12.4.3. France
12.4.3.1. France Refractive Surgery Devices Market Estimates and Forecast, 2017-2030 (US$ Mn)
12.4.3.2. France Refractive Surgery Devices, By Application, 2017-2030 (US$ Mn)
12.4.3.3. France Refractive Surgery Devices, By Product, 2017-2030 (US$ Mn)
12.4.3.4. France Refractive Surgery Devices, By End-use, 2017-2030 (US$ Mn)
12.4.4. UK
12.4.4.1. UK Refractive Surgery Devices Market Estimates and Forecast, 2017-2030 (US$ Mn)
12.4.4.2. UK Refractive Surgery Devices, By Application, 2017-2030 (US$ Mn)
12.4.4.3. UK Refractive Surgery Devices, By Product, 2017-2030 (US$ Mn)
12.4.4.4. UK Refractive Surgery Devices, By End-use, 2017-2030 (US$ Mn)
12.4.5. Italy
12.4.5.1. Italy Refractive Surgery Devices Market Estimates and Forecast, 2017-2030 (US$ Mn)
12.4.5.2. Italy Refractive Surgery Devices, By Application, 2017-2030 (US$ Mn)
12.4.5.3. Italy Refractive Surgery Devices, By Product, 2017-2030 (US$ Mn)
12.4.5.4. Italy Refractive Surgery Devices, By End-use, 2017-2030 (US$ Mn)
12.4.6. Spain
12.4.6.1. Spain Refractive Surgery Devices Market Estimates and Forecast, 2017-2030 (US$ Mn)
12.4.6.2. Spain Refractive Surgery Devices, By Application, 2017-2030 (US$ Mn)
12.4.6.3. Spain Refractive Surgery Devices, By Product, 2017-2030 (US$ Mn)
12.4.6.4. Spain Refractive Surgery Devices, By End-use, 2017-2030 (US$ Mn)
12.4.7. Rest of Europe
12.4.7.1. Rest of Europe Refractive Surgery Devices Market Estimates and Forecast, 2017-2030 (US$ Mn)
12.4.7.2. Rest of Europe Refractive Surgery Devices, By Application, 2017-2030 (US$ Mn)
12.4.7.3. Rest of Europe Refractive Surgery Devices, By Product, 2017-2030 (US$ Mn)
12.4.7.4. Rest of Europe Refractive Surgery Devices, By End-use, 2017-2030 (US$ Mn)

13. Asia Pacific Refractive Surgery Devices Market Analysis
13.1. Asia Pacific Refractive Surgery Devices Market, by Application, 2017-2030(US$ Mn)
13.1.1. Overview
13.1.2. SRC Analysis
13.2. Asia Pacific Refractive Surgery Devices Market, by Product, 2017-2030(US$ Mn)
13.2.1. Overview
13.2.2. SRC Analysis
13.3. Asia Pacific Refractive Surgery Devices Market, by End-use, 2017-2030(US$ Mn)
13.3.1. Overview
13.3.2. SRC Analysis
13.4. Asia Pacific Refractive Surgery Devices Market, by Country, 2017-2030 (US$ Mn)
13.4.1. Asia Pacific Refractive Surgery Devices Market, by Country, 2022 Vs 2030 (in%)
13.4.2. China
13.4.2.1. China Refractive Surgery Devices Market Estimates and Forecast, 2017-2030 (US$ Mn)
13.4.2.2. China Refractive Surgery Devices, By Application, 2017-2030 (US$ Mn)
13.4.2.3. China Refractive Surgery Devices, By Product, 2017-2030 (US$ Mn)
13.4.2.4. China Refractive Surgery Devices, By End-use, 2017-2030 (US$ Mn)
13.4.3. Japan
13.4.3.1. Japan Refractive Surgery Devices Market Estimates and Forecast, 2017-2030 (US$ Mn)
13.4.3.2. Japan Refractive Surgery Devices, By Application, 2017-2030 (US$ Mn)
13.4.3.3. Japan Refractive Surgery Devices, By Product, 2017-2030 (US$ Mn)
13.4.3.4. Japan Refractive Surgery Devices, By End-use, 2017-2030 (US$ Mn)
13.4.4. India
13.4.4.1. India Refractive Surgery Devices Market Estimates and Forecast, 2017-2030 (US$ Mn)
13.4.4.2. India Refractive Surgery Devices, By Application, 2017-2030 (US$ Mn)
13.4.4.3. India Refractive Surgery Devices, By Product, 2017-2030 (US$ Mn)
13.4.4.4. India Refractive Surgery Devices, By End-use, 2017-2030 (US$ Mn)
13.4.5. South Korea
13.4.5.1. South Korea Refractive Surgery Devices Market Estimates and Forecast, 2017-2030 (US$ Mn)
13.4.5.2. South Korea Refractive Surgery Devices, By Application, 2017-2030 (US$ Mn)
13.4.5.3. South Korea Refractive Surgery Devices, By Product, 2017-2030 (US$ Mn)
13.4.5.4. South Korea Refractive Surgery Devices, By End-use, 2017-2030 (US$ Mn)
13.4.6. South-East Asia
13.4.6.1. South-East Asia Refractive Surgery Devices Market Estimates and Forecast, 2017-2030 (US$ Mn)
13.4.6.2. South-East Asia Refractive Surgery Devices, By Application, 2017-2030 (US$ Mn)
13.4.6.3. South-East Asia Refractive Surgery Devices, By Product, 2017-2030 (US$ Mn)
13.4.6.4. South-East Asia Refractive Surgery Devices, By End-use, 2017-2030 (US$ Mn)
13.4.7. Rest of Asia Pacific
13.4.7.1. Rest of Asia Pacific Refractive Surgery Devices Market Estimates and Forecast, 2017-2030 (US$ Mn)
13.4.7.2. Rest of Asia Pacific Refractive Surgery Devices, By Application, 2017-2030 (US$ Mn)
13.4.7.3. Rest of Asia Pacific Refractive Surgery Devices, By Product, 2017-2030 (US$ Mn)
13.4.7.4. Rest of Asia Pacific Refractive Surgery Devices, By End-use, 2017-2030 (US$ Mn)

14. Latin America Refractive Surgery Devices Market Analysis
14.1. Latin America Refractive Surgery Devices Market, by Application, 2017-2030(US$ Mn)
14.1.1. Overview
14.1.2. SRC Analysis
14.2. Latin America Refractive Surgery Devices Market, by Product, 2017-2030(US$ Mn)
14.2.1. Overview
14.2.2. SRC Analysis
14.3. Latin America Refractive Surgery Devices Market, by End-use, 2017-2030(US$ Mn)
14.3.1. Overview
14.3.2. SRC Analysis
14.4. Latin America Refractive Surgery Devices Market, by Country, 2017-2030 (US$ Mn)
14.4.1. Latin America Refractive Surgery Devices Market, by Country, 2022 Vs 2030 (in%)
14.4.2. Brazil
14.4.2.1. Brazil Refractive Surgery Devices Market Estimates and Forecast, 2017-2030 (US$ Mn)
14.4.2.2. Brazil Refractive Surgery Devices, By Application, 2017-2030 (US$ Mn)
14.4.2.3. Brazil Refractive Surgery Devices, By Product, 2017-2030 (US$ Mn)
14.4.2.4. Brazil Refractive Surgery Devices, By End-use, 2017-2030 (US$ Mn)
14.4.3. Argentina
14.4.3.1. Argentina Refractive Surgery Devices Market Estimates and Forecast, 2017-2030 (US$ Mn)
14.4.3.2. Argentina Refractive Surgery Devices, By Application, 2017-2030 (US$ Mn)
14.4.3.3. Argentina Refractive Surgery Devices, By Product, 2017-2030 (US$ Mn)
14.4.3.4. Argentina Refractive Surgery Devices, By End-use, 2017-2030 (US$ Mn)
14.4.4. Rest of Latin America
14.4.4.1. Rest of Latin America Refractive Surgery Devices Market Estimates and Forecast, 2017-2030 (US$ Mn)
14.4.4.2. Rest of Latin America Refractive Surgery Devices, By Application, 2017-2030 (US$ Mn)
14.4.4.3. Rest of Latin America Refractive Surgery Devices, By Product, 2017-2030 (US$ Mn)
14.4.4.4. Rest of Latin America Refractive Surgery Devices, By End-use, 2017-2030 (US$ Mn)

15. Middle East and Africa Refractive Surgery Devices Market Analysis
15.1. Middle East and Africa Refractive Surgery Devices Market, by Application, 2017-2030(US$ Mn)
15.1.1. Overview
15.1.2. SRC Analysis
15.2. Middle East and Africa Refractive Surgery Devices Market, by Product, 2017-2030(US$ Mn)
15.2.1. Overview
15.2.2. SRC Analysis
15.3. Middle East and Africa Refractive Surgery Devices Market, by End-use, 2017-2030(US$ Mn)
15.3.1. Overview
15.3.2. SRC Analysis
15.4. Middle East and Africa Refractive Surgery Devices Market, by Country, 2017-2030 (US$ Mn)
15.4.1. Middle East and Africa Refractive Surgery Devices Market, by Country, 2022 Vs 2030 (in%)
15.4.2. GCC Countries
15.4.2.1. GCC Countries Refractive Surgery Devices Market Estimates and Forecast, 2017-2030 (US$ Mn)
15.4.2.2. GCC Countries Refractive Surgery Devices, By Application, 2017-2030 (US$ Mn)
15.4.2.3. GCC Countries Refractive Surgery Devices, By Product, 2017-2030 (US$ Mn)
15.4.2.4. GCC Countries Refractive Surgery Devices, By End-use, 2017-2030 (US$ Mn)
15.4.3. South Africa
15.4.3.1. South Africa Refractive Surgery Devices Market Estimates and Forecast, 2017-2030 (US$ Mn)
15.4.3.2. South Africa Refractive Surgery Devices, By Application, 2017-2030 (US$ Mn)
15.4.3.3. South Africa Refractive Surgery Devices, By Product, 2017-2030 (US$ Mn)
15.4.3.4. South Africa Refractive Surgery Devices, By End-use, 2017-2030 (US$ Mn)
15.4.4. Rest of Middle East and Africa
15.4.4.1. Rest of Middle East and Africa Refractive Surgery Devices Market Estimates and Forecast, 2017-2030 (US$ Mn)
15.4.4.2. Rest of Middle East and Africa Refractive Surgery Devices, By Application, 2017-2030 (US$ Mn)
15.4.4.3. Rest of Middle East and Africa Refractive Surgery Devices, By Product, 2017-2030 (US$ Mn)
15.4.4.4. Rest of Middle East and Africa Refractive Surgery Devices, By End-use, 2017-2030 (US$ Mn)

16. Company Profiles
16.1. Johnson & Johnson Services, Inc.
16.1.1. Company Overview
16.1.2. Deployments/Services Portfolio
16.1.3. Geographical Presence
16.1.4. Financial Summary
16.1.4.1. Market Revenue and Net Profit (2019-2022)
16.1.4.2. Business Segment Revenue Analysis
16.1.4.3. Geographical Revenue Analysis
16.2. Carl Zeiss Meditec AG
16.3. Alcon
16.4. Bausch & Lomb Incorporated
16.5. Quantel Medical
16.6. TOPCON CORPORATION
16.7. Essilor
16.8. NIDEK CO., LTD.
16.9. SCHWIND eye-tech-solutions

List of Figures
FIG. 1 Global Refractive Surgery Devices Market: Research Methodology
FIG. 2 Market Size Estimation – Top Down & Bottom up Approach
FIG. 3 Global Refractive Surgery Devices Market Segmentation
FIG. 4 Global Refractive Surgery Devices Market, by Application, 2022 (US$ Mn)
FIG. 5 Global Refractive Surgery Devices Market, by Product, 2022 (US$ Mn)
FIG. 6 Global Refractive Surgery Devices Market, by End-use, 2022 (US$ Mn)
FIG. 7 Global Refractive Surgery Devices Market, by Geography, 2022 (US$ Mn)
FIG. 8 Attractive Investment Proposition, by Application, 2022
FIG. 9 Attractive Investment Proposition, by Product, 2022
FIG. 10 Attractive Investment Proposition, by End-use, 2022
FIG. 11 Attractive Investment Proposition, by Geography, 2022
FIG. 12 Global Market Share Analysis of Key Refractive Surgery Devices Market Manufacturers, 2022
FIG. 13 Global Market Positioning of Key Refractive Surgery Devices Market Manufacturers, 2022
FIG. 14 Global Refractive Surgery Devices Market Value Contribution, By Application, 2022 & 2030 (Value %)
FIG. 15 Global Refractive Surgery Devices Market, by Myopia, Value, 2017-2030 (US$ Mn)
FIG. 16 Global Refractive Surgery Devices Market, by Hyperopia, Value, 2017-2030 (US$ Mn)
FIG. 17 Global Refractive Surgery Devices Market, by Astigmatism, Value, 2017-2030 (US$ Mn)
FIG. 18 Global Refractive Surgery Devices Market, by Presbyopia, Value, 2017-2030 (US$ Mn)
FIG. 19 Global Refractive Surgery Devices Market, by Dry Eyes, Value, 2017-2030 (US$ Mn)
FIG. 20 Global Refractive Surgery Devices Market Value Contribution, By Product, 2022 & 2030 (Value %)
FIG. 21 Global Refractive Surgery Devices Market, by Lasers, Value, 2017-2030 (US$ Mn)
FIG. 22 Global Refractive Surgery Devices Market, by Microkeratome, 2017-2030 (US$ Mn)
FIG. 23 Global Refractive Surgery Devices Market, by Aberrometers, Value, 2017-2030 (US$ Mn)
FIG. 24 Global Refractive Surgery Devices Market, by Others, Value, 2017-2030 (US$ Mn)
FIG. 25 Global Refractive Surgery Devices Market Value Contribution, By End-use, 2022 & 2030 (Value %)
FIG. 26 Global Refractive Surgery Devices Market, by Hospital, Value, 2017-2030 (US$ Mn)
FIG. 27 Global Refractive Surgery Devices Market, by Ambulatory Surgery Centers, Value, 2017-2030 (US$ Mn)
FIG. 28 Global Refractive Surgery Devices Market, by Ophthalmology Clinics, Value, 2017-2030 (US$ Mn)
FIG. 29 Global Refractive Surgery Devices Market, by Industrial, Value, 2017-2030 (US$ Mn)
FIG. 30 North America Refractive Surgery Devices Market, 2017-2030 (US$ Mn)
FIG. 31 U.S. Refractive Surgery Devices Market, 2017-2030 (US$ Mn)
FIG. 32 Canada Refractive Surgery Devices Market, 2017-2030 (US$ Mn)
FIG. 33 Europe Refractive Surgery Devices Market, 2017-2030 (US$ Mn)
FIG. 34 Germany Refractive Surgery Devices Market, 2017-2030 (US$ Mn)
FIG. 35 France Refractive Surgery Devices Market, 2017-2030 (US$ Mn)
FIG. 36 U.K. Refractive Surgery Devices Market, 2017-2030 (US$ Mn)
FIG. 37 Italy Refractive Surgery Devices Market, 2017-2030 (US$ Mn)
FIG. 38 Spain Refractive Surgery Devices Market, 2017-2030 (US$ Mn)
FIG. 39 Rest of Europe Refractive Surgery Devices Market, 2017-2030 (US$ Mn)
FIG. 40 Asia Pacific Refractive Surgery Devices Market, 2017-2030 (US$ Mn)
FIG. 41 China Refractive Surgery Devices Market, 2017-2030 (US$ Mn)
FIG. 42 Japan Refractive Surgery Devices Market, 2017-2030 (US$ Mn)
FIG. 43 India Refractive Surgery Devices Market, 2017-2030 (US$ Mn)
FIG. 44 South Korea Refractive Surgery Devices Market, 2017-2030 (US$ Mn)
FIG. 45 South-East Asia Refractive Surgery Devices Market, 2017-2030 (US$ Mn)
FIG. 46 Rest of Asia Pacific Refractive Surgery Devices Market, 2017-2030 (US$ Mn)
FIG. 47 Latin America Refractive Surgery Devices Market, 2017-2030 (US$ Mn)
FIG. 48 Brazil Refractive Surgery Devices Market, 2017-2030 (US$ Mn)
FIG. 49 Mexico Refractive Surgery Devices Market, 2017-2030 (US$ Mn)
FIG. 50 Rest of Latin America Refractive Surgery Devices Market, 2017-2030 (US$ Mn)
FIG. 51 Middle East & Africa Refractive Surgery Devices Market, 2017-2030 (US$ Mn)
FIG. 52 GCC Countries Refractive Surgery Devices Market, 2017-2030 (US$ Mn)
FIG. 53 South Africa Refractive Surgery Devices Market, 2017-2030 (US$ Mn)
FIG. 54 Rest of Middle East and Africa Refractive Surgery Devices Market, 2017-2030 (US$ Mn)

List of Tables
TABLE 1 Market Snapshot: Global Refractive Surgery Devices Market
TABLE 2 Global Refractive Surgery Devices Market: Market Drivers Impact Analysis
TABLE 3 Global Refractive Surgery Devices Market: Market Restraints Impact Analysis
TABLE 4 Global Refractive Surgery Devices Market, by Competitive Benchmarking, 2022
TABLE 5 Global Refractive Surgery Devices Market, by Geographical Presence Analysis, 2022
TABLE 6 Global Refractive Surgery Devices Market, by Key Strategies Analysis, 2022
TABLE 7 Global Refractive Surgery Devices Market, by Myopia, By Region, 2017-2022 (US$ Mn)
TABLE 8 Global Refractive Surgery Devices Market, by Myopia, By Region, 2023-2030 (US$ Mn)
TABLE 9 Global Refractive Surgery Devices Market, by Hyperopia, By Region, 2017-2022 (US$ Mn)
TABLE 10 Global Refractive Surgery Devices Market, by Hyperopia, By Region, 2023-2030 (US$ Mn)
TABLE 11 Global Refractive Surgery Devices Market, by Astigmatism, By Region, 2017-2022 (US$ Mn)
TABLE 12 Global Refractive Surgery Devices Market, by Astigmatism, By Region, 2023-2030 (US$ Mn)
TABLE 13 Global Refractive Surgery Devices Market, by Presbyopia, By Region, 2017-2022 (US$ Mn)
TABLE 14 Global Refractive Surgery Devices Market, by Presbyopia, By Region, 2023-2030 (US$ Mn)
TABLE 15 Global Refractive Surgery Devices Market, by Dry Eyes, By Region, 2017-2022 (US$ Mn)
TABLE 16 Global Refractive Surgery Devices Market, by Dry Eyes, By Region, 2023-2030 (US$ Mn)
TABLE 17 Global Refractive Surgery Devices Market, by Lasers, By Region, 2017-2022 (US$ Mn)
TABLE 18 Global Refractive Surgery Devices Market, by Lasers, By Region, 2023-2030 (US$ Mn)
TABLE 19 Global Refractive Surgery Devices Market, by Microkeratome, By Region, 2017-2022 (US$ Mn)
TABLE 20 Global Refractive Surgery Devices Market, by Microkeratome, By Region, 2023-2030 (US$ Mn)
TABLE 21 Global Refractive Surgery Devices Market, by Aberrometers, By Region, 2017-2022 (US$ Mn)
TABLE 22 Global Refractive Surgery Devices Market, by Aberrometers, By Region, 2023-2030 (US$ Mn)
TABLE 23 Global Refractive Surgery Devices Market, by Others, By Region, 2017-2022 (US$ Mn)
TABLE 24 Global Refractive Surgery Devices Market, by Others, By Region, 2023-2030 (US$ Mn)
TABLE 25 Global Refractive Surgery Devices Market, by Hospital, By Region, 2017-2022 (US$ Mn)
TABLE 26 Global Refractive Surgery Devices Market, by Hospital, By Region, 2023-2030 (US$ Mn)
TABLE 27 Global Refractive Surgery Devices Market, by Ambulatory Surgery Centers, By Region, 2017-2022 (US$ Mn)
TABLE 28 Global Refractive Surgery Devices Market, by Ambulatory Surgery Centers, By Region, 2023-2030 (US$ Mn)
TABLE 29 Global Refractive Surgery Devices Market, by Ophthalmology Clinics, By Region, 2023-2030 (US$ Mn)
TABLE 30 Global Refractive Surgery Devices Market, by Ophthalmology Clinics, By Region, 2023-2030 (US$ Mn)
TABLE 31 Global Refractive Surgery Devices Market, by Industrial, By Region, 2023-2030 (US$ Mn)
TABLE 32 Global Refractive Surgery Devices Market, by Industrial, By Region, 2023-2030 (US$ Mn)
TABLE 33 Global Refractive Surgery Devices Market, by Application, 2017-2022 (US$ Mn)
TABLE 34 Global Refractive Surgery Devices Market, by Application, 2023-2030 (US$ Mn)
TABLE 35 Global Refractive Surgery Devices Market, by Product, 2017-2022 (US$ Mn)
TABLE 36 Global Refractive Surgery Devices Market, by Product, 2023-2030 (US$ Mn)
TABLE 37 Global Refractive Surgery Devices Market, by End-use, 2017-2022 (US$ Mn)
TABLE 38 Global Refractive Surgery Devices Market, by End-use, 2023-2030 (US$ Mn)
TABLE 39 Global Refractive Surgery Devices Market, by Region, 2017-2022 (US$ Mn)
TABLE 40 Global Refractive Surgery Devices Market, by Region, 2023-2030 (US$ Mn)
TABLE 41 North America Refractive Surgery Devices Market, by Application, 2017-2022 (US$ Mn)
TABLE 42 North America Refractive Surgery Devices Market, by Application, 2023-2030 (US$ Mn)
TABLE 43 North America Refractive Surgery Devices Market, by Product, 2017-2022 (US$ Mn)
TABLE 44 North America Refractive Surgery Devices Market, by Product, 2023-2030 (US$ Mn)
TABLE 45 North America Refractive Surgery Devices Market, by End-use, 2017-2022 (US$ Mn)
TABLE 46 North America Refractive Surgery Devices Market, by End-use, 2023-2030 (US$ Mn)
TABLE 47 North America Refractive Surgery Devices Market, by Country, 2017-2022 (US$ Mn)
TABLE 48 North America Refractive Surgery Devices Market, by Country, 2023-2030 (US$ Mn)
TABLE 49 United States Refractive Surgery Devices Market, by Application, 2017-2022 (US$ Mn)
TABLE 50 United States Refractive Surgery Devices Market, by Application, 2023-2030 (US$ Mn)
TABLE 51 United States Refractive Surgery Devices Market, by Product, 2017-2022 (US$ Mn)
TABLE 52 United States Refractive Surgery Devices Market, by Product, 2023-2030 (US$ Mn)
TABLE 53 United States Refractive Surgery Devices Market, by End-use, 2017-2022 (US$ Mn)
TABLE 54 United States Refractive Surgery Devices Market, by End-use, 2023-2030 (US$ Mn)
TABLE 55 Canada Refractive Surgery Devices Market, by Application, 2017-2022 (US$ Mn)
TABLE 56 Canada Refractive Surgery Devices Market, by Application, 2023-2030 (US$ Mn)
TABLE 57 Canada Refractive Surgery Devices Market, by Product, 2017-2022 (US$ Mn)
TABLE 58 Canada Refractive Surgery Devices Market, by Product, 2023-2030 (US$ Mn)
TABLE 59 Canada Refractive Surgery Devices Market, by End-use, 2017-2022 (US$ Mn)
TABLE 60 Canada Refractive Surgery Devices Market, by End-use, 2023-2030 (US$ Mn)
TABLE 61 Mexico Refractive Surgery Devices Market, by Application, 2017-2022 (US$ Mn)
TABLE 62 Mexico Refractive Surgery Devices Market, by Application, 2023-2030 (US$ Mn)
TABLE 63 Mexico Refractive Surgery Devices Market, by Product, 2017-2022 (US$ Mn)
TABLE 64 Mexico Refractive Surgery Devices Market, by Product, 2023-2030 (US$ Mn)
TABLE 65 Mexico Refractive Surgery Devices Market, by End-use, 2017-2022 (US$ Mn)
TABLE 66 Mexico Refractive Surgery Devices Market, by End-use, 2023-2030 (US$ Mn)
TABLE 67 Europe Refractive Surgery Devices Market, by Application, 2017-2022 (US$ Mn)
TABLE 68 Europe Refractive Surgery Devices Market, by Application, 2023-2030 (US$ Mn)
TABLE 69 Europe Refractive Surgery Devices Market, by Product, 2017-2022 (US$ Mn)
TABLE 70 Europe Refractive Surgery Devices Market, by Product, 2023-2030 (US$ Mn)
TABLE 71 Europe Refractive Surgery Devices Market, by End-use, 2017-2022 (US$ Mn)
TABLE 72 Europe Refractive Surgery Devices Market, by End-use, 2023-2030 (US$ Mn)
TABLE 73 Europe Refractive Surgery Devices Market, by Country, 2017-2022 (US$ Mn)
TABLE 74 Europe Refractive Surgery Devices Market, by Country, 2023-2030 (US$ Mn)
TABLE 75 Germany Refractive Surgery Devices Market, by Application, 2017-2022 (US$ Mn)
TABLE 76 Germany Refractive Surgery Devices Market, by Application, 2023-2030 (US$ Mn)
TABLE 77 Germany Refractive Surgery Devices Market, by Product, 2017-2022 (US$ Mn)
TABLE 78 Germany Refractive Surgery Devices Market, by Product, 2023-2030 (US$ Mn)
TABLE 79 Germany Refractive Surgery Devices Market, by End-use, 2017-2022 (US$ Mn)
TABLE 80 Germany Refractive Surgery Devices Market, by End-use, 2023-2030 (US$ Mn)
TABLE 81 France Refractive Surgery Devices Market, by Application, 2017-2022 (US$ Mn)
TABLE 82 France Refractive Surgery Devices Market, by Application, 2023-2030 (US$ Mn)
TABLE 83 France Refractive Surgery Devices Market, by Product, 2017-2022 (US$ Mn)
TABLE 84 France Refractive Surgery Devices Market, by Product, 2023-2030 (US$ Mn)
TABLE 85 France Refractive Surgery Devices Market, by End-use, 2017-2022 (US$ Mn)
TABLE 86 France Refractive Surgery Devices Market, by End-use, 2023-2030 (US$ Mn)
TABLE 87 United Kingdom Refractive Surgery Devices Market, by Application, 2017-2022 (US$ Mn)
TABLE 88 United Kingdom Refractive Surgery Devices Market, by Application, 2023-2030 (US$ Mn)
TABLE 89 United Kingdom Refractive Surgery Devices Market, by Product, 2017-2022 (US$ Mn)
TABLE 90 United Kingdom Refractive Surgery Devices Market, by Product, 2023-2030 (US$ Mn)
TABLE 91 United Kingdom Refractive Surgery Devices Market, by End-use, 2017-2022 (US$ Mn)
TABLE 92 United Kingdom Refractive Surgery Devices Market, by End-use, 2023-2030 (US$ Mn)
TABLE 93 Italy Refractive Surgery Devices Market, by Application, 2017-2022 (US$ Mn)
TABLE 94 Italy Refractive Surgery Devices Market, by Application, 2023-2030 (US$ Mn)
TABLE 95 Italy Refractive Surgery Devices Market, by Product, 2017-2022 (US$ Mn)
TABLE 96 Italy Refractive Surgery Devices Market, by Product, 2023-2030 (US$ Mn)
TABLE 97 Italy Refractive Surgery Devices Market, by End-use, 2017-2022 (US$ Mn)
TABLE 98 Italy Refractive Surgery Devices Market, by End-use, 2023-2030 (US$ Mn)
TABLE 99 Spain Refractive Surgery Devices Market, by Application, 2017-2022 (US$ Mn)
TABLE 100 Spain Refractive Surgery Devices Market, by Application, 2023-2030 (US$ Mn)
TABLE 101 Spain Refractive Surgery Devices Market, by Product, 2017-2022 (US$ Mn)
TABLE 102 Spain Refractive Surgery Devices Market, by Product, 2023-2030 (US$ Mn)
TABLE 103 Spain Refractive Surgery Devices Market, by End-use, 2017-2022 (US$ Mn)
TABLE 104 Spain Refractive Surgery Devices Market, by End-use, 2023-2030 (US$ Mn)
TABLE 105 Rest of Europe Refractive Surgery Devices Market, by Application, 2017-2022 (US$ Mn)
TABLE 106 Rest of Europe Refractive Surgery Devices Market, by Application, 2023-2030 (US$ Mn)
TABLE 107 Rest of Europe Refractive Surgery Devices Market, by Product, 2017-2022 (US$ Mn)
TABLE 108 Rest of Europe Refractive Surgery Devices Market, by End-use, 2023-2030 (US$ Mn)
TABLE 109 Rest of Europe Refractive Surgery Devices Market, by End-use, 2017-2022 (US$ Mn)
TABLE 110 Rest of Europe Refractive Surgery Devices Market, by Product, 2023-2030 (US$ Mn)
TABLE 111 Asia Pacific Refractive Surgery Devices Market, by Application, 2017-2022 (US$ Mn)
TABLE 112 Asia Pacific Refractive Surgery Devices Market, by Application, 2023-2030 (US$ Mn)
TABLE 113 Asia Pacific Refractive Surgery Devices Market, by Product, 2017-2022 (US$ Mn)
TABLE 114 Asia Pacific Refractive Surgery Devices Market, by Product, 2023-2030 (US$ Mn)
TABLE 115 Asia Pacific Refractive Surgery Devices Market, by End-use, 2017-2022 (US$ Mn)
TABLE 116 Asia Pacific Refractive Surgery Devices Market, by End-use, 2023-2030 (US$ Mn)
TABLE 117 Asia Pacific Refractive Surgery Devices Market, by Country, 2017-2022 (US$ Mn)
TABLE 118 Asia Pacific Refractive Surgery Devices Market, by Country, 2023-2030 (US$ Mn)
TABLE 119 China Refractive Surgery Devices Market, by Application, 2017-2022 (US$ Mn)
TABLE 120 China Refractive Surgery Devices Market, by Application, 2023-2030 (US$ Mn)
TABLE 121 China Refractive Surgery Devices Market, by Product, 2017-2022 (US$ Mn)
TABLE 122 China Refractive Surgery Devices Market, by Product, 2023-2030 (US$ Mn)
TABLE 123 China Refractive Surgery Devices Market, by End-use, 2017-2022 (US$ Mn)
TABLE 124 China Refractive Surgery Devices Market, by End-use, 2023-2030 (US$ Mn)
TABLE 125 Japan Refractive Surgery Devices Market, by Application, 2017-2022 (US$ Mn)
TABLE 126 Japan Refractive Surgery Devices Market, by Application, 2023-2030 (US$ Mn)
TABLE 127 Japan Refractive Surgery Devices Market, by Product, 2017-2022 (US$ Mn)
TABLE 128 Japan Refractive Surgery Devices Market, by Product, 2023-2030 (US$ Mn)
TABLE 129 Japan Refractive Surgery Devices Market, by End-use, 2017-2022 (US$ Mn)
TABLE 130 Japan Refractive Surgery Devices Market, by End-use, 2023-2030 (US$ Mn)
TABLE 131 India Refractive Surgery Devices Market, by Application, 2017-2022 (US$ Mn)
TABLE 132 India Refractive Surgery Devices Market, by Application, 2023-2030 (US$ Mn)
TABLE 133 India Refractive Surgery Devices Market, by Product, 2017-2022 (US$ Mn)
TABLE 134 India Refractive Surgery Devices Market, by Product, 2023-2030 (US$ Mn)
TABLE 135 India Refractive Surgery Devices Market, by End-use, 2017-2022 (US$ Mn)
TABLE 136 India Refractive Surgery Devices Market, by End-use, 2023-2030 (US$ Mn)
TABLE 137 South Korea Refractive Surgery Devices Market, by Application, 2017-2022 (US$ Mn)
TABLE 138 South Korea Refractive Surgery Devices Market, by Application, 2023-2030 (US$ Mn)
TABLE 139 South Korea Refractive Surgery Devices Market, by Product, 2017-2022 (US$ Mn)
TABLE 140 South Korea Refractive Surgery Devices Market, by Product, 2023-2030 (US$ Mn)
TABLE 141 South Korea Refractive Surgery Devices Market, by End-use, 2017-2022 (US$ Mn)
TABLE 142 South Korea Refractive Surgery Devices Market, by End-use, 2023-2030 (US$ Mn)
TABLE 143 South-East Asia Refractive Surgery Devices Market, by Application, 2017-2022 (US$ Mn)
TABLE 144 South-East Asia Refractive Surgery Devices Market, by Application, 2023-2030 (US$ Mn)
TABLE 145 South-East Asia Refractive Surgery Devices Market, by Product, 2017-2022 (US$ Mn)
TABLE 146 South-East Asia Refractive Surgery Devices Market, by Product, 2023-2030 (US$ Mn)
TABLE 147 South-East Asia Refractive Surgery Devices Market, by End-use, 2017-2022 (US$ Mn)
TABLE 148 South-East Asia Refractive Surgery Devices Market, by End-use, 2023-2030 (US$ Mn)
TABLE 149 Rest of Asia Pacific Refractive Surgery Devices Market, by Application, 2017-2022 (US$ Mn)
TABLE 150 Rest of Asia Pacific Refractive Surgery Devices Market, by Application, 2023-2030 (US$ Mn)
TABLE 151 Rest of Asia Pacific Refractive Surgery Devices Market, by Product, 2017-2022 (US$ Mn)
TABLE 152 Rest of Asia Pacific Refractive Surgery Devices Market, by Product, 2023-2030 (US$ Mn)
TABLE 153 Rest of Asia Pacific Refractive Surgery Devices Market, by End-use, 2017-2022 (US$ Mn)
TABLE 154 Rest of Asia Pacific Refractive Surgery Devices Market, by End-use, 2023-2030 (US$ Mn)
TABLE 155 Latin America Refractive Surgery Devices Market, by Application, 2017-2022 (US$ Mn)
TABLE 156 Latin America Refractive Surgery Devices Market, by Application, 2023-2030 (US$ Mn)
TABLE 157 Latin America Refractive Surgery Devices Market, by Product, 2017-2022 (US$ Mn)
TABLE 158 Latin America Refractive Surgery Devices Market, by Product, 2023-2030 (US$ Mn)
TABLE 159 Latin America Refractive Surgery Devices Market, by End-use, 2017-2022 (US$ Mn)
TABLE 160 Latin America Refractive Surgery Devices Market, by End-use, 2023-2030 (US$ Mn)
TABLE 161 Latin America Refractive Surgery Devices Market, by Country, 2017-2022 (US$ Mn)
TABLE 162 Latin America Refractive Surgery Devices Market, by Country, 2023-2030 (US$ Mn)
TABLE 163 Brazil Refractive Surgery Devices Market, by Application, 2017-2022 (US$ Mn)
TABLE 164 Brazil Refractive Surgery Devices Market, by Application, 2023-2030 (US$ Mn)
TABLE 165 Brazil Refractive Surgery Devices Market, by Product, 2017-2022 (US$ Mn)
TABLE 166 Brazil Refractive Surgery Devices Market, by Product, 2023-2030 (US$ Mn)
TABLE 167 Brazil Refractive Surgery Devices Market, by End-use, 2017-2022 (US$ Mn)
TABLE 168 Brazil Refractive Surgery Devices Market, by End-use, 2023-2030 (US$ Mn)
TABLE 169 Argentina Refractive Surgery Devices Market, by Application, 2017-2022 (US$ Mn)
TABLE 170 Argentina Refractive Surgery Devices Market, by Application, 2023-2030 (US$ Mn)
TABLE 171 Argentina Refractive Surgery Devices Market, by Product, 2017-2022 (US$ Mn)
TABLE 172 Argentina Refractive Surgery Devices Market, by Product, 2023-2030 (US$ Mn)
TABLE 173 Argentina Refractive Surgery Devices Market, by End-use, 2017-2022 (US$ Mn)
TABLE 174 Argentina Refractive Surgery Devices Market, by End-use, 2023-2030 (US$ Mn)
TABLE 175 Rest of Latin America Refractive Surgery Devices Market, by Application, 2017-2022 (US$ Mn)
TABLE 176 Rest of Latin America Refractive Surgery Devices Market, by Application, 2023-2030 (US$ Mn)
TABLE 177 Rest of Latin America Refractive Surgery Devices Market, by Product, 2017-2022 (US$ Mn)
TABLE 178 Rest of Latin America Refractive Surgery Devices Market, by Product, 2023-2030 (US$ Mn)
TABLE 179 Rest of Latin America Refractive Surgery Devices Market, by End-use, 2017-2022 (US$ Mn)
TABLE 180 Rest of Latin America Refractive Surgery Devices Market, by End-use, 2023-2030 (US$ Mn)
TABLE 181 Middle East and Africa Refractive Surgery Devices Market, by Application, 2017-2022 (US$ Mn)
TABLE 182 Middle East and Africa Refractive Surgery Devices Market, by Application, 2023-2030 (US$ Mn)
TABLE 183 Middle East and Africa Refractive Surgery Devices Market, by Product, 2017-2022 (US$ Mn)
TABLE 184 Middle East and Africa Refractive Surgery Devices Market, by Product, 2023-2030 (US$ Mn)
TABLE 185 Middle East and Africa Refractive Surgery Devices Market, by End-use, 2017-2022 (US$ Mn)
TABLE 186 Middle East and Africa Refractive Surgery Devices Market, by End-use, 2023-2030 (US$ Mn)
TABLE 187 Middle East and Africa Refractive Surgery Devices Market, by Country, 2017-2022 (US$ Mn)
TABLE 188 Middle East and Africa Refractive Surgery Devices Market, by Country, 2023-2030 (US$ Mn)
TABLE 189 GCC Countries Refractive Surgery Devices Market, by Application, 2017-2022 (US$ Mn)
TABLE 190 GCC Countries Refractive Surgery Devices Market, by Application, 2023-2030 (US$ Mn)
TABLE 191 GCC Countries Refractive Surgery Devices Market, by Product, 2017-2022 (US$ Mn)
TABLE 192 GCC Countries Refractive Surgery Devices Market, by Product, 2023-2030 (US$ Mn)
TABLE 193 GCC Countries Refractive Surgery Devices Market, by End-use, 2017-2022 (US$ Mn)
TABLE 194 GCC Countries Refractive Surgery Devices Market, by End-use, 2023-2030 (US$ Mn)
TABLE 195 South Africa Refractive Surgery Devices Market, by Application, 2017-2022 (US$ Mn)
TABLE 196 South Africa Refractive Surgery Devices Market, by Application, 2023-2030 (US$ Mn)
TABLE 197 South Africa Refractive Surgery Devices Market, by Product, 2017-2022 (US$ Mn)
TABLE 198 South Africa Refractive Surgery Devices Market, by Product, 2023-2030 (US$ Mn)
TABLE 199 South Africa Refractive Surgery Devices Market, by End-use, 2017-2022 (US$ Mn)
TABLE 200 South Africa Refractive Surgery Devices Market, by End-use, 2023-2030 (US$ Mn)
TABLE 201 Rest of Middle East and Africa Refractive Surgery Devices Market, by Application, 2017-2022 (US$ Mn)
TABLE 202 Rest of Middle East and Africa Refractive Surgery Devices Market, by Application, 2023-2030 (US$ Mn)
TABLE 203 Rest of Middle East and Africa Refractive Surgery Devices Market, by Product, 2017-2022 (US$ Mn)
TABLE 204 Rest of Middle East and Africa Refractive Surgery Devices Market, by Product, 2023-2030 (US$ Mn)
TABLE 205 Rest of Middle East and Africa Refractive Surgery Devices Market, by End-use, 2017-2022 (US$ Mn)
TABLE 206 Rest of Middle East and Africa Refractive Surgery Devices Market, by End-use, 2023-2030 (US$ Mn)

Frequently Asked Questions

What is the current size of the global refractive surgery devices market?

The global refractive surgery devices market was valued at USD 171.5 Million in 2022.

What is the expected growth rate of the refractive surgery devices market between 2023 and 2030?

The refractive surgery devices market is expected to grow at a CAGR of 7.90% between 2023 and 2030, reaching USD 292.02 Million in 2030.

Which segment is leading the market share in terms of product?

Lazers is the leading segment by product, in terms of value in 2022.

Which application segment is the dominant in terms of demand for refractive surgery devices in the world?

The Myopia segment is the dominant in terms of demand for refractive surgery devices in the world.

Which segment in end use is expected to post the highest CAGR during the forecast period?

The Hospitals segment is expected to post the highest CAGR during the forecast period.

Which region is fueling the growth of the refractive surgery devices industry?

North America is fueling the growth of the refractive surgery devices industry, with over one-third share in 2022.

Who are the major players in the global refractive surgery devices market?

The top players include Johnson & Johnson Services, Inc.; Carl Zeiss Meditec AG; Alcon; Bausch & Lomb Incorporated; Quantel Medical; TOPCON CORPORATION; Essilor; NIDEK CO., LTD.; SCHWIND eye-tech-solutions.

What are the major market drivers of the refractive surgery devices industry?

Rise in geriatric population and the increased screen time of the global population are the major market drivers.

What are the major market restraints of the refractive surgery devices industry?

High price and poor adoption rates in terms of refractive surgery devices are the major market restraints.

What are the major market opportunities of the refractive surgery devices industry?

Advent of technologically advanced minimally invasive surgeries are the major opportunities in the refractive surgery devices industry.

Cancer Supportive Care Market

Published:
Report ID: 1901

Middle East and Africa Radiopharmaceuticals Market

Published:
Report ID: 37164

Handheld Surgical Instruments Market

Published:
Report ID: 37153

Lung Biopsy Market

Published:
Report ID: 37131

Mammography Market

Published:
Report ID: 37075

Temperature Controlled Pharma Packaging Solutions Market

Published:
Report ID: 20599

Vietnam Pneumococcal Vaccine Market

Published:
Report ID: 37015

Head and Neck Cancer Market

Published:
Report ID: 36992

Disposable Surgical Devices Market

Published:
Report ID: 36989

Ophthalmoscopes Market

Published:
Report ID: 36972

Japan Restorative Dentistry Market

Published:
Report ID: 36960

India Traditional Medicine Market

Published:
Report ID: 36954

Purchase Options

$2999
Delivery Format: Excel.
$4999
Designed for the individual purchaser.
$6999
Users located at a single corporate site or regional office.
$7999
Allowed for unlimited sharing globally within one company.
Smallform of Sample request

Have a question?

User Profile

Don’t settle for less – trust Mitul to help you find the best solution.

Report delivery within 24 to 48 hours

– Other Info –

What people say?-

User Review

I am very impressed with the information in this report. The author clearly did their research when they came up with this product and it has already given me a lot of ideas.

Jana Schmidt
CEDAR CX Technologies

– Connect with us –

Phone

+91 6232 49 3207


support

24/7 Research Support


sales@credenceresearch.com

– Research Methodology –

Going beyond the basics: advanced techniques in research methodology

– Trusted By –

Pepshi, LG, Nestle
Motorola, Honeywell, Johnson and johnson
LG Chem, SIEMENS, Pfizer
Unilever, Samsonite, QIAGEN