
Market overview
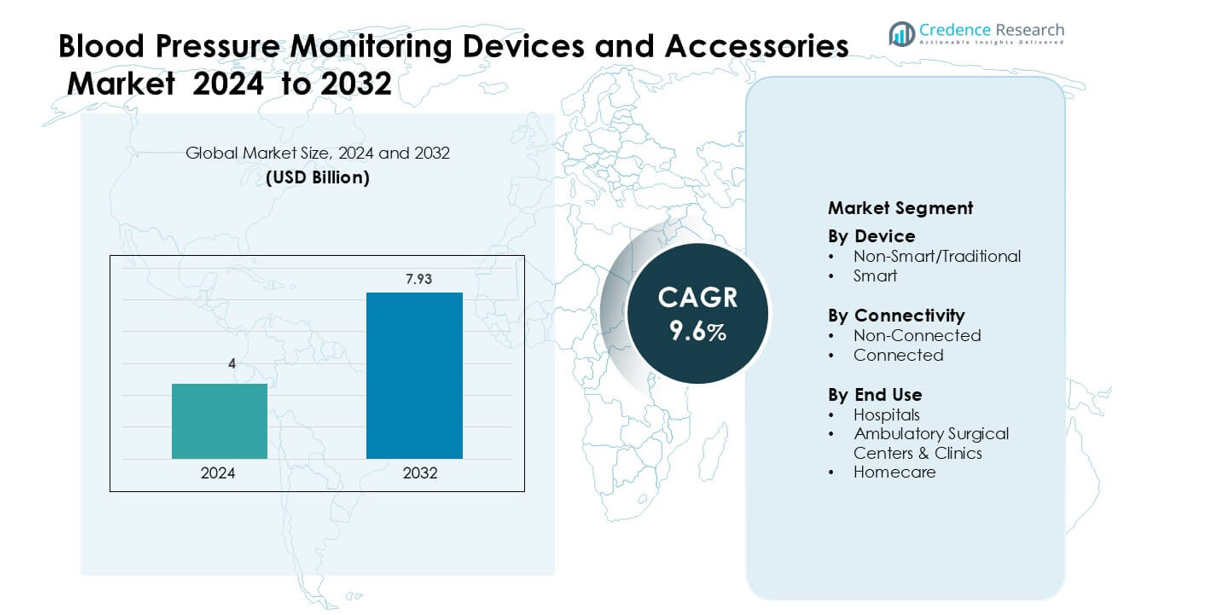
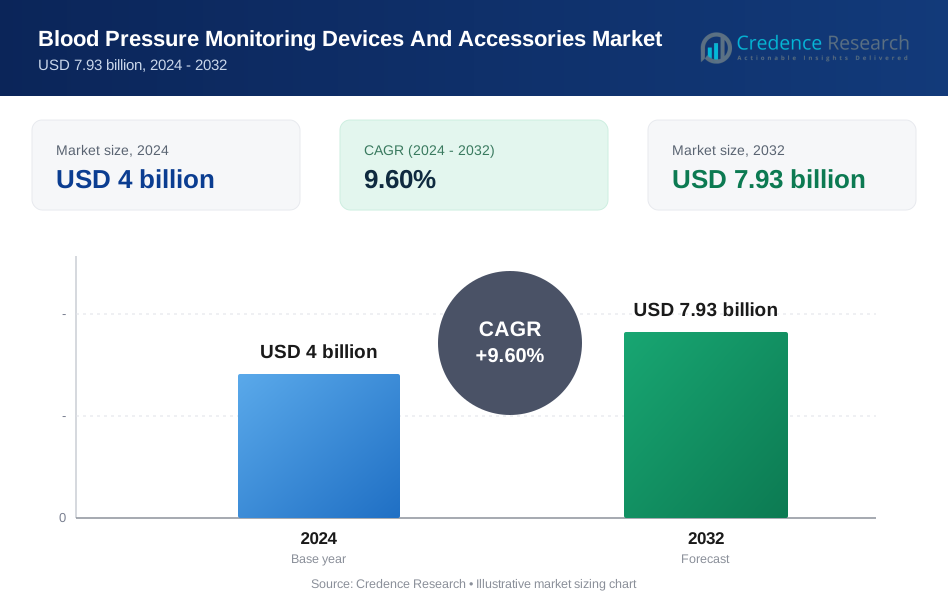
Blood Pressure Monitoring Devices and Accessories Market was valued at USD 4 billion in 2024 and is anticipated to reach USD 7.93 billion by 2032, growing at a CAGR of 9.6% during the forecast period.
| REPORT ATTRIBUTE | DETAILS |
|---|---|
| Historical Period | 2020-2023 |
| Base Year | 2024 |
| Forecast Period | 2025-2032 |
| Blood Pressure Monitoring Devices and Accessories Market Size 2024 | USD 4 billion |
| Blood Pressure Monitoring Devices and Accessories Market, CAGR | 9.6% |
| Blood Pressure Monitoring Devices and Accessories Market Size 2032 | USD 7.93 billion |
The Blood Pressure Monitoring Devices and Accessories Market is shaped by leading players such as Microlife AG, GE Healthcare, A&D Medical Inc., Kaz Inc., SunTech Medical, Inc., Withings, Welch Allyn, Inc., Omron Healthcare, Briggs Healthcare, and American Diagnostics Corporation. These companies compete through advancements in digital accuracy, connected monitoring features, and user-friendly cuff designs for clinical and home settings. They continue to expand portfolios with smart devices that support remote care and chronic disease management. North America leads the market with a 34% share, driven by high hypertension prevalence, strong adoption of homecare monitors, and well-established digital health infrastructure.
Market Insights
- The Blood Pressure Monitoring Devices and Accessories Market reached USD 4 billion in 2024 and will grow at a 9.6% CAGR through 2032.
- Rising hypertension cases and expanding homecare monitoring drive strong adoption of digital and traditional devices across hospitals, clinics, and households.
- Smart, app-connected monitors, cloud data sharing, and wearable-based tracking shape major trends as users shift toward real-time monitoring and preventive care.
- The market remains competitive with companies improving accuracy, comfort, and connectivity, while restraints arise from data privacy concerns and accuracy variations in low-cost devices.
- North America leads with a 34% share, while non-smart devices hold a 62% segment share due to strong use in hospitals; Asia Pacific shows the fastest growth supported by rising screening programs and growing homecare use.
Market Segmentation Analysis:
By Device
Non-smart blood pressure monitors lead the market with a 62% share due to wide use across hospitals and clinics. These devices offer stable readings, simple handling, and lower maintenance, which suits high-volume workflows. Demand remains strong as care teams rely on cuff-based systems for routine checks and rapid triage. Smart monitors grow as patients track readings through mobile apps for better chronic disease management. Their rise links to rising hypertension cases and remote care programs, but non-smart monitors remain dominant because medical staff still prefer manual validation during critical assessments.
- For instance, Welch Allyn’s Connex VSM 6000 series which supports non‑invasive blood pressure (NIBP) monitoring in hospital settings was cleared by the U.S. FDA and is used broadly on general medical and surgical floors.
By Connectivity
Non-connected devices dominate this segment with a 58% share because healthcare settings continue to rely on standalone monitors for quick, offline checks. These systems reduce data syncing issues and support smooth operation in emergency rooms and general wards. Growth stays steady as many providers prioritize durability and low cost. Connected monitors gain adoption as digital health expands, offering automated data transfer for long-term tracking. Demand rises in homecare and telehealth programs, but non-connected units hold the lead due to strong uptake in traditional clinical environments.
- For instance, the Welch Allyn Connex Pro BP 3400 supports up to 100 readings on a single lithium‑ion charge and operates in under 15 seconds per measurement, making it ideal for busy wards that cannot rely on network connectivity.
By End Use
Hospitals account for the largest share at 49%, driven by continuous patient monitoring needs in emergency, critical care, and general wards. These facilities use a large volume of cuffs, digital monitors, and wall-mounted units to support frequent checks across departments. Adoption grows as hospitals upgrade to accurate, automated systems that reduce manual error and improve workflow. Homecare expands fast as patients seek self-monitoring solutions for hypertension management. Clinics and ambulatory centers show stable demand, but hospitals remain dominant due to their high patient load and structured monitoring protocols.
Key Growth Drivers
Rising Hypertension Prevalence and Aging Population
The global rise in hypertension cases acts as a major driver for blood pressure monitoring devices. More adults develop lifestyle-related risk factors such as obesity, stress, and sedentary habits, which increase dependence on regular monitoring. The aging population further boosts demand because older adults require frequent assessment to manage chronic cardiovascular conditions. Healthcare systems now encourage routine blood pressure checks to reduce hospital admissions linked to stroke and heart failure. This shift increases the adoption of both clinic-grade and home-use monitors. Governments and health agencies also promote early screening programs, which supports higher sales across community health centers and retail channels. Growing awareness of preventive care strengthens the market and encourages users to invest in easy-to-use digital monitors for daily readings. Rising diagnosis rates ensure long-term growth across hospitals, clinics, and homecare settings, making hypertension prevalence a sustained growth catalyst.
- For instance, according to World Health Organization (WHO) data, an estimated 1.4 billion adults aged 30‑79 years have hypertension in 2024.
Expansion of Homecare and Remote Patient Monitoring
A rapid shift toward home-based care strongly accelerates uptake of blood pressure monitoring devices. Many patients prefer home monitoring to avoid frequent hospital visits and gain greater control over chronic conditions. Remote patient monitoring programs help clinicians track readings in real time and intervene early when levels fluctuate. This approach reduces emergency admissions and supports long-term disease management. Advancements in wireless cuffs, app-linked devices, and data-sharing platforms improve patient experience and drive adoption. Growing telehealth use encourages families to invest in digital monitors for continuous care. Healthcare providers also integrate remote tracking into chronic disease programs to support early detection and better follow-ups. As homecare adoption increases, device makers focus on simple interfaces, adjustable cuffs, and reliable digital outputs. This trend positions home monitoring as a primary growth engine across developed and emerging markets.
- For instance, OMRON’s “VitalSight™” remote patient monitoring service-launched commercially in September 2020-enables patients to measure blood pressure at home and send readings directly to their clinicians via a pre‑configured hub and monitor.
Technological Advancements and Smart Device Adoption
Rapid innovation in device accuracy, connectivity, and material quality drives strong market growth. Smart blood pressure monitors now offer automated data syncing, multi-user tracking, and cloud storage, making hypertension management easier for patients and providers. AI-based algorithms improve reading consistency by reducing motion-related errors. New cuff designs made with soft, skin-friendly materials support long, comfortable use. Integration with smartphones and health platforms allows users to share reports with clinicians instantly, improving care coordination. Device makers also focus on battery efficiency, compact forms, and digital displays to enhance usability. These upgrades encourage replacements of older devices in homes and clinics. The shift toward digital ecosystems creates new revenue opportunities for companies offering connected accessories and mobile apps.
Key Trends and Opportunities
Growing Demand for Connected Health Ecosystems
Connected monitoring ecosystems present a major growth opportunity as healthcare providers move toward integrated digital care. Many hospitals deploy electronic health records that require seamless input from blood pressure devices, creating demand for Bluetooth and Wi-Fi-enabled monitors. Patients increasingly prefer app-based tracking to observe trends, receive reminders, and maintain digital logs. These features strengthen adherence to hypertension treatment and support long-term disease management. Companies invest in interoperable platforms that link wearable sensors, BP monitors, and teleconsultation portals. As remote consultations grow, smart devices become central to chronic care programs. This shift opens opportunities for subscription-based apps, clinical dashboards, and AI-driven analytics.
- For instance, A&D s UA‑656BLE telehealth blood pressure monitor features Bluetooth 5.1 LE communication and is Certified for Continua™ interoperability-ensuring the device can connect with broader health‑IT systems.
Rising Focus on Preventive Healthcare and Wellness Programs
Preventive healthcare campaigns create strong opportunities for device makers as governments and insurers promote routine blood pressure monitoring to reduce healthcare costs. Employers integrate wellness programs that track cardiovascular indicators, increasing adoption of portable monitors. Pharmacies and retail clinics now offer screening booths that rely on accurate and durable monitoring systems. Growing awareness of lifestyle diseases motivates younger users to adopt digital tools for self-care. Awareness campaigns by health agencies encourage periodic checks, expanding market reach into non-clinical environments. Preventive monitoring also supports early diagnosis, reducing future treatment burdens and driving long-term demand.
- For instance, in India the Omron Healthcare India import‑data shows 352 shipments by the company alone in one year, accounting for around 52% of all blood pressure monitor imports into the country.
Key Challenges
Accuracy Limitations in Low-Cost and Consumer-Grade Devices
Many low-cost monitors face accuracy concerns due to inconsistent sensor quality, poor calibration, or limited validation across diverse arm sizes. These issues reduce clinical acceptance and create mistrust among patients who rely on precise readings for hypertension management. Inaccurate measurements may lead to misdiagnosis or improper medication adjustments, increasing health risks. Manufacturers struggle to balance affordability with high-quality components. Regulatory bodies now push for stricter validation standards, which raises compliance costs for small players. Lack of physician confidence slows adoption of certain smart devices in clinical settings, making accuracy a persistent challenge.
Data Privacy and Integration Barriers in Connected Devices
Connected monitors generate sensitive health data, raising concerns about privacy, storage, and cyber risks. Many devices face issues integrating with hospital systems due to interoperability gaps and inconsistent data formats. Patients worry about unauthorized access to their health information, which limits use of cloud-based platforms. Healthcare providers must invest in secure IT infrastructure to support remote monitoring programs. These upgrades increase operational costs and slow digital adoption in resource-limited settings. Regulatory compliance for data protection also raises development burdens for manufacturers. As digital ecosystems expand, addressing data security becomes a major challenge for sustained market growth.
Regional Analysis
North America
North America holds a 34% share driven by strong adoption of digital and homecare monitoring devices across the U.S. and Canada. High hypertension prevalence, early diagnosis programs, and strong insurance support reinforce demand. Hospitals upgrade to automated systems to improve workflow and reduce manual errors, while consumers adopt smart monitors for remote care. Strong presence of global manufacturers speeds product innovation and regulatory approvals. The region benefits from mature telehealth infrastructure, which boosts use of connected cuffs. Growing focus on preventive care and chronic disease management ensures continued market expansion across clinical and home settings.
Europe
Europe accounts for a 29% share, supported by structured screening programs and high awareness of cardiovascular risks. Countries such as Germany, the U.K., and France invest in diagnostic upgrades and encourage routine monitoring in primary care centers. Hospitals adopt automated monitors to enhance accuracy, while aging populations drive strong homecare device demand. Manufacturers benefit from favorable regulations that promote safe, validated medical devices. Rising digital health investments improve integration of connected monitors into national healthcare systems. The region’s emphasis on preventive care and chronic disease control sustains long-term growth across home, clinic, and hospital segments.
Asia Pacific
Asia Pacific leads emerging growth with a 28% share, driven by rising hypertension cases, rapid urbanization, and expanding healthcare infrastructure. China, Japan, India, and South Korea witness strong uptake of digital devices as families shift toward home-based monitoring. Governments promote early screening to reduce rising cardiovascular disease burdens, increasing demand from primary care and diagnostic centers. Growing middle-class health spending boosts adoption of smart monitors with app connectivity. Local manufacturers expand production capacity, making devices more affordable. The region’s fast-growing telehealth ecosystem strengthens long-term demand for connected blood pressure monitoring solutions.
Latin America
Latin America holds a 5% share, supported by rising awareness of hypertension and improving access to diagnostic tools. Brazil, Mexico, and Argentina show steady adoption as public hospitals procure automated monitors for chronic disease management programs. Homecare use grows as consumers seek affordable digital devices for routine tracking. Market expansion is limited by budget constraints in smaller countries, but private health networks drive moderate demand. Gradual growth in telemedicine improves adoption of connected monitors. Strengthening regulatory standards and imports from global players help raise product quality and availability across clinics and pharmacies.
Middle East & Africa
The Middle East & Africa region holds a 4% share, driven by rising incidence of lifestyle-related hypertension and increasing investment in hospital infrastructure. Gulf countries adopt advanced monitoring systems in large healthcare facilities, while urban centers in Africa see rising demand for affordable digital monitors. Government-led screening campaigns support early diagnosis, especially in high-risk populations. Limited access to homecare devices in rural areas slows overall penetration, but expanding private clinics improve availability. Growing telehealth pilot programs gradually raise interest in connected devices. The region shows steady long-term potential as healthcare modernization continues.
Market Segmentations:
By Device
- Non-Smart/Traditional
- Smart
By Connectivity
- Non-Connected
- Connected
By End Use
- Hospitals
- Ambulatory Surgical Centers & Clinics
- Homecare
By Geography
- North America
- U.S.
- Canada
- Mexico
- Europe
- Germany
- France
- U.K.
- Italy
- Spain
- Rest of Europe
- Asia Pacific
- China
- Japan
- India
- South Korea
- South-east Asia
- Rest of Asia Pacific
- Latin America
- Brazil
- Argentina
- Rest of Latin America
- Middle East & Africa
- GCC Countries
- South Africa
- Rest of the Middle East and Africa
Competitive Landscape
The competitive landscape of the Blood Pressure Monitoring Devices and Accessories Market features strong participation from global medical device leaders and specialized digital health companies. Key players focus on improving measurement accuracy, enhancing user comfort, and integrating smart connectivity features to meet rising demand from hospitals, clinics, and homecare users. Manufacturers invest in advanced sensors, adjustable cuff technologies, and cloud-linked platforms to support remote monitoring. Many companies strengthen portfolios through product upgrades, regulatory approvals, and regional expansion strategies. Partnerships with telehealth providers and healthcare networks help widen device adoption and improve long-term patient tracking. Competitive pressure remains high as firms introduce compact, easy-to-use digital monitors targeting chronic disease management. Growing demand for connected solutions pushes companies to offer mobile app integrations and multi-user data tracking. Together, these strategies shape a dynamic market where innovation, compliance, and user-centric designs determine leadership.
Key Player Analysis
- Microlife AG
- GE Healthcare
- A&D Medical Inc.
- Kaz Inc.
- SunTech Medical, Inc.
- Withings
- Welch Allyn, Inc.
- Omron Healthcare
- Briggs Healthcare
- American Diagnostics Corporation
Recent Developments
- In October 2025, GE HealthCare expanded its Carevance platform with advanced patient monitoring features, including tools for detecting and managing perioperative hypotension, strengthening blood pressure management workflows.
- In September 2024, Nihon Kohden’s Board of Directors approved the purchase of a 71.4% stake in NeuroAdvanced Corp. (“NAC”), the parent company of Ad-Tech Medical Instrument Corporation (“Ad-Tech”) in the U.S. Following the acquisition, NAC and Ad-Tech were consolidated and designated as principal subsidiaries of Nihon Kohden, as their total capital represented 10% or more of Nihon Kohden’s overall capital.
- In May 2024, OMRON Healthcare India partnered with AliveCor to introduce portable ECG monitoring devices in India. This collaboration aims to offer advanced, easy-to-use solutions for heart health monitoring, enabling users to track their ECG readings conveniently
Report Coverage
The research report offers an in-depth analysis based on Device, Connectivity, End-Use and Geography. It details leading market players, providing an overview of their business, product offerings, investments, revenue streams, and key applications. Additionally, the report includes insights into the competitive environment, SWOT analysis, current market trends, as well as the primary drivers and constraints. Furthermore, it discusses various factors that have driven market expansion in recent years. The report also explores market dynamics, regulatory scenarios, and technological advancements that are shaping the industry. It assesses the impact of external factors and global economic changes on market growth. Lastly, it provides strategic recommendations for new entrants and established companies to navigate the complexities of the market.
Future Outlook
- Demand for home-based digital monitors will rise as users focus on continuous tracking.
- Smart, connected devices will gain wider use with stronger integration into telehealth platforms.
- AI-driven accuracy improvements will support better diagnosis and reduce reading errors.
- Wearable blood pressure technologies will expand and attract younger users.
- Hospitals will adopt more automated systems to improve workflow and reduce manual checks.
- Cloud data sharing will become standard for long-term hypertension management.
- Manufacturers will develop more comfortable, adjustable cuffs for diverse patient groups.
- Preventive health programs will boost routine monitoring across emerging markets.
- Regulatory bodies will push stricter validation standards to ensure measurement reliability.
- Global players will expand through partnerships and product upgrades to strengthen market presence.
Request a Free Sample
Fill in your details and we'll send you a free sample report.
- Sample data tables & charts
- Research methodology
Need a Custom Version of This Report?
Tailor the scope, geography, or segments to your exact requirements.
- Custom geography or segment scope
- Direct access to our analyst team
Frequently Asked Questions
What is the current market size for the Blood Pressure Monitoring Devices and Accessories Market, and what is its projected size in 2032?
At what Compound Annual Growth Rate is the Blood Pressure Monitoring Devices and Accessories Market projected to grow between 2025 and 2032?
Which segment is expected to post the highest CAGR during the forecast period?
Who are the major players in the global Blood pressure monitoring devices and accessories market?
What are the major market drivers of the Blood pressure monitoring devices and accessories industry?
What are the major market opportunities of the Blood pressure monitoring devices and accessories industry?
Who are the leading companies in the Blood Pressure Monitoring Devices and Accessories Market?
Table of Content
Chapter 1. Report Introduction
- 1.1 Report Description & Purpose
- 1.1.1 Report Title & Market Definition
- 1.1.2 Unique Selling Propositions (USP) & Key Differentiators
- 1.1.3 Value Proposition for Stakeholders
- 1.2 Research Objectives
- 1.2.1 Market Sizing Objectives (Volume & Revenue) (Volume Where Applicable)
- 1.2.2 Segmentation Objectives
- 1.2.3 Competitive Intelligence Objectives
- 1.2.4 Forecast & Scenario Objectives
- 1.3 Report Scope
- 1.3.1 Blood Pressure Monitoring Devices And Accessories Scope – Segments & Subsegments Covered
- 1.3.2 Geographic Scope – Regions & Countries Covered
- 1.3.3 Historical Period, Base Year & Forecast Period (2024; forecast to 2032)
- 1.3.4 Inclusions & Exclusions
- 1.4 Industry Classification & Applicable Codes
- 1.5 Currency, Measurement Units & Valuation Basis
- 1.6 Target Stakeholders
- 1.7 Limitations & Assumptions
Chapter 2. Executive Summary
- 2.1 Global Blood Pressure Monitoring Devices And Accessories Market Snapshot
- 2.1.1 Market Size – Historical (2024) & Forecast (2024-2032) (2024: USD 4 billion → 2032: USD 7.93 billion)
- 2.1.2 Volume & Revenue – Global Totals (Volume Where Applicable)
- 2.1.3 Key Market Highlights – Top Five Facts
- 2.2 Blood Pressure Monitoring Devices And Accessories Market Segmentation Snapshot
- 2.2.1 Market Split by Region – 2024 vs. 2032
- 2.3 Competitive Snapshot
- 2.3.1 Top 10 Players by Revenue Share – 2024
- 2.3.2 Top 10 Players by Volume Share – 2024 (Volume Where Applicable)
- 2.3.3 Recent Strategic Developments (18-Month Summary)
- 2.4 Key Investment Highlights & Strategic Conclusions
Chapter 3. Blood Pressure Monitoring Devices And Accessories Market Dynamics & Industry Analysis
- 3.1 Market Overview & Context
- 3.1.1 Blood Pressure Monitoring Devices And Accessories Market Position in the Broader Industry Value Chain
- 3.1.2 Demand Structure & Purchasing Dynamics
- 3.1.3 Market Maturity & Development Stage by Region
- 3.2 Blood Pressure Monitoring Devices And Accessories Market Drivers
- 3.3 Blood Pressure Monitoring Devices And Accessories Market Restraints & Challenges
- 3.4 Blood Pressure Monitoring Devices And Accessories Market Opportunities
- 3.5 Porter's Five Forces Analysis
- 3.5.1 Threat of New Entrants
- 3.5.2 Bargaining Power of Suppliers
- 3.5.3 Bargaining Power of Buyers
- 3.5.4 Threat of Substitutes
- 3.5.5 Competitive Rivalry – Intensity Assessment
- 3.6 Blood Pressure Monitoring Devices And Accessories Value Chain Analysis
- 3.6.1 Upstream – Key Inputs, Resources & Suppliers
- 3.6.1.1 Key Input/Resource 1
- 3.6.1.2 Key Input/Resource 2
- 3.6.1.3 Key Input/Resource 3
- 3.6.2 Midstream – Core Operations & Value Creation
- 3.6.2.1 Operating Model & Process Overview
- 3.6.2.2 Key Operating Locations & Capabilities by Company
- 3.6.3 Downstream – Market Channels & End Users
- 3.6.3.1 Direct Sales & Customer Engagement Channels
- 3.6.3.2 Indirect Sales, Intermediaries & Partner Channels
- 3.6.4 Value Chain Profitability Analysis
- 3.6.1 Upstream – Key Inputs, Resources & Suppliers
- 3.7 PESTEL Analysis
- 3.7.1 Political Factors
- 3.7.2 Economic Factors
- 3.7.3 Social Factors
- 3.7.4 Technological Factors
- 3.7.5 Environmental Factors
- 3.7.6 Legal Factors
- 3.8 Blood Pressure Monitoring Devices And Accessories Supply Chain Analysis
- 3.8.1 Critical Input & Resource Availability Risk Assessment
- 3.8.2 Supplier & Operational Concentration Risk (Geographic Exposure)
- 3.8.3 Supply & Service Disruption Impact Analysis
- 3.9 Regulatory & Policy Landscape
Note: The regulatory and policy landscape section covers regulations based on their applicability to the market, Blood Pressure Monitoring Devices And Accessories category, geography, and scope of the study. Only regulatory frameworks with a material impact on operations, compliance, trade, sustainability, or market access are analyzed in detail.
Chapter 4. Key Investment Pockets & Opportunity Analysis
- 4.1 Blood Pressure Monitoring Devices And Accessories Market Attractiveness Analysis
- 4.1.1 By Region – Investment Attractiveness Matrix (Market Size × CAGR)
- 4.2 Absolute Revenue Growth Opportunity
- 4.2.1 By Region – Absolute Revenue Growth Through 2032
- 4.3 Incremental Demand Opportunity
- 4.3.1 By Region – Incremental Demand Through 2032
- 4.3.2 Segment – Incremental Demand
- 4.4 Emerging Submarket Opportunity Deep Dive (Subject to Applicability)
- 4.5 Priority Market Opportunity Scorecards
- 4.5.1 United States
- 4.5.2 Europe
- 4.5.3 Asia
- 4.5.4 Middle East & Africa
Note: Priority market opportunity scorecards reflect the geographic scope and strategic relevance of the study. Listed markets are indicative and may be adapted to the industry.
Chapter 5. Blood Pressure Monitoring Devices And Accessories Cross-Border Trade & Market Access Analysis
- 5.1 International Trade & Cross-Border Activity Overview
- 5.1.1 Global Export Value by Country (2024)
- 5.1.2 Global Export Volume by Country (2024) (Volume Where Applicable)
- 5.1.3 Global Import Value by Country (2024)
- 5.1.4 Global Import Volume by Country (2024) (Volume Where Applicable)
- 5.1.5 Net Trade Balance by Country (2024)
- 5.2 Export Analysis – Segment
- 5.2.1 Category 1 (Applicable Classification Code)
- 5.2.2 Category 2 (Applicable Classification Code)
- 5.2.3 Category 3 (Applicable Classification Code)
- 5.2.4 Category 4 (Applicable Classification Code)
- 5.2.5 Category 5 (Applicable Classification Code)
- 5.3 Import Analysis – Segment
- 5.3.1 Category 1 (Applicable Classification Code)
- 5.3.2 Category 2 (Applicable Classification Code)
- 5.3.3 Category 3 (Applicable Classification Code)
- 5.3.4 Category 4 (Applicable Classification Code)
- 5.3.5 Category 5 (Applicable Classification Code)
- 5.4 Cross-Border Pricing & Transaction Benchmarks
- 5.4.1 Export Pricing – Segment & Country
- 5.4.2 Import Pricing – Segment & Source Country
- 5.4.3 Price Trends (2024)
- 5.5 Key Cross-Border Trade & Delivery Routes
- 5.5.1 Cross-Border Trade/Delivery Route 1
- 5.5.2 Cross-Border Trade/Delivery Route 2
- 5.5.3 Cross-Border Trade/Delivery Route 3
- 5.5.4 Cross-Border Trade/Delivery Route 4
- 5.5.5 Cross-Border Trade/Delivery Route 5
- 5.6 Trade Policy & Market Access Impact Assessment
- 5.6.1 Tariff & Non-Tariff Barriers
- 5.6.2 Regional Trade & Economic Integration Frameworks
- 5.6.3 Bilateral & Multilateral Trade Agreements
- 5.6.4 Cross-Border Operating, Licensing & Localization Requirements
Note: This chapter applies where cross-border trade or delivery is relevant to Blood Pressure Monitoring Devices And Accessories. Goods, services, and digital offerings are assessed using applicable classifications and transaction measures. Import-export volumes, trade balances, and route analyses are included only where meaningful to the market.
Chapter 6. Competitive Landscape & Company Benchmarking
- 6.1 Blood Pressure Monitoring Devices And Accessories Market Concentration & Structure
- 6.1.1 Herfindahl-Hirschman Index (HHI) – vs. 2024
- 6.1.2 Leading, Mid-Sized & Emerging Player Structure
- 6.1.3 Global, Regional & Local Player Dynamics
- 6.2 Blood Pressure Monitoring Devices And Accessories Market Share Analysis – 2024
- 6.2.1 Global Revenue Share by Company
- 6.2.2 Global Volume Share by Company (Volume Where Applicable)
- 6.2.3 Regional Revenue Share
- 6.2.4 Market Share Evolution ( vs. 2024)
- 6.2.5 Company Market Share by Key Segment
- 6.2.6 Company Market Share by Customer Group
- 6.3 Operating Scale, Capacity & Infrastructure Analysis
- 6.3.1 Global Operating Scale & Supply Capacity
- 6.3.2 Resource Utilization & Operating Efficiency
- 6.3.3 Output, Service Delivery & Activity Metrics
- 6.3.4 Operating Footprint & Infrastructure Map
- 6.3.5 Planned Operational & Capacity Expansion
- 6.4 Blood Pressure Monitoring Devices And Accessories Competitive Benchmarking Matrix
- 6.4.1 Revenue, Growth, Profitability & Operating Metric Comparison
- 6.4.2 Channel Revenue Mix
- 6.4.3 Geographic Revenue Exposure
- 6.4.4 R&D Intensity
- 6.4.5 Sustainability Maturity
- 6.5 Strategic Developments in Blood Pressure Monitoring Devices And Accessories (Last 24 Months)
- 6.5.1 Mergers, Acquisitions & Divestments
- 6.5.2 New Products, Services & Solutions in Blood Pressure Monitoring Devices And Accessories
- 6.5.3 Operational & Infrastructure Expansions
- 6.5.4 Strategic Alliances, Joint Ventures & Partnerships
- 6.5.5 Distribution Expansion & Market Entry
- 6.5.6 Sustainability & ESG Initiatives
- 6.6 Competitive Strategy Mapping
- 6.6.1 Leader, Challenger, Follower & Niche Classification
- 6.6.2 Pricing Strategy Comparison
- 6.6.3 Channel Strategy Matrix
Note: Strategic developments are included based on their materiality and the availability of reliable information.
Chapter 7. Global Blood Pressure Monitoring Devices And Accessories Market – By Sales & Delivery Channel
- 7.1 Segment Overview
- 7.1.1 Volume & Revenue Split by Channel (2024 & 2032) (Volume Where Applicable)
- 7.1.2 Channel Mix Evolution (2024-2032)
Chapter 8. Regional Market Analysis – Global Overview
- 8.1 Global Regional Overview
- 8.1.1 Regional Volume Share (Volume Where Applicable)
- 8.1.2 Regional Revenue Share
- 8.1.3 Regional Volume by Region (Volume Where Applicable)
- 8.1.4 Regional Revenue by Region
- 8.1.5 Regional Forecast Through 2032
- 8.2 Cross-Regional Segment Analysis
- 8.2.1 By Sales & Delivery Channel
- 8.2.2 By Competitive Positioning & Price Tier
Chapter 9. North America Blood Pressure Monitoring Devices And Accessories Market
- 9.1 United States
- 9.2 Canada
- 9.3 Mexico
Chapter 10. Europe Blood Pressure Monitoring Devices And Accessories Market
- 10.1 Germany
- 10.2 France
- 10.3 Italy
- 10.4 United Kingdom
- 10.5 Spain
- 10.6 Poland
- 10.7 Russia
- 10.8 Netherlands
- 10.9 Belgium
- 10.10 Sweden
- 10.11 Denmark
- 10.12 Norway
- 10.13 Rest of Europe
Chapter 11. Asia Pacific Blood Pressure Monitoring Devices And Accessories Market
- 11.1 China
- 11.2 India
- 11.3 Japan
- 11.4 South Korea
- 11.5 Thailand
- 11.6 Indonesia
- 11.7 Vietnam
- 11.8 Malaysia
- 11.9 Australia
- 11.10 Rest of Asia Pacific
Chapter 12. Latin America Blood Pressure Monitoring Devices And Accessories Market
- 12.1 Brazil
- 12.2 Argentina
- 12.3 Colombia
- 12.4 Chile
- 12.5 Rest of Latin America
Chapter 13. Middle East Blood Pressure Monitoring Devices And Accessories Market
- 13.1 Saudi Arabia
- 13.2 United Arab Emirates
- 13.3 Turkey
- 13.4 Israel
- 13.5 Iran
- 13.6 Rest of the Middle East
Chapter 14. Africa Blood Pressure Monitoring Devices And Accessories Market
- 14.1 South Africa
- 14.2 Egypt
- 14.3 Nigeria
- 14.4 Morocco
- 14.5 Rest of Africa
Chapter 15. Blood Pressure Monitoring Devices And Accessories Company Profiles
- 15.1 [Company 01]
- 15.1.1 Company Overview
- 15.1.2 Key Management Personnel
- 15.1.3 Products & Services Portfolio
- 15.1.4 Financial Performance
- 15.1.5 Key Market Focus & Geographic Presence
- 15.1.6 Recent Developments & Strategic Initiatives
Note: The company profile list is preliminary and may change based on research findings, market developments, data availability, and client requirements.
Chapter 16. Appendices
- Appendix A – List of Abbreviations & Acronyms
- Appendix B – Industry Classification Code Reference – Full Series
- Appendix C – Supply, Output & Operating Capacity Data Tables
- Appendix D – End-Use & Demand Base Tables
- Appendix E – Demand, Adoption & Usage Assumptions
- Appendix F – Pricing & Revenue Metric Reference Tables
- Appendix G – Company Operations & Infrastructure Database
- Appendix H – Cross-Border Trade & Activity Data Tables (Where Applicable)
- Appendix I – Regulatory Summary Tables
- Appendix J – Primary Research Participant List (Anonymized)
- Appendix K – Primary Research Questionnaire Framework
- Appendix L – Data Sources & Bibliography
- Appendix M – Market Size Divergence & Source Comparison
Chapter 17. Research Methodology
- 17.1 Research Framework & Philosophy
- 17.2 Secondary Research – Sources, Hierarchy & Data Extraction
- 17.3 Data Modeling – Bottom-Up & Top-Down Market Sizing
- 17.4 Primary Research – Stakeholder Framework, LOI & Sample Sizes
- 17.5 Forecast Methodology – Regression, Scenario & Sensitivity Analysis
- 17.6 Quality Control – Four-Layer Validation Framework
- 17.7 Limitations & Standard Assumptions
- 17.8 Disclaimer
