
Market Overview
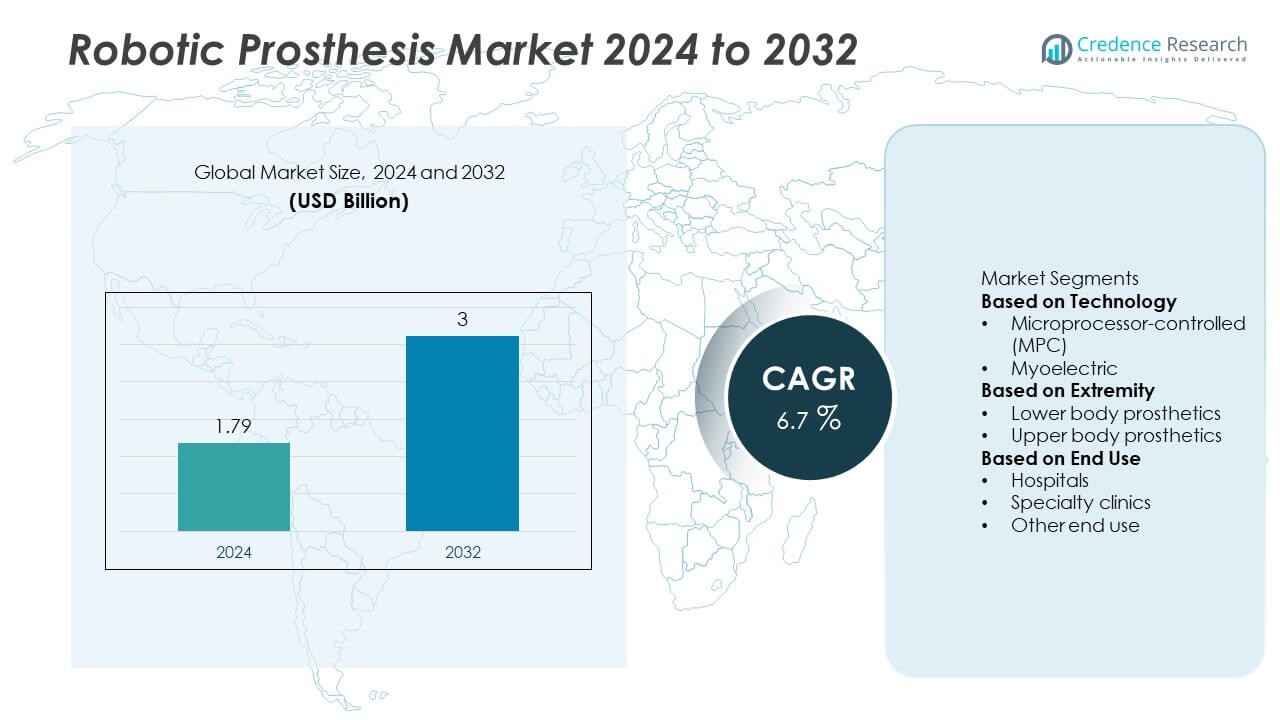
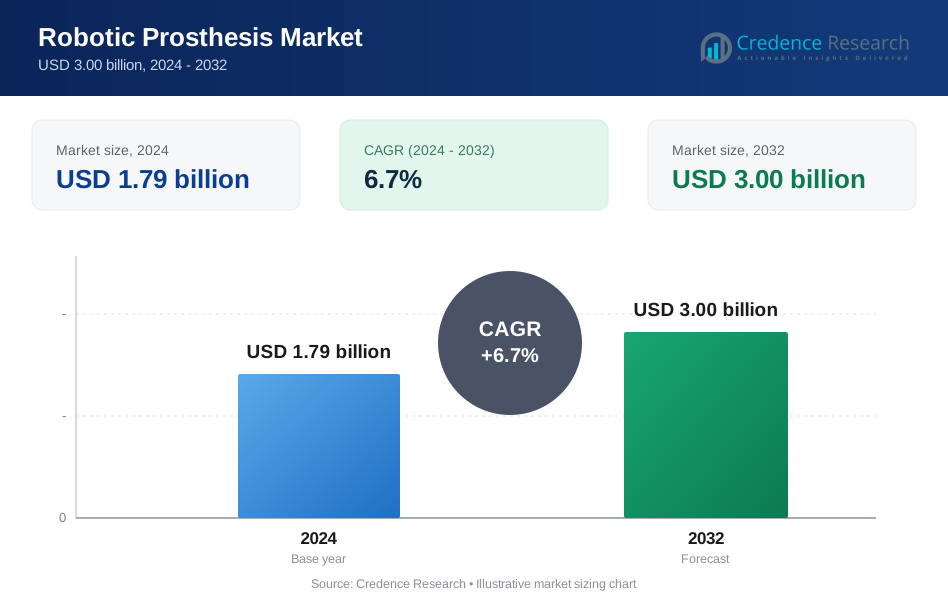
The Robotic Prosthesis market was valued at USD 1.79 billion in 2024 and is projected to reach USD 3 billion by 2032, growing at a CAGR of 6.7% during the forecast period.
| REPORT ATTRIBUTE | DETAILS |
|---|---|
| Historical Period | 2020-2023 |
| Base Year | 2024 |
| Forecast Period | 2025-2032 |
| Robotic Prosthesis market Size 2024 | USD 1.79 Billion |
| Robotic Prosthesis market, CAGR | 6.7% |
| Robotic Prosthesis market Size 2032 | USD 3 Billion |
The robotic prosthesis market is led by major players such as Brain Robotics, Fillauer LLC, Open Bionics, Myomo, Ottobock, Axile Bionics, Mobius Bionics, Blatchford Group, Motorica, and Ossur. These companies dominate through technological innovation, smart sensor integration, and AI-based motion control systems that enhance user mobility and comfort. North America led the market with a 39% share in 2024, driven by advanced healthcare infrastructure and strong research investments. Europe followed with a 29% share, supported by government-funded rehabilitation programs, while Asia-Pacific accounted for 23%, fueled by rising healthcare investments and increasing adoption of bionic technologies.
Market Insights
- The robotic prosthesis market was valued at USD 1.79 billion in 2024 and is projected to reach USD 3.00 billion by 2032, growing at a CAGR of 6.7%.
- Market growth is driven by rising cases of limb loss, increasing adoption of bionic technologies, and continuous advancements in sensor-based and AI-integrated prosthetics.
- Key trends include the development of neuro-controlled systems, lightweight material integration, and miniaturized actuators for enhanced comfort and functionality.
- The market is moderately consolidated, with companies such as Ottobock, Ossur, Myomo, and Open Bionics leading innovation through R&D, strategic partnerships, and global distribution expansion.
- North America led the market with a 39% share in 2024, followed by Europe with 29% and Asia-Pacific with 23%; among technologies, microprocessor-controlled prosthetics held a 58% share due to their adaptive motion and precision control capabilities.
Market Segmentation Analysis:
By Technology
The microprocessor-controlled (MPC) segment dominated the robotic prosthesis market with a 58% share in 2024. This dominance is driven by the ability of MPC prosthetics to provide adaptive motion, real-time adjustments, and improved stability for users. These systems utilize onboard sensors and algorithms to mimic natural limb movement, enhancing mobility and comfort. Increasing demand for intelligent and energy-efficient prosthetics in rehabilitation centers supports segment growth. Continuous R&D investments in advanced gait recognition and balance control technologies further strengthen the adoption of MPC systems worldwide.
- For instance, Ottobock developed the C-Leg 4 microprocessor-controlled knee equipped with 3,200 Hz sensor sampling frequency, allowing real-time motion adjustments on variable terrains.
By Extremity
Lower body prosthetics held the largest 63% share of the robotic prosthesis market in 2024. The segment’s growth is fueled by a high prevalence of lower limb amputations due to diabetes, vascular diseases, and trauma injuries. Advancements in knee and ankle joint mechanisms, coupled with integration of AI-based motion learning, have improved gait dynamics and user comfort. Increasing deployment of sensor-driven prosthetics for military veterans and accident survivors further accelerates demand. Manufacturers are prioritizing lightweight materials and energy recovery systems to enhance walking efficiency and endurance.
- For instance, Fillauer LLC has introduced advanced prosthetic feet, like the AllPro XTS, which features adjustable torsion and vertical shock reduction for lower limb amputees.
By End Use
Hospitals accounted for a 49% share of the robotic prosthesis market in 2024, emerging as the leading end-use segment. The growth is supported by expanding adoption of advanced rehabilitation technologies and the availability of skilled professionals for prosthetic fitting and maintenance. Hospitals are increasingly integrating robotic-assisted rehabilitation programs to improve patient outcomes. Collaborations with medical technology firms and research institutions have led to wider accessibility of smart prosthetic devices. Specialty clinics follow closely, driven by personalized patient care and increasing use of custom-designed robotic limbs for faster rehabilitation.
Key Growth Drivers
Increasing Adoption of Advanced Bionic Technologies
The growing preference for smart prosthetic systems integrated with sensors, actuators, and AI algorithms is driving market growth. These technologies enhance user comfort, motion accuracy, and responsiveness by mimicking natural limb movement. Advancements in neuroprosthetics and myoelectric control systems are helping amputees regain functional independence. Continuous R&D investments by medical device manufacturers are accelerating the commercialization of lightweight, high-performance robotic prostheses tailored for both upper and lower extremity rehabilitation needs.
- For instance, BrainCo developed an AI-driven prosthetic hand that allows users to perform customized gestures by training the device with brain waves and muscle signals, showcased at CES 2020.
Rising Incidence of Limb Amputations and Trauma Injuries
The global rise in limb loss cases due to diabetes, vascular diseases, and road accidents significantly fuels demand for robotic prostheses. Increased awareness about advanced rehabilitation solutions and government initiatives to support amputees are boosting adoption rates. Military veterans and trauma survivors are increasingly opting for robotic limbs for improved mobility and quality of life. Healthcare systems are prioritizing early prosthetic intervention programs to enhance patient recovery outcomes and reduce long-term dependency.
- For instance, Blatchford Group’s Linx integrated limb system synchronizes foot and knee sensors processing 400 inputs per second to optimize joint coordination during rehabilitation of trauma and military patients.
Growing Healthcare Investment and Rehabilitation Infrastructure
Expanding healthcare infrastructure and rising investments in rehabilitation technologies are strengthening market expansion. Hospitals and specialized prosthetic clinics are adopting robotic-assisted devices to improve therapy precision and patient outcomes. Governments and private organizations are supporting prosthetic innovation through funding and public-private partnerships. This financial support encourages the production of cost-effective and durable robotic prosthetics, especially in emerging economies. The growing presence of advanced rehabilitation centers globally continues to accelerate prosthesis adoption.
Key Trends & Opportunities
Integration of AI and Neuro-Controlled Systems
The integration of artificial intelligence and brain-computer interface technologies is transforming robotic prosthetics. These systems interpret neural signals to provide real-time control and adaptive movement, improving user experience. Manufacturers are focusing on predictive motion algorithms that allow smoother and more natural mobility. The development of AI-driven feedback mechanisms creates new opportunities for high-precision prostheses suitable for complex rehabilitation environments and long-term use.
- For instance, Mobius Bionics commercialized the LUKE Arm, originally developed by DEKA Research and Development under the U.S. DARPA program. The system features up to 10 powered joints and an intuitive control system that uses input devices such as surface EMG electrodes or foot-mounted inertial sensors to provide greater dexterity for amputees.
Miniaturization and Lightweight Material Advancements
Advancements in carbon fiber composites, lightweight alloys, and 3D printing technologies are leading to more comfortable and durable prosthetics. The shift toward compact actuators and efficient battery systems supports longer usage time and better balance. These innovations reduce fatigue and improve user confidence, especially in lower-limb prosthetics. The miniaturization trend also opens opportunities for customized prosthetic designs optimized for mobility and patient-specific ergonomics.
- For instance, Open Bionics adopted HP Multi Jet Fusion 3D printing to create the Hero Arm's robust hand and frame from tough Nylon 12, resulting in a full prosthesis that weighs less than 1 kg (2.2 lbs) while maintaining structural strength for daily wear.
Key Challenges
High Cost and Limited Accessibility
The high cost of robotic prosthetic devices remains a major barrier to widespread adoption. Integration of advanced sensors, actuators, and AI systems significantly increases production and maintenance expenses. Many low- and middle-income countries face challenges in providing affordable access to such technologies. The lack of reimbursement policies and limited healthcare coverage further restrict adoption among patients requiring long-term rehabilitation support.
Complexity in Maintenance and User Training
Robotic prostheses require regular calibration, software updates, and maintenance to ensure reliable performance. The complexity of operation and the need for user training often delay full adoption. Patients must undergo extended adaptation periods to learn proper control and coordination. Additionally, limited availability of skilled technicians and rehabilitation specialists poses operational challenges, particularly in remote healthcare facilities.
Regional Analysis
North America
North America held the largest share of 39% in the robotic prosthesis market in 2024. The region’s leadership is attributed to advanced healthcare infrastructure, early technology adoption, and strong government support for rehabilitation programs. The United States drives growth with high investment in bionic research and extensive availability of advanced prosthetic care centers. Strategic collaborations between medical device companies and research institutions promote continuous innovation. The increasing prevalence of limb amputations, coupled with favorable reimbursement frameworks, continues to boost the adoption of robotic prosthetic solutions across hospitals and specialized clinics.
Europe
Europe accounted for a 29% share of the robotic prosthesis market in 2024. Growth in this region is fueled by strong healthcare infrastructure, supportive regulatory policies, and rapid integration of robotics in rehabilitation services. Countries such as Germany, the United Kingdom, and France are leading adopters of advanced prosthetic technologies. Government-backed funding programs and insurance coverage improvements are enhancing patient accessibility. European manufacturers are also focusing on lightweight designs and AI-based control systems to improve user comfort. Continuous advancements in biomechanical engineering and clinical research further strengthen the region’s market position.
Asia-Pacific
Asia-Pacific captured a 23% share of the robotic prosthesis market in 2024. The region’s growth is driven by rising healthcare investments, growing awareness of advanced rehabilitation devices, and an increasing number of trauma-related amputations. Countries such as Japan, China, and India are investing in domestic manufacturing and technology partnerships to expand access. The rise in diabetic limb loss cases and an aging population are fueling long-term demand. Favorable government initiatives supporting affordable prosthetic development and expanding prosthetic clinics in urban centers contribute significantly to regional market expansion.
Middle East & Africa
The Middle East & Africa region accounted for a 6% share of the robotic prosthesis market in 2024. The growth is supported by government healthcare reforms, increasing investments in rehabilitation centers, and improved access to advanced prosthetic solutions. Countries such as Saudi Arabia, the United Arab Emirates, and South Africa are introducing prosthetic care programs for trauma and military amputees. The presence of international prosthetic manufacturers and training partnerships enhances regional expertise. However, high device costs and limited healthcare funding in some African nations continue to restrict widespread adoption.
Latin America
Latin America represented a 3% share of the robotic prosthesis market in 2024. The region’s expansion is driven by rising healthcare awareness, improvements in prosthetic service accessibility, and technological collaborations with international providers. Brazil and Mexico lead adoption due to ongoing healthcare modernization and government initiatives supporting rehabilitation for amputees. Increasing private investment in prosthetic clinics and the growing presence of specialized rehabilitation centers further aid growth. However, limited reimbursement frameworks and high equipment costs pose barriers, keeping adoption rates moderate compared to developed regions.
Market Segmentations:
By Technology
- Microprocessor-controlled (MPC)
- Myoelectric
By Extremity
- Lower body prosthetics
- Upper body prosthetics
By End Use
- Hospitals
- Specialty clinics
- Other end use
By Geography
- North America
- U.S.
- Canada
- Mexico
- Europe
- Germany
- France
- U.K.
- Italy
- Spain
- Rest of Europe
- Asia Pacific
- China
- Japan
- India
- South Korea
- South-east Asia
- Rest of Asia Pacific
- Latin America
- Brazil
- Argentina
- Rest of Latin America
- Middle East & Africa
- GCC Countries
- South Africa
- Rest of the Middle East and Africa
Competitive Landscape
The competitive landscape of the robotic prosthesis market is defined by key players such as Brain Robotics, Fillauer LLC, Open Bionics, Myomo, Ottobock, Axile Bionics, Mobius Bionics, Blatchford Group, Motorica, and Ossur. These companies focus on product innovation, neuro-integration, and AI-driven motion control to improve functionality and user experience. Leading manufacturers are investing in advanced sensor technologies, lightweight materials, and energy-efficient actuators to enhance mobility and comfort. Strategic partnerships with hospitals, research institutions, and rehabilitation centers are expanding market reach and clinical adoption. Continuous R&D in neural feedback systems, battery life optimization, and personalized 3D-printed designs further strengthens competitiveness. The market remains moderately consolidated, with established players prioritizing global distribution expansion, affordability, and user-centered prosthetic solutions to meet growing demand from medical and rehabilitation sectors.
Key Player Analysis
- Brain Robotics
- Fillauer LLC
- Open Bionics
- Myomo
- Ottobock
- Axile Bionics
- Mobius Bionics
- Blatchford Group
- Motorica
- Ossur
Recent Developments
- In September 2025, Fillauer LLC was named the primary U.S. distributor of Aether Biomedical’s Zeus S prosthetic hand.
- In April 2025, Össur hf. and BASF SE showcased the Pro-Flex Terra foot prosthesis, based on a three-step Cellasto® foam design for enhanced shock and energy response.
- In March 2025, Ottobock SE & Co. KGaA invested in innovative implant technologies via its subsidiary partnerships, including an implant interface aimed at enabling intuitive movement of bionic limbs.
- In 2025, Össur hf.’s powered prosthetic knee platform (POWER KNEE) was studied with an advanced control algorithm at the University of Michigan, showing improved gait symmetry and reduced user fatigue.
Report Coverage
The research report offers an in-depth analysis based on Technology, Extremity, End Use and Geography. It details leading market players, providing an overview of their business, product offerings, investments, revenue streams, and key applications. Additionally, the report includes insights into the competitive environment, SWOT analysis, current market trends, as well as the primary drivers and constraints. Furthermore, it discusses various factors that have driven market expansion in recent years. The report also explores market dynamics, regulatory scenarios, and technological advancements that are shaping the industry. It assesses the impact of external factors and global economic changes on market growth. Lastly, it provides strategic recommendations for new entrants and established companies to navigate the complexities of the market.
Future Outlook
- Demand for robotic prostheses will rise with advancements in AI and neuro-integrated systems.
- Manufacturers will focus on developing lightweight, durable, and energy-efficient prosthetic materials.
- Integration of brain-computer interfaces will enhance natural limb movement and responsiveness.
- Custom 3D-printed prosthetics will gain popularity for personalized fit and design flexibility.
- Healthcare institutions will expand rehabilitation programs using robotic-assisted prosthetic training.
- Collaboration between medical device companies and research institutes will accelerate innovation.
- Wireless connectivity and smart sensors will improve real-time motion control and feedback.
- Asia-Pacific will emerge as a major growth hub driven by expanding healthcare access.
- Increasing affordability and insurance coverage will make robotic prostheses more accessible globally.
- Continuous R&D investment will drive breakthroughs in adaptive mobility and user comfort.
Request a Free Sample
Fill in your details and we'll send you a free sample report.
- Sample data tables & charts
- Research methodology
Need a Custom Version of This Report?
Tailor the scope, geography, or segments to your exact requirements.
- Custom geography or segment scope
- Direct access to our analyst team
Frequently Asked Questions
What is the current market size for the Robotic Prosthesis market, and what is its projected size in 2032?
At what Compound Annual Growth Rate is the Robotic Prosthesis market projected to grow between 2025 and 2032?
Which Robotic Prosthesis market segment held the largest share in 2024?
What are the primary factors fueling the growth of the Robotic Prosthesis market?
Who are the leading companies in the Robotic Prosthesis market?
Which region commanded the largest share of the Robotic Prosthesis market in 2024?
Table of Content
Chapter 1. Report Introduction
- 1.1 Report Description & Purpose
- 1.1.1 Report Title & Market Definition
- 1.1.2 Unique Selling Propositions (USP) & Key Differentiators
- 1.1.3 Value Proposition for Stakeholders
- 1.2 Research Objectives
- 1.2.1 Market Sizing Objectives (Volume & Revenue)
- 1.2.2 Segmentation Objectives
- 1.2.3 Competitive Intelligence Objectives
- 1.2.4 Forecast & Scenario Objectives
- 1.3 Report Scope
- 1.3.1 Robotic Prosthesis Scope – Types & Subtypes Covered
- 1.3.2 Geographic Scope – Regions & Countries Covered
- 1.3.3 Historical Period, Base Year & Forecast Period (2024; forecast to 2032)
- 1.3.4 Inclusions & Exclusions
- 1.4 HS Code & Classification Framework
- 1.5 Currency, Units & Pricing Basis
- 1.6 Target Stakeholders
- 1.7 Limitations & Assumptions
Chapter 2. Executive Summary
- 2.1 Global Robotic Prosthesis Market Snapshot
- 2.1.1 Market Size – Historical (2024) & Forecast (2024-2032) (2024: USD 1.79 billion → 2032: USD 3.00 billion)
- 2.1.2 Volume & Revenue – Global Totals
- 2.1.3 Key Market Highlights – Top Five Facts
- 2.2 Robotic Prosthesis Market Segmentation Snapshot
- 2.2.1 Market Split by Region – 2024 vs. 2032
- 2.3 Competitive Snapshot
- 2.3.1 Top 10 Players by Revenue Share – 2024
- 2.3.2 Top 10 Players by Volume Share – 2024
- 2.3.3 Recent Strategic Developments (18-Month Summary)
- 2.4 Key Investment Highlights & Strategic Conclusions
Chapter 3. Robotic Prosthesis Market Dynamics & Industry Analysis
- 3.1 Market Overview & Context
- 3.1.1 Robotic Prosthesis Market Position in the Broader Automotive Value Chain
- 3.1.2 OEM vs. Replacement Market Dynamics
- 3.1.3 Market Maturity & Development Stage by Region
- 3.2 Robotic Prosthesis Market Drivers
- 3.3 Robotic Prosthesis Market Restraints & Challenges
- 3.4 Robotic Prosthesis Market Opportunities
- 3.5 Porter's Five Forces Analysis
- 3.5.1 Threat of New Entrants
- 3.5.2 Bargaining Power of Suppliers
- 3.5.3 Bargaining Power of Buyers
- 3.5.4 Threat of Substitutes
- 3.5.5 Competitive Rivalry – Intensity Assessment
- 3.6 Robotic Prosthesis Value Chain Analysis
- 3.6.1 Upstream – Raw Material/Input Suppliers
- 3.6.1.1 Raw Material/Input 1
- 3.6.1.2 Raw Material/Input 2
- 3.6.1.3 Raw Material/Input 3
- 3.6.2 Midstream – Production/Manufacturing/Service Delivery
- 3.6.2.1 Production/Process Overview
- 3.6.2.2 Key Facility Locations & Capacity by Manufacturer
- 3.6.3 Downstream – Distribution & End Consumer
- 3.6.3.1 Primary Channel – B2B/OEM
- 3.6.3.2 Secondary Channels – Dealer, Retail, Online, Direct
- 3.6.4 Value Chain Profitability Analysis
- 3.6.1 Upstream – Raw Material/Input Suppliers
- 3.7 PESTEL Analysis
- 3.7.1 Political Factors
- 3.7.2 Economic Factors
- 3.7.3 Social Factors
- 3.7.4 Technological Factors
- 3.7.5 Environmental Factors
- 3.7.6 Legal Factors
- 3.8 Robotic Prosthesis Supply Chain Analysis
- 3.8.1 Raw Material/Input Supply Risk Assessment
- 3.8.2 Manufacturing Concentration Risk (Geographic Exposure)
- 3.8.3 Trade Disruption Impact Analysis
- 3.9 Regulatory & Policy Landscape
Note: The regulatory and policy landscape section covers regulations based on their applicability to the market, Robotic Prosthesis category, geography, and scope of the study. Only regulatory frameworks with a material impact on operations, compliance, trade, sustainability, or market access are analyzed in detail.
Chapter 4. Key Investment Pockets & Opportunity Analysis
- 4.1 Robotic Prosthesis Market Attractiveness Analysis
- 4.1.1 By Region – Investment Attractiveness Matrix (Volume × CAGR)
- 4.2 Absolute Revenue Growth Opportunity
- 4.2.1 By Region – Absolute USD Growth Through 2032
- 4.3 Incremental Volume Opportunity
- 4.3.1 By Region – Incremental Volume Through 2032
- 4.3.2 Segment – Incremental Volume
- 4.4 Emerging Submarket Opportunity Deep Dive (Subject to Applicability)
- 4.5 Emerging Market Opportunity Scorecards
- 4.5.1 United States
- 4.5.2 Europe
- 4.5.3 Asia
- 4.5.4 Middle East & Africa
Note: Emerging Market Opportunity Scorecards will be included based on relevance and strategic importance. Regions listed are indicative and may vary depending on data availability and market dynamics.
Chapter 5. Robotic Prosthesis Import-Export Analysis & Trade Flows
- 5.1 Global Trade Overview
- 5.1.1 Global Export Value by Country (2024)
- 5.1.2 Global Export Volume by Country (2024)
- 5.1.3 Global Import Value by Country (2024)
- 5.1.4 Global Import Volume by Country (2024)
- 5.1.5 Net Trade Balance by Country (2024)
- 5.2 Export Analysis – Segment
- 5.2.1 Type 1 (HS Code)
- 5.2.2 Type 2 (HS Code)
- 5.2.3 Type 3 (HS Code)
- 5.2.4 Type 4 (HS Code)
- 5.2.5 Type 5 (HS Code)
- 5.3 Import Analysis – Segment
- 5.3.1 Type 1 (HS Code)
- 5.3.2 Type 2 (HS Code)
- 5.3.3 Type 3 (HS Code)
- 5.3.4 Type 4 (HS Code)
- 5.3.5 Type 5 (HS Code)
- 5.4 Average Unit Trade Prices
- 5.4.1 Average Export Price – Segment & Country
- 5.4.2 Average Import Price – Segment & Source Country
- 5.4.3 Price Trends (2024)
- 5.5 Key Trade Route Analysis
- 5.5.1 Trade Route 1
- 5.5.2 Trade Route 2
- 5.5.3 Trade Route 3
- 5.5.4 Trade Route 4
- 5.5.5 Trade Route 5
- 5.6 Trade Policy Impact Assessment
- 5.6.1 US Anti-Dumping & Section 301 Tariffs
- 5.6.2 EU Customs Union Impact
- 5.6.3 Major Free Trade Agreements
- 5.6.4 USMCA Rules of Origin
Note: Trade policy analysis will be included only where relevant to the Robotic Prosthesis market.
Chapter 6. Competitive Landscape & Company Benchmarking
- 6.1 Robotic Prosthesis Market Concentration & Structure
- 6.1.1 Herfindahl-Hirschman Index (HHI) – vs. 2024
- 6.1.2 Tier 1, Tier 2 & Tier 3 Market Structure
- 6.1.3 Global, Regional & Local Player Dynamics
- 6.2 Robotic Prosthesis Market Share Analysis – 2024
- 6.2.1 Global Revenue Share by Company
- 6.2.2 Global Volume Share by Company
- 6.2.3 Regional Revenue Share
- 6.2.4 Market Share Evolution ( vs. 2024)
- 6.2.5 OEM Segment Share by Company
- 6.2.6 Replacement Segment Share by Company
- 6.3 Production/Delivery Capacity & Facility Analysis
- 6.3.1 Global Installed Capacity
- 6.3.2 Capacity Utilization Rates
- 6.3.3 Production/Output Volume
- 6.3.4 Facility Locations & Capacity Map
- 6.3.5 Planned Capacity Additions
- 6.4 Robotic Prosthesis Competitive Benchmarking Matrix
- 6.4.1 Revenue, Volume, CAGR & Profitability Comparison
- 6.4.2 Channel Revenue Mix
- 6.4.3 Geographic Revenue Exposure
- 6.4.4 R&D Intensity
- 6.4.5 Sustainability Maturity
- 6.5 Strategic Developments in Robotic Prosthesis (Last 24 Months)
- 6.5.1 Mergers, Acquisitions & Divestments
- 6.5.2 New Robotic Prosthesis Launches
- 6.5.3 Facility Expansions
- 6.5.4 Strategic Alliances, Joint Ventures & Partnerships
- 6.5.5 Distribution Expansion & Market Entry
- 6.5.6 Sustainability & ESG Initiatives
- 6.6 Competitive Strategy Mapping
- 6.6.1 Leader, Challenger, Follower & Niche Classification
- 6.6.2 Pricing Strategy Comparison
- 6.6.3 Channel Strategy Matrix
Note: Strategic developments are included based on their materiality and the availability of reliable information.
Chapter 7. Global Robotic Prosthesis Market – By Distribution Channel
- 7.1 Segment Overview
- 7.1.1 Volume & Revenue Split by Channel (2024 & 2032)
- 7.1.2 Channel Mix Evolution (2024-2032)
Chapter 8. Regional Market Analysis – Global Overview
- 8.1 Global Regional Overview
- 8.1.1 Regional Volume Share
- 8.1.2 Regional Revenue Share
- 8.1.3 Regional Volume by Region
- 8.1.4 Regional Revenue by Region
- 8.1.5 Regional Forecast Through 2032
- 8.2 Cross-Regional Segment Analysis
- 8.2.1 By Distribution Channel
- 8.2.2 By Brand/Price Tier
Chapter 9. North America Robotic Prosthesis Market
- 9.1 United States
- 9.2 Canada
- 9.3 Mexico
Chapter 10. Europe Robotic Prosthesis Market
- 10.1 Germany
- 10.2 France
- 10.3 Italy
- 10.4 United Kingdom
- 10.5 Spain
- 10.6 Poland
- 10.7 Russia
- 10.8 Netherlands
- 10.9 Belgium
- 10.10 Sweden
- 10.11 Denmark
- 10.12 Norway
- 10.13 Rest of Europe
Chapter 11. Asia Pacific Robotic Prosthesis Market
- 11.1 China
- 11.2 India
- 11.3 Japan
- 11.4 South Korea
- 11.5 Thailand
- 11.6 Indonesia
- 11.7 Vietnam
- 11.8 Malaysia
- 11.9 Australia
- 11.10 Rest of Asia Pacific
Chapter 12. Latin America Robotic Prosthesis Market
- 12.1 Brazil
- 12.2 Argentina
- 12.3 Colombia
- 12.4 Chile
- 12.5 Rest of Latin America
Chapter 13. Middle East Robotic Prosthesis Market
- 13.1 Saudi Arabia
- 13.2 United Arab Emirates
- 13.3 Turkey
- 13.4 Israel
- 13.5 Iran
- 13.6 Rest of the Middle East
Chapter 14. Africa Robotic Prosthesis Market
- 14.1 South Africa
- 14.2 Egypt
- 14.3 Nigeria
- 14.4 Morocco
- 14.5 Rest of Africa
Chapter 15. Robotic Prosthesis Company Profiles
- 15.1 [Company 01]
- 15.1.1 Company Overview
- 15.1.2 Key Management Personnel
- 15.1.3 Products & Services Portfolio
- 15.1.4 Financial Performance
- 15.1.5 Key Market Focus & Geographic Presence
- 15.1.6 Recent Developments & Strategic Initiatives
Note: The company profile list is preliminary and may change based on research findings, market developments, data availability, and client requirements.
Chapter 16. Appendices
- Appendix A – List of Abbreviations & Acronyms
- Appendix B – Industry Classification Code Reference – Full Series
- Appendix C – Production & Capacity Data Tables
- Appendix D – End-Use & Demand Base Tables
- Appendix E – Consumption & Replacement Rate Assumptions
- Appendix F – ASP Reference Tables
- Appendix G – Manufacturing & Facility Database
- Appendix H – Import-Export Data Tables
- Appendix I – Regulatory Summary Tables
- Appendix J – Primary Research Participant List (Anonymized)
- Appendix K – Primary Research Questionnaire Framework
- Appendix L – Data Sources & Bibliography
- Appendix M – Market Size Divergence & Source Comparison
Chapter 17. Research Methodology
- 17.1 Research Framework & Philosophy
- 17.2 Secondary Research – Sources, Hierarchy & Data Extraction
- 17.3 Data Modeling – Bottom-Up & Top-Down Market Sizing
- 17.4 Primary Research – Stakeholder Framework, LOI & Sample Sizes
- 17.5 Forecast Methodology – Regression, Scenario & Sensitivity Analysis
- 17.6 Quality Control – Four-Layer Validation Framework
- 17.7 Limitations & Standard Assumptions
- 17.8 Disclaimer
