Market Overview:
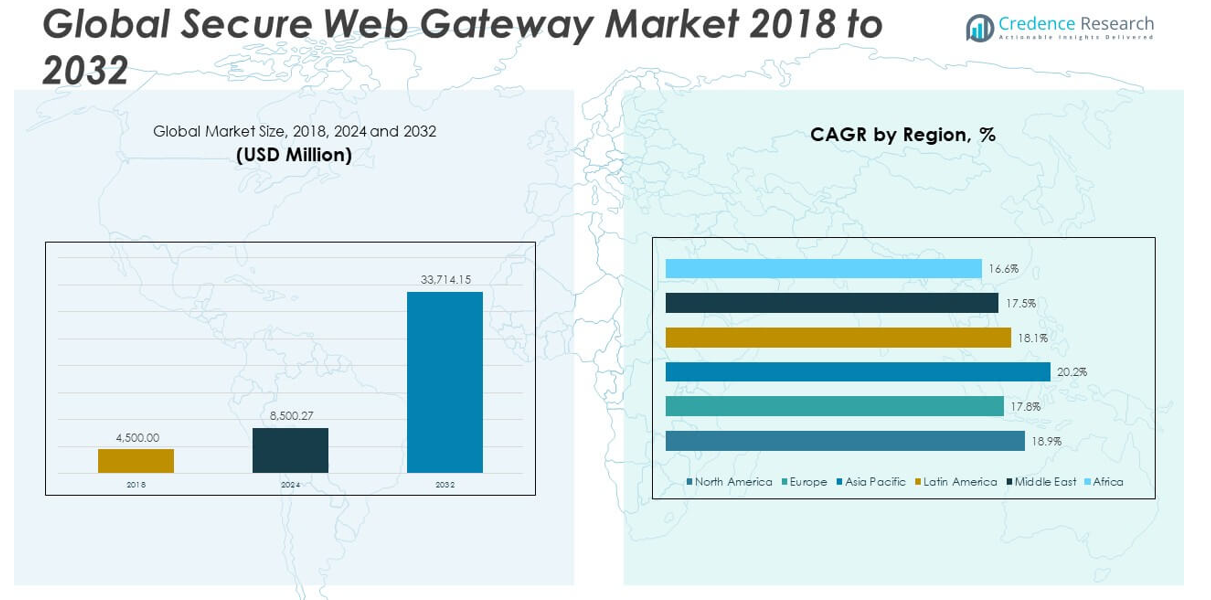
The Global Secure Web Gateway Market size was valued at USD 4,500.00 million in 2018 to USD 8,500.27 million in 2024 and is anticipated to reach USD 33,714.15 million by 2032, at a CAGR of 18.88% during the forecast period.
| REPORT ATTRIBUTE |
DETAILS |
| Historical Period |
2020-2023 |
| Base Year |
2024 |
| Forecast Period |
2025-2032 |
| Secure Web Gateway Market Size 2024 |
USD 8,500.27 million |
| Secure Web Gateway Market, CAGR |
18.88% |
| Secure Web Gateway Market Size 2032 |
USD 33,714.15 million |
Key drivers underpinning this market growth include the rising volume and sophistication of cyberattacks, especially web-based malware, ransomware, and phishing schemes that target endpoint users and cloud assets. Organizations are increasingly turning to SWG platforms to enforce security policies, prevent data leakage, and monitor encrypted traffic in real time. The widespread shift toward cloud computing, mobile workforces, and bring-your-own-device (BYOD) practices has elevated the risk surface, necessitating more advanced and scalable security frameworks. At the same time, growing regulatory compliance requirements—such as GDPR in Europe, HIPAA in the U.S., and other regional mandates—are prompting enterprises to adopt solutions capable of meeting strict data protection standards. Modern SWG platforms are also evolving to include artificial intelligence and machine learning capabilities, enabling proactive threat detection and automated response. Integration with Secure Access Service Edge (SASE) architecture and the adoption of zero-trust network access models are further reinforcing the relevance of SWG in enterprise security strategies.
Regionally, North America leads the global Secure Web Gateway market, accounting for the largest share due to high cybersecurity awareness, advanced IT infrastructure, and strict regulatory frameworks. The region’s significant investment in digital transformation and the widespread presence of cloud-first enterprises make SWG adoption a strategic necessity. Europe follows closely, driven by robust data privacy laws and strong uptake across banking, healthcare, and manufacturing sectors. The Asia-Pacific region is witnessing the fastest growth, fueled by digitalization efforts in countries like China, India, Japan, and South Korea. Expanding internet penetration, rising incidences of cybercrime, and increasing cloud adoption are creating favorable conditions for SWG vendors in the region. Meanwhile, Latin America and the Middle East & Africa are emerging as promising markets, with governments and enterprises investing in cybersecurity solutions to counteract growing digital threats and comply with evolving regulatory norms. Overall, the global Secure Web Gateway market is positioned for sustained long-term growth, supported by technological advancements, rising cyber risk exposure, and the continuous evolution of enterprise security requirements.
Market Insights:
- The Global Secure Web Gateway Market grew from USD 4,500.00 million in 2018 to USD 8,500.27 million in 2024 and is projected to reach USD 33,714.15 million by 2032, expanding at a robust CAGR of 18.88% due to rising cyber risk exposure across enterprise networks.
- The market is driven by the escalating threat landscape, with sophisticated malware, phishing attacks, and ransomware prompting organizations to adopt SWG solutions that deliver real-time content filtering, encrypted traffic inspection, and malware detection.
- The global shift to remote work, cloud platforms, and BYOD policies has expanded organizational attack surfaces, reinforcing the need for cloud-delivered SWG solutions that provide scalable, identity-aware security across distributed workforces.
- Growing compliance pressure from global regulations such as GDPR, HIPAA, and other data privacy mandates is accelerating investments in SWG platforms that can monitor and control sensitive web activity, enforce policies, and support audit readiness.
- Integration with Secure Access Service Edge (SASE), Zero Trust Network Access (ZTNA), and AI-powered threat detection tools is enhancing the functionality and appeal of modern SWG platforms within hybrid and cloud-first IT architectures.
- The market faces challenges in legacy and hybrid IT environments, where integration complexity, resource constraints, and policy inconsistency can delay SWG deployment and limit adoption among mid-sized enterprises.
- Encrypted traffic inspection presents both technical and ethical challenges, as organizations must balance security enforcement with privacy concerns and navigate regulatory restrictions that affect full-content decryption and analysis.
Access crucial information at unmatched prices!
Request your sample report today & start making informed decisions powered by Credence Research Inc.!
Download Sample
Market Drivers:
Escalating Cybersecurity Threats and Sophistication of Web-Based Attacks Fuel Adoption of Secure Web Gateway Solutions:
The rapid rise in cyber threats targeting internet-facing enterprise environments is a primary growth driver for the Global Secure Web Gateway Market. It faces heightened risk from advanced malware, phishing schemes, ransomware, and zero-day exploits, which frequently originate through compromised websites or malicious downloads. Enterprises across sectors recognize the need to block these threats at the network edge before they reach endpoints. It enables organizations to enforce real-time URL filtering, content inspection, and malware scanning to secure employee browsing activity. The increasing reliance on web-based applications and cloud-hosted platforms has expanded the attack surface, prompting investment in more proactive, gateway-level security controls. Organizations seek SWG platforms that combine deep packet inspection with AI-driven detection to counter constantly evolving threat vectors.
- For instance, Zscaler’s cloud-based Secure Web Gateway processes over 240 billion transactions daily and blocks more than 150 million threats per day, leveraging AI-driven detection and deep packet inspection to counter evolving threat vectors. The increasing reliance on web-based applications and cloud-hosted platforms has expanded the attack surface, prompting investment in more proactive, gateway-level security controls.
Widespread Shift to Remote Work and BYOD Expands Security Perimeters and Necessitates Gateway-Level Controls:
The widespread adoption of hybrid work models, mobile workforces, and bring-your-own-device (BYOD) environments has fundamentally altered enterprise security architecture. Employees accessing business systems from unsecured networks and personal devices increases vulnerability to web-based attacks and data leakage. The Global Secure Web Gateway Market is benefiting from the shift, as organizations deploy SWG solutions to maintain consistent protection regardless of user location. It supports identity-based access control and policy enforcement for remote users, delivering uniform web security across on-premise and offsite environments. Cloud-delivered SWG platforms offer centralized management and lower latency, making them ideal for dispersed teams. Enterprises require scalable, flexible solutions that adapt to decentralized operating models without compromising performance or compliance.
- For instance, Cisco Umbrella’s cloud-delivered SWG protects over 30,000 organizations and secures more than 600 billion daily internet requests, providing identity-based access control and policy enforcement for remote and BYOD users regardless of location.
Stringent Data Privacy Regulations and Compliance Mandates Accelerate Enterprise Investment in Web Security Infrastructure:
The expansion of global data protection frameworks has driven significant demand for secure web gateways. Regulations such as the General Data Protection Regulation (GDPR), Health Insurance Portability and Accountability Act (HIPAA), and other regional mandates require robust controls for monitoring, logging, and restricting web activity involving sensitive data. The Global Secure Web Gateway Market addresses these compliance needs by offering granular visibility into user behavior, encrypted traffic inspection, and policy enforcement aligned with legal obligations. It enables enterprises to prevent unauthorized data transfers and ensure audit readiness. Failure to meet compliance requirements often results in heavy fines and reputational damage, further encouraging security modernization. Industry sectors handling regulated data—such as finance, healthcare, and government—prioritize SWG deployments as part of broader governance and risk strategies.
Integration with Cloud Security Architectures and AI Enhancements Strengthens the Value Proposition of Secure Web Gateways:
Modern enterprises increasingly demand security solutions that align with their broader cloud-first and digital transformation strategies. The Global Secure Web Gateway Market is evolving in response, offering platforms integrated with Secure Access Service Edge (SASE), Zero Trust Network Access (ZTNA), and Cloud Access Security Broker (CASB) frameworks. It delivers consistent protection for both on-premises and cloud-based assets, enabling seamless user access without compromising security. Vendors are also embedding AI and machine learning capabilities into SWG platforms to enable real-time threat detection, behavior-based analytics, and automated response. These intelligent features reduce the need for manual intervention and enhance the accuracy of web traffic analysis. The move toward converged security infrastructure positions SWG as a foundational component of next-generation enterprise cybersecurity ecosystems.
Market Trends:
Adoption of Cloud-Native and API-Integrated Secure Web Gateways Is Accelerating Across Enterprises:
Organizations are increasingly shifting toward cloud-native SWG platforms that integrate seamlessly into modern IT infrastructures. These solutions offer flexible deployment, improved scalability, and reduced latency compared to traditional on-premise appliances. The Global Secure Web Gateway Market is witnessing a strong trend toward platforms that support API integrations with third-party threat intelligence, identity providers, and cloud security solutions. It enables centralized visibility and streamlined policy management across hybrid and multi-cloud environments. Enterprises favor SWGs that can be deployed as part of a service-based architecture, aligning with broader cloud transformation initiatives. This trend reflects growing expectations for SWG platforms to operate as extensible, cloud-delivered security layers rather than isolated network tools.
- For instance, Netskope’s platform integrates with over 100 technology partners and provides single-pass advanced threat and data protection with behavior anomaly detection, supporting Fortune 100 customers for over eight years.
Increasing Preference for Secure Web Gateway Functionality Within Unified SASE Frameworks:
The convergence of networking and security into unified architectures is driving integration of SWG functionalities into Secure Access Service Edge (SASE) platforms. Organizations seek holistic solutions that combine SWG with SD-WAN, CASB, ZTNA, and firewall-as-a-service in a single framework. The Global Secure Web Gateway Market is evolving to support this consolidation by embedding core gateway capabilities into cloud-delivered SASE offerings. It enables secure user access and content filtering while supporting dynamic traffic routing and access controls. This trend supports reduced infrastructure complexity, easier maintenance, and cost efficiencies. Vendors offering SWG as part of a broader SASE suite are gaining preference among large enterprises and service providers.
- For instance, Prisma Access Browser 2.0 extends SASE protection to the browser, supports BYOD and reducing reliance on legacy infrastructure, with new AI-powered security detection for advanced threats.
Emphasis on User-Centric Design and Improved Policy Customization in Web Security Platforms:
User experience is becoming a core focus for SWG platform design, with greater emphasis on adaptive access controls and context-aware policies. Enterprises are demanding tools that balance security enforcement with minimal disruption to legitimate workflows. The Global Secure Web Gateway Market is reflecting this shift through advanced user profiling, behavior analytics, and contextual decision engines that allow more nuanced policy control. It enables differentiated access rules based on identity, device, location, and risk posture. This trend promotes flexible enforcement models that accommodate varying user needs while maintaining strong security. The move toward personalized, user-aware security frameworks is redefining how organizations deploy and manage web access policies.
Increased Use of Decryption and Inspection for Encrypted Web Traffic Without Compromising Performance:
A growing share of internet traffic is encrypted, prompting organizations to prioritize deep inspection of SSL/TLS connections. The Global Secure Web Gateway Market is seeing significant innovation in this area, with vendors introducing hardware acceleration, intelligent caching, and selective decryption capabilities. It allows enterprises to maintain strong visibility into encrypted sessions while preserving user experience and network performance. Organizations are implementing policy-based inspection that targets high-risk traffic while bypassing sensitive or low-risk content. This trend supports a more efficient and targeted approach to securing encrypted communications. Enterprises now expect SWG platforms to handle decryption at scale with minimal latency or disruption to critical services.
Market Challenges Analysis:
Complex Implementation and Integration Issues Limit Deployment in Legacy and Hybrid Environments:
Organizations operating with legacy infrastructure often face difficulties integrating modern Secure Web Gateway solutions into their existing environments. The Global Secure Web Gateway Market must contend with technical challenges related to compatibility, resource limitations, and fragmented security architectures. It requires significant configuration and coordination with identity management systems, proxy servers, and threat intelligence feeds to function effectively. Enterprises with hybrid or multi-cloud environments may struggle to maintain consistent policy enforcement and user experience across distributed networks. Deployment complexity can lead to extended implementation timelines and increased reliance on skilled IT personnel. These obstacles can delay adoption and limit scalability, especially for mid-sized organizations lacking mature security teams.
Privacy Concerns and Decryption Constraints Challenge Deep Packet Inspection Capabilities:
Encrypted web traffic accounts for the majority of internet usage, but decrypting this traffic for inspection raises legal, ethical, and operational concerns. The Global Secure Web Gateway Market faces resistance from organizations that prioritize end-user privacy or must comply with data protection laws prohibiting full-content inspection. It becomes difficult for enterprises to balance security needs with privacy expectations, especially in regions with strict compliance regulations. Resource-intensive decryption processes can also impact network performance and introduce latency, which users may perceive as a service degradation. Organizations often adopt selective decryption strategies, which can leave gaps in visibility and reduce threat detection accuracy. These challenges make it harder for vendors to offer one-size-fits-all solutions that meet both compliance and performance demands.
Market Opportunities:
Rising Demand from Small and Medium Enterprises Unlocks New Growth Potential for Web Security Vendors:
Small and medium-sized enterprises (SMEs) are increasingly prioritizing cybersecurity as they expand digital operations and adopt cloud services. The Global Secure Web Gateway Market can capitalize on this shift by offering scalable, cost-effective, and easy-to-deploy solutions tailored to SME requirements. It enables vendors to address a growing segment that often lacks dedicated security infrastructure. Simplified cloud-based SWG platforms with automated policy enforcement and intuitive management tools appeal to businesses with limited IT resources. With rising cyberattacks targeting smaller firms, demand for accessible gateway protection is increasing. Vendors that lower deployment complexity and pricing barriers stand to gain from strong SME adoption rates.
Expansion in Emerging Economies Creates Pathways for Market Penetration and Localization Strategies:
Developing regions across Asia-Pacific, Latin America, and Africa present significant growth opportunities due to expanding internet access, digital transformation initiatives, and rising cyber risk awareness. The Global Secure Web Gateway Market can benefit from localized offerings that align with regional regulations, language preferences, and infrastructure maturity. It supports tailored go-to-market strategies that include partnerships with local system integrators and managed service providers. Governments and enterprises in these markets are investing in cybersecurity to protect public services and economic assets. Vendors that address specific regional challenges, such as bandwidth constraints and data sovereignty, can establish early footholds and build long-term market share.
Market Segmentation Analysis:
By Component
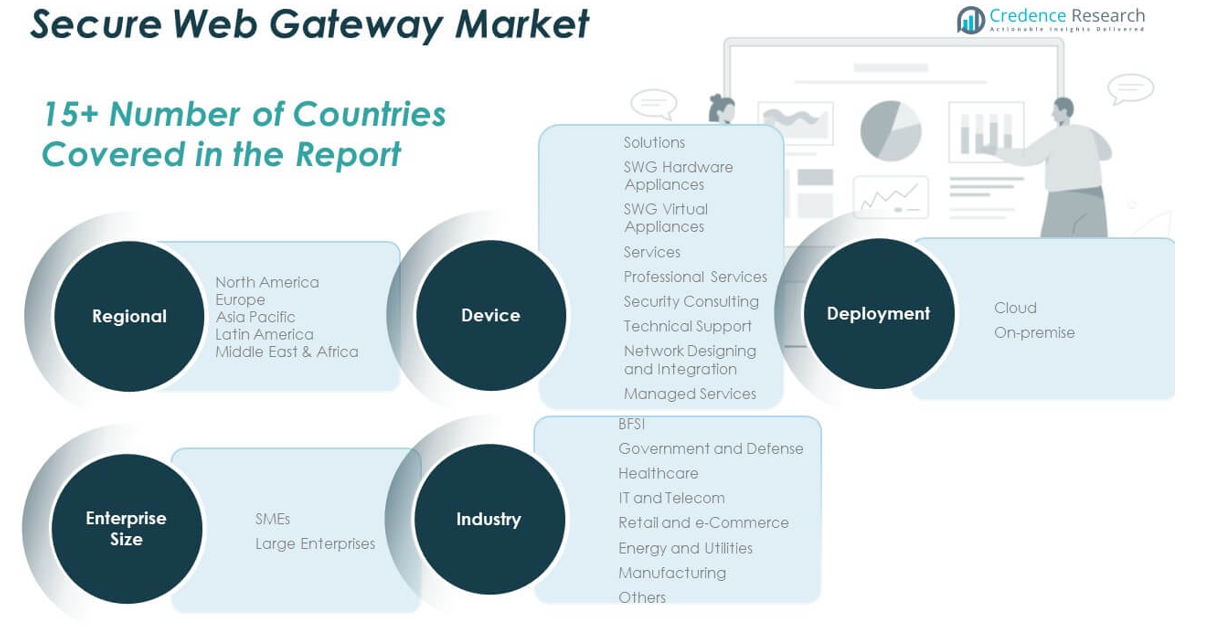
The Global Secure Web Gateway Market is segmented into solutions and services. Solutions include SWG hardware appliances and SWG virtual appliances, which enable organizations to enforce secure browsing and content control. Services encompass professional services, security consulting, technical support, network designing and integration, and managed services. These services play a crucial role in deployment, configuration, and ongoing management of SWG systems across enterprise environments.
- For instance, Forcepoint ONE SWG offers a distributed architecture with over 300 points of presence worldwide and 99.99% uptime since 2015. It provides unified management, data-in-motion scanning, and granular web access controls for managed and unmanaged devices.
By Deployment
Deployment models include cloud and on-premise solutions. Cloud-based deployment is gaining strong traction due to its scalability, rapid provisioning, and suitability for distributed workforces. It allows centralized management and is ideal for organizations adopting hybrid or remote work models. On-premise deployment remains critical for enterprises with strict data residency requirements or those operating within highly regulated industries.
- For instance, On-premise deployment remains important for organizations with strict data residency or regulatory requirements, with solutions like McAfee Web Gateway and Forcepoint SWG supporting granular policy controls and compliance for sensitive environments.
By Enterprise Size
The market serves both large enterprises and SMEs. Large enterprises lead in adoption due to broader infrastructure, complex compliance needs, and higher exposure to cyber risks. SMEs are increasingly embracing cloud-based SWG solutions for their affordability, simplified management, and essential protection against web-based threats.
By Industry
Key industries in the market include BFSI, government and defence, healthcare, IT and telecom, retail and e-commerce, energy and utilities, manufacturing, and others. BFSI and healthcare prioritize data integrity and regulatory compliance. IT and telecom require scalable protection for dynamic infrastructure, while manufacturing and retail sectors seek to prevent data leakage and safeguard operational networks. The Global Secure Web Gateway Market aligns with the specific security demands of these industries through tailored solutions and services.
Segmentation:
By Component
- Solutions
- SWG Hardware Appliances
- SWG Virtual Appliances
- Services
- Professional Services
- Security Consulting
- Technical Support
- Network Designing and Integration
- Managed Services
By Deployment
By Enterprise Size
By Industry
- BFSI
- Government and Defence
- Healthcare
- IT and Telecom
- Retail and e-Commerce
- Energy and Utilities
- Manufacturing
- Others
By Region
- North America
- Europe
- Germany
- France
- U.K.
- Italy
- Spain
- Rest of Europe
- Asia Pacific
- China
- Japan
- India
- South Korea
- South-east Asia
- Rest of Asia Pacific
- Latin America
- Brazil
- Argentina
- Rest of Latin America
- Middle East & Africa
- GCC Countries
- South Africa
- Rest of the Middle East and Africa
Regional Analysis:
North America
The North America Secure Web Gateway Market size was valued at USD 1,675.35 million in 2018 to USD 3,127.20 million in 2024 and is anticipated to reach USD 12,386.64 million by 2032, at a CAGR of 18.9% during the forecast period. North America leads the Global Secure Web Gateway Market, supported by advanced cybersecurity infrastructure, high regulatory compliance requirements, and widespread cloud adoption. Enterprises in the U.S. and Canada prioritize real-time web threat protection due to the region’s high exposure to ransomware, phishing, and advanced persistent threats. Strong presence of major vendors and early adoption of cloud-native security solutions drive regional dominance. The region also benefits from mature digital transformation strategies across sectors like finance, healthcare, and government. It maintains a strong market position through continual investments in AI-based threat detection and integration with secure access service edge (SASE) architectures.
Europe
The Europe Secure Web Gateway Market size was valued at USD 904.50 million in 2018 to USD 1,621.62 million in 2024 and is anticipated to reach USD 5,959.07 million by 2032, at a CAGR of 17.8% during the forecast period. Europe holds a significant share in the Global Secure Web Gateway Market, driven by stringent data protection laws such as GDPR and sector-specific regulations. Organizations across the region are adopting SWG solutions to protect against evolving cyber threats while ensuring compliance. Countries like Germany, the UK, and France are leading in terms of cybersecurity readiness and digital security spending. The rise in cloud adoption across banking, manufacturing, and telecom is contributing to growing demand for advanced web gateway controls. It supports proactive web filtering and secure browsing across public and private sector networks. European enterprises favor privacy-respecting solutions that balance performance with regulatory obligations.
Asia Pacific
The Asia Pacific Secure Web Gateway Market size was valued at USD 1,206.00 million in 2018 to USD 2,370.27 million in 2024 and is anticipated to reach USD 10,292.96 million by 2032, at a CAGR of 20.2% during the forecast period. Asia Pacific is the fastest-growing region in the Global Secure Web Gateway Market. Rapid digitalization, expanding internet user base, and rising instances of cybercrime are key drivers of market growth. Countries such as China, India, Japan, and South Korea are witnessing a surge in cloud-based deployments and demand for real-time threat protection. Enterprises in the region are integrating SWG solutions into broader zero-trust security frameworks to secure remote workforces and cloud-hosted assets. The growing presence of regional cybersecurity vendors and government-backed cyber initiatives strengthens market maturity. It is evolving into a strategic growth hub for global vendors targeting enterprise-level deployments.
Latin America
The Latin America Secure Web Gateway Market size was valued at USD 409.50 million in 2018 to USD 768.34 million in 2024 and is anticipated to reach USD 2,895.03 million by 2032, at a CAGR of 18.1% during the forecast period. Latin America is emerging as a promising region within the Global Secure Web Gateway Market. Growing awareness of cyber threats and rising digitalization across banking, retail, and public sectors are fueling demand. Brazil and Mexico are at the forefront, showing increased investment in secure cloud access and web threat protection tools. Regional enterprises are adopting cloud-based SWG solutions for affordability and flexibility. It benefits from gradual policy improvements and collaboration with international cybersecurity bodies. The market remains underpenetrated, offering growth potential for vendors targeting mid-sized businesses and government agencies.
Middle East
The Middle East Secure Web Gateway Market size was valued at USD 184.50 million in 2018 to USD 328.06 million in 2024 and is anticipated to reach USD 1,183.55 million by 2032, at a CAGR of 17.5% during the forecast period. The Middle East Secure Web Gateway Market is gaining momentum, supported by national cybersecurity agendas and increasing cloud adoption. Countries like the UAE, Saudi Arabia, and Israel are driving demand through large-scale digital initiatives and regulatory modernization. Enterprises across finance, energy, and defense sectors seek SWG platforms to mitigate risks from advanced threats. Cloud-hosted solutions are gaining traction due to flexibility and centralized control. It is experiencing rising demand for encrypted traffic inspection and identity-based access control. The market is steadily expanding, though it still faces challenges related to legacy infrastructure and skill shortages.
Africa
The Africa Secure Web Gateway Market size was valued at USD 120.15 million in 2018 to USD 284.79 million in 2024 and is anticipated to reach USD 996.90 million by 2032, at a CAGR of 16.6% during the forecast period. Africa holds a smaller share of the Global Secure Web Gateway Market but is showing consistent growth. Rising internet usage, digital transformation efforts, and cyberattack incidents are prompting investments in security infrastructure. South Africa, Nigeria, and Egypt are key markets advancing cybersecurity readiness. Cloud-based SWG solutions are preferred for their cost-effectiveness and ease of deployment. It sees increasing adoption across financial services, telecom, and education sectors. The market is developing, with opportunities tied to expanding broadband access and government-led digital policy frameworks.
Shape Your Report to Specific Countries or Regions & Enjoy 30% Off!
Key Player Analysis:
- NortonLifeLock Inc.
- Zscaler (US)
- Cisco Systems (US)
- Check Point Software Technologies (Israel)
- Sophos (UK)
- Forcepoint (US)
- Trend Micro (Japan)
- Comodo (US)
- McAfee (US)
- Thoma Bravo (Barracuda Networks) (US)
- NetSkope (US)
- A10 Networks (US)
- Cyren (Israel)
- Sangfor Technologies (China)
- CATO Networks (Israel)
- Contentkeeper (Australia)
- iboss (US)
- Menlo Security (US)
- F5 Networks, Inc. (US)
- Citrix (US)
Competitive Analysis:
The Global Secure Web Gateway Market is highly competitive, with leading vendors focusing on innovation, integration, and cloud-based delivery models. Key players such as Cisco Systems, Zscaler, Broadcom, Forcepoint, Palo Alto Networks, and iboss dominate the market through robust product portfolios and global distribution networks. It reflects a shift toward comprehensive platforms that combine SWG functionality with broader security frameworks like SASE and Zero Trust. Companies differentiate through advanced threat detection, AI-based traffic analysis, and seamless user experience across hybrid environments. Strategic mergers, acquisitions, and partnerships enhance market presence and accelerate technological advancement. New entrants and niche providers target specific segments such as SMEs or region-specific compliance needs. The market favors vendors that deliver scalable, cost-efficient solutions with strong cloud performance and centralized policy management. Competitive intensity continues to rise, pushing providers to continuously upgrade features, ensure regulatory alignment, and support increasingly decentralized enterprise networks.
Recent Developments:
- In June 2025, Zscaler announced a series of product updates at its Zenith Live 2025 event, focusing on expanding zero-trust and AI capabilities across cloud and branch environments. Key launches include the Zero Trust Branch appliance, which eliminates the need for legacy firewalls in distributed offices, and the Zero Trust Gateway for cloud workload protection. Zscaler also introduced AI-powered data classification across more than 200 sensitive data types, new controls for generative AI tools, and host-based microsegmentation for cloud and on-premises workloads. Additionally, Zscaler announced the acquisition of Red Canary to enhance its managed detection and response (MDR) services and AI technology.
- In June 2025, Sophos released important updates to its Zero Trust Network Access (ZTNA) solution, enhancing deployment ease and performance. The latest ZTNA Gateway release introduced features such as inactivity timeout settings for tunnels, auto-renewal support for Let’s Encrypt certificates, and expanded central management to new regions including Australia, Brazil, India, Japan, and Canada. These updates are designed to improve secure access and management for both cloud and on-premises deployments.
- In May 2025, Check Point Software Technologies launched the next-generation Quantum Smart-1 Management Appliances, featuring AI-powered security tools for advanced threat prevention and management. At CPX 2025, the company’s new CEO outlined a strategy focused on AI innovation, cloud security, and Secure Access Service Edge (SASE) integration. Check Point continues to protect over 100,000 organizations globally through its Infinity Platform and has been recognized as one of America’s best cybersecurity companies in 2025.
- In January 2025, Cisco updated its Secure Access Status Portal, enhancing the portal’s layout and introducing new capabilities for customers to subscribe to specific services and regions, improving notification management. In February 2025, Cisco released software updates to address vulnerabilities in its Secure Email and Web Gateway products, including fixes for command injection and privilege escalation vulnerabilities. These updates are part of Cisco’s ongoing efforts to maintain security and compliance for its web gateway solutions.
- In February 2025, NortonLifeLock launched enhanced AI-powered scam protection across its Cyber Safety product lineup. The new Genie Scam Protection and Genie Scam Protection Pro features are now integrated into Norton’s products, providing advanced AI-driven defense against scams in texts, phone calls, emails, and web browsing. These updates aim to address the surge in social engineering threats, which Norton reports now account for 90% of all cyberthreats. The Genie AI analyzes the meaning of words, not just links, to detect hidden scam patterns, and the top-tier Norton 360 with LifeLock Ultimate Plus plan now includes scam support and reimbursement coverage for victims.
Market Concentration & Characteristics:
The Global Secure Web Gateway Market exhibits moderate concentration, led by a core group of multinational vendors that offer comprehensive, cloud-delivered solutions. It reflects strong demand for integrated security features, including threat intelligence, data loss prevention, and encrypted traffic inspection. The market is characterized by rapid innovation, with vendors integrating artificial intelligence, zero-trust frameworks, and API-based extensibility. It supports both large enterprises and mid-sized organizations, driven by growing remote workforces and regulatory pressure. Customers prioritize platforms that deliver high availability, centralized policy control, and seamless user experience across distributed environments. The market favors providers that can scale globally while offering region-specific compliance and deployment flexibility. It continues to evolve toward unified architectures that combine secure web gateway functions with broader security-as-a-service offerings.
Report Coverage:
The research report offers an in-depth analysis based on component, deployment, enterprise size, and industry. It details leading market players, providing an overview of their business, product offerings, investments, revenue streams, and key applications. Additionally, the report includes insights into the competitive environment, SWOT analysis, current market trends, as well as the primary drivers and constraints. Furthermore, it discusses various factors that have driven market expansion in recent years. The report also explores market dynamics, regulatory scenarios, and technological advancements that are shaping the industry. It assesses the impact of external factors and global economic changes on market growth. Lastly, it provides strategic recommendations for new entrants and established companies to navigate the complexities of the market.
Future Outlook:
- The Global Secure Web Gateway Market will continue expanding with increasing reliance on cloud applications and remote work environments.
- Integration with SASE and Zero Trust architectures will drive adoption among enterprises seeking unified security solutions.
- AI-driven threat detection and behavioral analytics will become standard features across competitive offerings.
- Demand for SSL/TLS inspection capabilities will rise as encrypted web traffic becomes the default.
- SMEs will emerge as a key growth segment due to rising awareness and availability of affordable cloud-based solutions.
- Emerging markets in Asia-Pacific, Latin America, and Africa will see accelerated deployment backed by digital transformation initiatives.
- Vendor consolidation is likely as large cybersecurity firms acquire niche players to enhance SWG portfolios.
- Regulatory compliance requirements will push more organizations to implement centralized web access controls.
- Partnerships with managed security service providers (MSSPs) will help vendors penetrate mid-tier markets.
- Ongoing innovation in policy customization, user experience, and performance optimization will shape next-generation SWG platforms.


