Market Overview
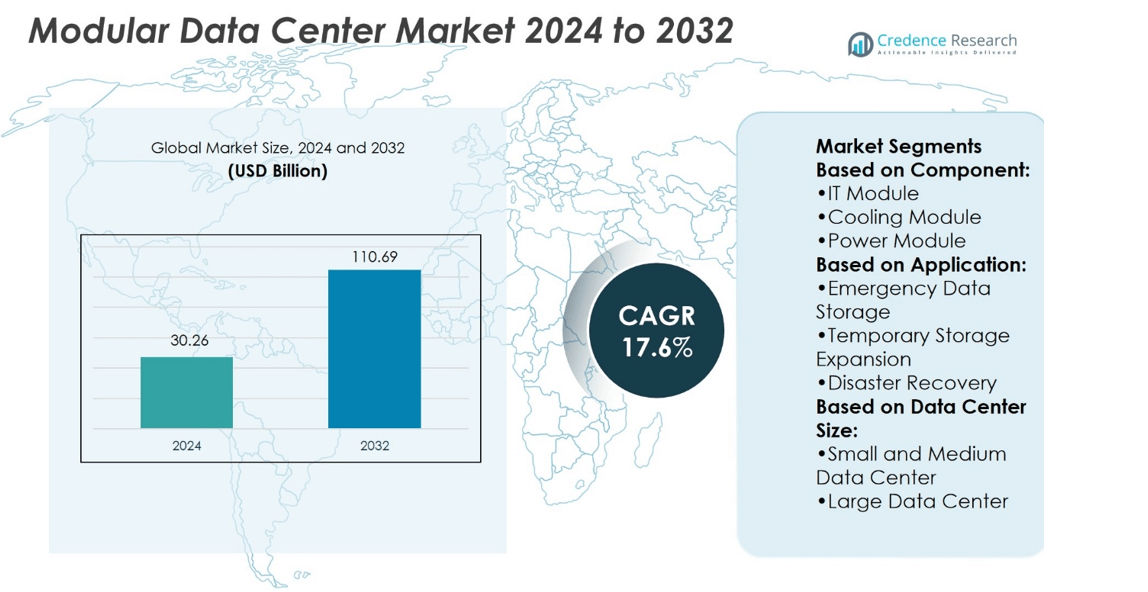
Modular Data Center Market size was valued at USD 30.26 billion in 2024 and is anticipated to reach USD 110.69 billion by 2032, at a CAGR of 17.6% during the forecast period.
| REPORT ATTRIBUTE |
DETAILS |
| Historical Period |
2020-2023 |
| Base Year |
2024 |
| Forecast Period |
2025-2032 |
| Modular Data Center Market Size 2024 |
USD 30.26 billion |
| Modular Data Center Market, CAGR |
17.6% |
| Modular Data Center Market Size 2032 |
USD 110.69 billion |
The Modular Data Center Market grows through strong drivers and evolving technology trends. Rising demand for scalable and flexible IT infrastructure fuels widespread adoption across enterprises and service providers. It enables rapid deployment, cost efficiency, and adaptability to fluctuating workloads. Edge computing and IoT expansion further strengthen the need for compact, distributed modular facilities. Sustainability goals drive interest in energy-efficient designs, advanced cooling systems, and renewable integration. Hybrid and multi-cloud strategies create opportunities for modular solutions that support interoperability. Vendors focus on prefabricated modules, AI-driven monitoring, and automation to improve efficiency, reduce downtime, and deliver faster market responsiveness.
North America holds the largest share of the Modular Data Center Market, supported by strong cloud adoption and edge infrastructure growth. Europe follows with demand driven by strict data regulations and sustainable designs, while Asia-Pacific records the fastest expansion through digital transformation in China and India. Latin America and the Middle East & Africa show steady progress with rising telecom and banking investments. Key players driving competition include Huawei Technologies, Dell Technologies, IBM Corporation, Hewlett Packard Enterprise, Schneider Electric, and Vertiv Group.
Market Insights
- The Modular Data Center Market was valued at USD 30.26 billion in 2024 and will reach USD 110.69 billion by 2032 at a CAGR of 17.6%.
- Rising demand for scalable and flexible IT infrastructure drives strong adoption.
- Key trends include rapid deployment, edge computing growth, and IoT expansion.
- Vendors focus on prefabricated modules, AI-driven monitoring, and automation for efficiency.
- Restraints include high initial investment and integration challenges across legacy systems.
- North America leads due to cloud and edge infrastructure, while Asia-Pacific records fastest growth.
- Competition is shaped by players such as Huawei, Dell Technologies, IBM, HPE, Schneider Electric, and Vertiv.
Access crucial information at unmatched prices!
Request your sample report today & start making informed decisions powered by Credence Research Inc.!
Download Sample
Market Drivers
Rising Demand for Scalable and Flexible IT Infrastructure
The growing need for scalable IT capacity drives adoption in the Modular Data Center Market. Enterprises prioritize modular systems because they expand capacity in phases without major disruption. It helps organizations respond to fluctuating workloads and digital transformation requirements. Cloud service providers deploy modular centers to quickly support new regions. Governments and telecom firms prefer modular facilities for critical data handling. This flexibility strengthens operational resilience while lowering risks tied to overbuilding.
- For instance, Cannon Technologies offers a repeatable modular design with an initial 64.46 m² footprint that supports 16 IT racks, each delivering up to 6 kW of IT capacity.
Increasing Adoption of Edge Computing and IoT Applications
The expansion of IoT devices and edge computing accelerates demand for modular data centers. Organizations require distributed infrastructure that processes data near the source. It reduces latency, improves performance, and supports applications in healthcare, manufacturing, and smart cities. Modular setups deploy faster at remote sites than traditional builds. Service providers rely on modular systems to handle real-time analytics efficiently. This trend underpins the growing market relevance of modular solutions.
- For instance, Dell’s Micro 415 modular enclosure offers an integrated setup—including IT, power, cooling, and remote management—in a unit shorter and narrower than a car parking spot. This rugged unit withstands extreme temperatures, with flexible enclosures featuring key‑lock doors and options for smoke detection and fire suppression—built for remote, demanding conditions.
Focus on Energy Efficiency and Sustainability Initiatives
Sustainability goals push enterprises to adopt energy-efficient designs in the Modular Data Center Market. Companies face stricter environmental regulations and rising energy costs. It compels operators to use advanced cooling, renewable power integration, and efficient UPS systems. Vendors highlight modular units with optimized airflow and power usage effectiveness. Sustainable designs appeal to investors seeking long-term value and lower operating expenses. Green certifications further strengthen the appeal of modular deployments across industries.
Rising Investments from Cloud and Colocation Providers
Cloud and colocation providers play a central role in market growth. They invest heavily in modular data centers to accelerate deployment cycles. It ensures rapid service availability in high-demand locations. Modular facilities reduce construction timelines from years to months, offering faster revenue realization. Providers also use modular strategies to diversify geographically and strengthen redundancy. These investments confirm the strategic importance of modular data centers in the evolving IT landscape.
Market Trends
Growing Integration of Artificial Intelligence and Automation in Modular Systems
The Modular Data Center Market shows a strong trend toward automation and AI integration. Operators deploy intelligent monitoring systems that predict equipment failures and optimize energy use. It supports predictive maintenance, reducing downtime and extending equipment life cycles. Automated controls manage cooling, power, and security with higher efficiency. Vendors invest in AI-driven tools that enhance workload management across distributed sites. This trend improves operational accuracy while lowering total cost of ownership.
- For instance, the rack enclosures in SmartRack house up to 44U of equipment and pair with in-row precision cooling units rated at either 12 kW or 25 kW. These units include remote monitoring via a built-in NIC, compatible with Eaton’s Brightlayer Data Centers suite for real-time oversight of cooling, UPS, and PDU systems.
Rising Popularity of Prefabricated and Containerized Solutions
Prefabricated and containerized designs gain traction among enterprises and service providers. The Modular Data Center Market benefits from faster deployment cycles supported by off-site manufacturing. It shortens project timelines and ensures consistent quality across multiple facilities. Containerized modules also simplify transport and installation at remote or temporary sites. Standardized units allow easy scaling of capacity in small increments. This shift creates strong momentum for prefabricated systems worldwide.
- For instance, IE Corp.’s Edge XA Series of modular data centers supports up to 600 kW of critical IT power and cooling. The number of cabinets and total capacity are dependent on the specific configuration.
Emphasis on Hybrid Cloud and Multi-Cloud Strategies
The adoption of hybrid and multi-cloud strategies influences infrastructure design choices. Enterprises use modular data centers to balance private and public cloud workloads. It delivers flexibility by hosting sensitive data locally while linking to public platforms. Providers build modular sites to support interoperability between different cloud vendors. Modular designs align with demand for secure, scalable, and agile environments. This alignment reinforces modular facilities as a key component of cloud transformation.
Increasing Deployment in Emerging Markets and Remote Regions
Deployment activity is expanding in emerging economies and underserved regions. The Modular Data Center Market supports digital growth in areas lacking traditional infrastructure. It enables quick establishment of data services for banking, education, and government sectors. Telecom providers deploy modular units to extend connectivity into rural and remote zones. Enterprises in developing regions use modular setups to bypass costly traditional builds. This geographic spread highlights the adaptability of modular data centers worldwide.
Market Challenges Analysis
High Capital Costs and Complex Integration with Legacy Infrastructure
The Modular Data Center Market faces challenges linked to upfront investment requirements. Enterprises must allocate significant budgets for prefabricated modules, advanced cooling, and power systems. It creates barriers for small and mid-sized businesses with limited financial resources. Integration with legacy IT infrastructure also complicates deployment. Older systems may lack compatibility with modular designs, requiring costly customization. Vendors must address these issues to encourage broader adoption. Financial constraints and integration hurdles slow down growth despite strong demand.
Security Concerns and Limited Technical Expertise in Emerging Regions
Security risks remain a significant concern for operators adopting modular facilities. The Modular Data Center Market includes deployments in remote and emerging regions with limited regulatory frameworks. It exposes systems to cyberattacks, power instability, and weak disaster recovery measures. Shortages of skilled personnel create further obstacles to efficient operation. Organizations may struggle to maintain and secure advanced modular systems without expert support. Vendors and governments must invest in training and awareness programs. These gaps in expertise and security readiness limit the market’s full potential.
Market Opportunities
Expansion of 5G Networks and Edge Computing Applications
The growth of 5G networks creates strong opportunities for modular deployments. The Modular Data Center Market benefits from rising demand for low-latency processing near end users. It enables telecom operators to install compact modules at cell sites and regional hubs. Edge computing applications in autonomous vehicles, healthcare, and manufacturing depend on this capability. Modular facilities shorten deployment cycles and adapt quickly to evolving network demands. Vendors offering pre-engineered and scalable modules gain a competitive edge in supporting 5G expansion.
Rising Focus on Sustainable and Green Infrastructure Solutions
Sustainability initiatives open new avenues for modular system providers. The Modular Data Center Market sees increasing investment in eco-friendly designs that lower energy consumption. It aligns with corporate ESG goals and global emission reduction targets. Advanced cooling methods, renewable energy integration, and efficient power usage effectiveness drive adoption. Governments encourage sustainable builds through incentives and stricter compliance requirements. Companies delivering green-certified modular facilities strengthen their market position while addressing environmental priorities.
Market Segmentation Analysis:
By Component
The Modular Data Center Market divides into function module solutions and services. Function module solutions include all-in-one and individual setups that address varied enterprise needs. IT modules dominate with demand for scalable computing resources, while cooling modules hold strong relevance due to energy efficiency requirements. Power modules support high-density loads and ensure continuity during outages. Others, such as electrical modules, provide flexibility for site-specific needs. It shows steady adoption as enterprises seek modular systems that align with rapid deployment goals. Services complement these modules by offering integration, maintenance, and lifecycle support, strengthening long-term operations.
- For instance,The PCX FLX-MDC™ prefabricated modular data center is characterized by its integration of IT, power, mechanical, and electrical systems within a single, streamlined footprint. These ready-built units are designed for rapid deployment, achieving operational status in approximately 30% less time compared to traditional data center construction methods.
By Application
Applications span emergency data storage, temporary storage expansion, disaster recovery, edge computing, and other use cases. Emergency data storage drives uptake in industries with critical data demands. Temporary storage expansion helps enterprises manage seasonal or project-based workload peaks. Disaster recovery remains a strong driver, with modular units providing quick restoration after system failures. Edge computing shows the fastest momentum as industries rely on real-time processing. It demonstrates strong alignment with telecom and IoT growth. Other applications include capacity expansion and support for new business ventures, reflecting broad flexibility of modular deployments.
- For instance, RiMatrix Data Center Container, which comes in configurations delivering 50 kW, 60 kW, or 200 kW total IT output. For the 200 kW variant, each rack can handle up to 20 kW with n+1 cooling and 2N power redundancy. These units are factory-tested and ready to connect.
By Data Center Size
Segmentation by size highlights demand across small and medium data centers and large facilities. Small and medium centers adopt modular units for cost efficiency and scalability. Enterprises in developing markets prefer compact modules to bypass traditional high-cost construction. Large data centers embrace modular designs to accelerate deployment cycles across multiple regions. It ensures greater flexibility while supporting hybrid and multi-cloud strategies. This segment also benefits from advanced module integration for power and cooling. Both categories highlight the adaptability of modular systems to varying enterprise requirements and budgets.
Segments:
Based on Component:
- IT Module
- Cooling Module
- Power Module
Based on Application:
- Emergency Data Storage
- Temporary Storage Expansion
- Disaster Recovery
Based on Data Center Size:
- Small and Medium Data Center
- Large Data Center
Based on the Geography:
- North America
- Europe
- UK
- France
- Germany
- Italy
- Spain
- Russia
- Belgium
- Netherlands
- Austria
- Sweden
- Poland
- Denmark
- Switzerland
- Rest of Europe
- Asia Pacific
- China
- Japan
- South Korea
- India
- Australia
- Thailand
- Indonesia
- Vietnam
- Malaysia
- Philippines
- Taiwan
- Rest of Asia Pacific
- Latin America
- Brazil
- Argentina
- Peru
- Chile
- Colombia
- Rest of Latin America
- Middle East
- UAE
- KSA
- Israel
- Turkey
- Iran
- Rest of Middle East
- Africa
- Egypt
- Nigeria
- Algeria
- Morocco
- Rest of Africa
Regional Analysis
North America
North America leads the Modular Data Center Market with about 41% share. The U.S. drives growth with investments from cloud providers, telecom firms, and government agencies. Modular systems support faster rollouts and meet 5G and edge computing needs. Canada also supports demand through public sector projects and sustainability programs. It remains the most advanced region for modular adoption.
Europe
Europe holds nearly 28% of the market, ranking second worldwide. Strict data protection laws, energy goals, and sovereign cloud initiatives fuel growth. Germany, the UK, and France remain top hubs for deployment. It benefits from high adoption of green-certified designs. Enterprises use modular facilities to manage compliance and scale digital infrastructure efficiently.
Asia-Pacific
Asia-Pacific captures around 24% of the market and shows the fastest expansion. China and India lead, followed by Japan and Southeast Asia. Rapid digitalization, smart cities, and telecom expansion drive adoption. It helps enterprises manage high data demand while governments support projects through favorable policies. Modular centers strengthen regional cloud and IoT growth.
Latin America
Latin America holds about 4% of the Modular Data Center Market. Brazil and Mexico drive most of the growth, supported by financial services, telecom, and retail. It benefits from rising cloud adoption and digital banking demand. Modular projects also expand in Chile and Colombia with government-backed initiatives. It helps enterprises reduce costs while scaling capacity quickly.
Middle East & Africa
The Middle East & Africa region accounts for nearly 3% share. Growth comes from smart city projects in the UAE and Saudi Arabia. South Africa leads in Africa, supported by telecom-driven modular deployments. It helps operators deliver faster connectivity in underserved areas. Demand rises steadily as enterprises seek flexible and cost-efficient facilities.
Shape Your Report to Specific Countries or Regions & Enjoy 30% Off!
Key Player Analysis
- Cannon Technologies Ltd.
- Dell Inc.
- Eaton
- Hewlett Packard Enterprise Development LP
- Huawei Technologies Co., Ltd.
- IE Corp.
- PCX Holding LLC
- Rittal GmbH & Co. KG
- Schneider Electric
- Vertiv Group Corp.
Competitive Analysis
The Modular Data Center Market players include Huawei Technologies, Dell Technologies, IBM Corporation, Hewlett Packard Enterprise (HPE), Schneider Electric, Vertiv Group, Rittal GmbH, Eaton Corporation, and Cisco Systems. The Modular Data Center Market shows strong competition, driven by rapid technology adoption and evolving enterprise needs. Vendors differentiate through innovation in power, cooling, and IT modules, with a clear focus on sustainability and scalability. Companies compete by offering prefabricated systems that cut deployment time from years to months, improving cost efficiency and flexibility. Energy-efficient designs, hybrid cloud compatibility, and edge-ready modules remain critical areas of competition. Providers expand regional presence to meet rising demand in North America, Europe, and Asia-Pacific, while also targeting emerging markets with containerized solutions. Strategic alliances, service integration, and continuous product upgrades shape the competitive environment, ensuring the market remains dynamic and innovation-led.
Recent Developments
- In July 2024, Vertiv, a renowned provider of critical infrastructure for data centers based in the United States announced the launch of its new modular data center solution. Vertiv™ MegaMod™ CoolChip was launched to meet the rising demand for artificial intelligence-capable computing power in data centers.
- In May 2024, Sonic Edge partnered with Iceotope to launch the Iceotope AI Pods, a new offering in the market specifically designed for high-performance AI applications. This collaboration aimed to address the growing demand for rapid deployment of AI-ready infrastructure.
- In March 2024, Eaton, a leading name in the power management company announced the launch of its new modular data center solution. Eaton’s SmartRack® modular data centers are capable of full deployment in days to meet the surging demand for critical data center infrastructure around the world.
- In March 2024, Nautilus Data Technologies, a company focusing on providing sustainable data centers announced the launch of its new modular data center offering called EcoCore. The solution was expected to witness its first deployment in Sines, Portugal.
Report Coverage
The research report offers an in-depth analysis based on Component, Application, Data Center Size and Geography. It details leading market players, providing an overview of their business, product offerings, investments, revenue streams, and key applications. Additionally, the report includes insights into the competitive environment, SWOT analysis, current market trends, as well as the primary drivers and constraints. Furthermore, it discusses various factors that have driven market expansion in recent years. The report also explores market dynamics, regulatory scenarios, and technological advancements that are shaping the industry. It assesses the impact of external factors and global economic changes on market growth. Lastly, it provides strategic recommendations for new entrants and established companies to navigate the complexities of the market.
Future Outlook
- Demand for modular data centers will grow with expansion of 5G networks.
- Edge computing adoption will increase deployment of compact modular facilities.
- Enterprises will focus on scalable modular systems to support digital transformation.
- Energy-efficient modules will gain traction under global sustainability targets.
- Hybrid and multi-cloud strategies will drive demand for flexible modular setups.
- Prefabricated and containerized designs will shorten deployment timelines across industries.
- Emerging markets will adopt modular centers to bypass traditional infrastructure gaps.
- Disaster recovery and business continuity needs will boost modular adoption.
- Investments in AI-driven monitoring will enhance operational efficiency of modular units.
- Government initiatives will encourage modular deployment to support digital economy growth.


