Market Overview
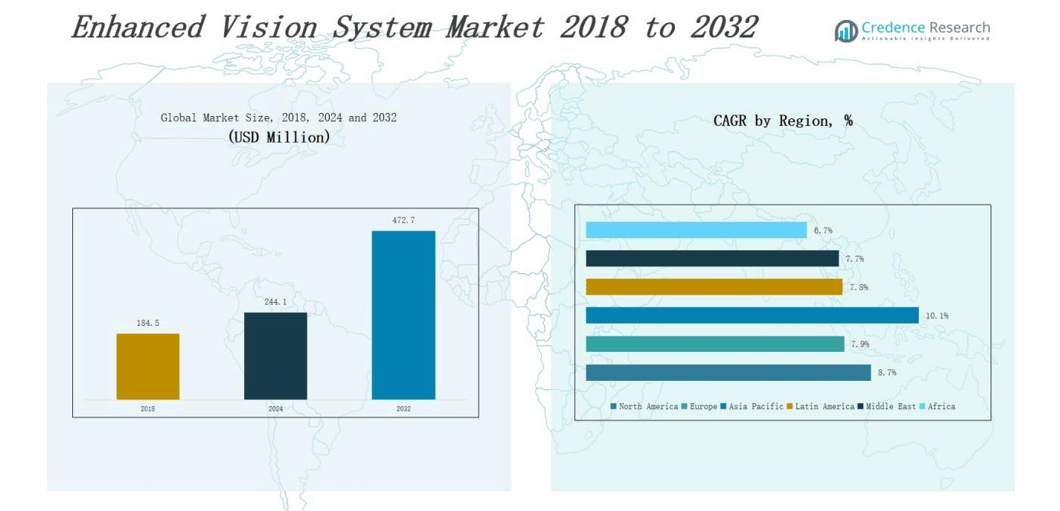
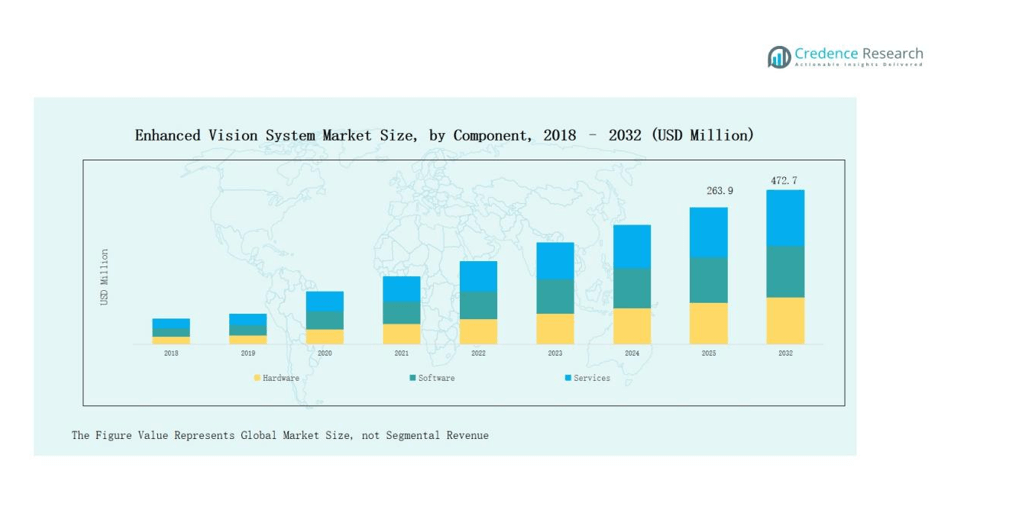
Enhanced Vision System Market size was valued at USD 184.5 million in 2018 to USD 244.1 million in 2024 and is anticipated to reach USD 472.7 million by 2032, at a CAGR of 8.7% during the forecast period.
| REPORT ATTRIBUTE |
DETAILS |
| Historical Period |
2020-2023 |
| Base Year |
2024 |
| Forecast Period |
2025-2032 |
| Enhanced Vision System Market Size 2024 |
USD 244.1 million |
| Enhanced Vision System Market, CAGR |
8.7% |
| Enhanced Vision System Market Size 2032 |
USD 472.7 million |
The Enhanced Vision System (EVS) market is shaped by leading companies such as Honeywell International, Collins Aerospace, Elbit Systems, Thales Group, Garmin Ltd., Astronics Corporation, and Universal Avionics. These players strengthen market growth through advancements in synthetic vision, infrared sensors, and head-up display technologies, aimed at improving flight safety and operational efficiency in both commercial and military aviation. Their strategies focus on product innovation, partnerships with aircraft manufacturers, and compliance with evolving aviation safety regulations. Regionally, North America leads the Enhanced Vision System market with a commanding 42 percent share, supported by strong adoption in commercial aviation, robust defense spending, and the presence of major aerospace firms driving large-scale deployment across the region.
Market Insights
- The Enhanced Vision System Market was valued at USD 184.5 million in 2018, reached USD 244.1 million in 2024, and is expected to grow to USD 472.7 million by 2032, advancing at a CAGR of 7%.
- Leading players such as Honeywell International, Collins Aerospace, Elbit Systems, Thales Group, Garmin Ltd., Astronics Corporation, and Universal Avionics drive market growth through innovation in synthetic vision, infrared sensors, and head-up display technologies.
- North America leads with 42% share in 2024, supported by commercial aviation adoption, robust defense budgets, and FAA-backed safety regulations, making it the largest EVS market.
- Europe holds 23% share, driven by strict EASA regulations, strong aerospace bases in Germany, France, and the UK, and modernization programs for business and regional aviation fleets.
- Asia Pacific accounts for 27% share, emerging as the fastest-growing region due to rising commercial air travel, fleet expansion in China and India, and defense modernization across Japan and South Korea.
Access crucial information at unmatched prices!
Request your sample report today & start making informed decisions powered by Credence Research Inc.!
Download Sample
Market Segment Insights
By Component
The hardware segment leads the Enhanced Vision System market with a dominant 58.8% share, driven by demand for advanced sensors, infrared cameras, and head-up displays that enhance visibility in low-light and poor weather. Software holds 26.4%, supported by growing adoption of synthetic vision and data fusion that improve pilot situational awareness and reduce workload. Services contribute 14.8%, fueled by installation, certification, and training requirements as operators upgrade fleets to comply with evolving aviation safety standards.
- For instance, Collins Aerospace’s EVS-3600 integrates multiple infrared sensors to improve pilots’ ability to detect terrain and runway obstacles during poor visibility approaches, and was certified on Airbus A320 family aircraft in 2023.
By Application
General aviation dominates with 39.7% share, as business jets and private operators prioritize EVS for safer landings and approaches under adverse conditions. Emergency services account for 22.1%, where firefighting, medical evacuation, and law enforcement aviation rely on EVS for critical missions at night or in smoke-filled environments. Search and rescue contributes 20.3%, with adoption supported by infrared and synthetic vision technologies that enable detection of stranded individuals during disaster or maritime operations. Others hold 17.9%, including military surveillance and border patrol, strengthened by defense investments and government procurement.
- For instance, Gulfstream integrated Enhanced Vision Systems into its G500 and G600 aircraft, allowing certified approaches even in poor visibility.
By Technology
Infrared technology leads with 45.6% share, reflecting its unmatched ability to operate in darkness, haze, fog, and smoke across both defense and civil aviation. Synthetic vision follows with 30.6%, supported by terrain mapping and cockpit display integration that reduce pilot workload and improve flight safety. Millimeter wave radar captures 15.2%, gaining momentum in defense and next-generation civil aircraft applications for obstacle detection under extreme conditions. The remaining 8.6% is held by other technologies, including multispectral and hybrid vision systems, which continue to expand through innovation in sensor fusion for enhanced operational performance.
Market Overview
Rising Demand for Flight Safety and Situational Awareness
The Enhanced Vision System market experiences strong growth due to increasing focus on flight safety and reduced accident risks in adverse conditions. EVS improves pilot situational awareness by providing clear imagery in low visibility environments such as fog, rain, snow, or night operations. Commercial and business aviation operators adopt these systems to comply with stringent aviation safety standards. The growing emphasis on safety in congested airspace and challenging terrains positions EVS as a critical avionics tool, sustaining its demand globally.
- For instance, the Federal Aviation Administration (FAA) notes that EVS helps reduce accidents caused by low visibility, a significant factor in many aviation incidents.
Expansion of Business and General Aviation Fleets
Global expansion of business jets and general aviation aircraft is a significant growth driver for the EVS market. Private operators and business aviation companies increasingly integrate EVS to ensure operational efficiency and reduce delays caused by poor weather conditions. With general aviation holding the largest application share, manufacturers benefit from steady demand across retrofit and line-fit installations. Rising disposable incomes, growth in regional air travel, and emphasis on operational reliability further stimulate adoption, especially in North America and Europe.
- For instance, Gulfstream Aerospace equips its G500 and G600 jets with the Enhanced Flight Vision System (EFVS), allowing pilots to land without natural vision at certified airports
Defense Modernization and Military Procurement
Defense modernization programs worldwide significantly fuel EVS market expansion. Military aircraft and helicopters use EVS for enhanced night operations, target acquisition, and surveillance in low-visibility environments. Defense agencies prioritize thermal imaging, synthetic vision, and radar-based EVS technologies to improve mission capability and operational safety. Increasing budgets for defense aviation and rising geopolitical tensions accelerate procurement of advanced avionics. This strong defense adoption ensures stable revenue streams for key EVS manufacturers, positioning defense contracts as a core growth driver alongside civil aviation demand.
Key Trends & Opportunities
Integration of Hybrid Vision Systems
A major trend shaping the EVS market is the integration of hybrid vision systems that combine synthetic vision with enhanced vision technologies. By merging computer-generated imagery with real-time sensor data, hybrid solutions deliver superior clarity and reliability under extreme operating conditions. These systems reduce pilot workload while improving decision-making accuracy, making them increasingly attractive to commercial and military operators. The growing emphasis on fusion-based avionics presents an opportunity for manufacturers to innovate and expand their portfolios with next-generation EVS solutions.
- For instance, Collins Aerospace demonstrated its EVS for the Bombardier Global 7500, where infrared sensors are blended with synthetic terrain models to support low-visibility landings.
Adoption of AI and Advanced Analytics in EVS
The adoption of artificial intelligence and advanced analytics in EVS creates strong opportunities for market players. AI-driven image recognition, terrain mapping, and predictive analytics enhance pilot awareness beyond traditional EVS capabilities. These systems enable faster data processing, smarter obstacle detection, and adaptive real-time imaging. As aviation increasingly embraces digital transformation, demand for AI-enabled EVS grows in both commercial and defense sectors. This trend positions AI as a pivotal technology for future product differentiation and market competitiveness.
- For instance, Honeywell’s SmartView Synthetic Vision System integrates AI-based terrain awareness to provide pilots with clear 3D runway and obstacle visualization even in low-visibility conditions.
Key Challenges
High Installation and Maintenance Costs
The high cost of EVS installation and ongoing maintenance acts as a barrier to wider adoption, particularly among smaller operators and emerging regional carriers. The integration of advanced infrared sensors, synthetic vision modules, and head-up displays significantly increases upfront investment. Additionally, training and certification expenses add to the financial burden. These costs make adoption more viable for large commercial and defense fleets but restrict penetration in price-sensitive markets, limiting the overall growth potential in developing regions.
Stringent Certification and Regulatory Requirements
Certification and compliance with aviation safety regulations represent a major challenge for EVS manufacturers. Meeting strict standards set by authorities such as the FAA and EASA requires extensive testing, delaying product launches and increasing development costs. The certification process is complex and often varies across regions, making global standardization difficult. This regulatory burden slows market entry for innovative solutions and restricts smaller firms from competing effectively, thereby consolidating the market among a few established players.
Technological Complexity and Integration Barriers
The technological complexity of EVS and integration challenges with existing avionics systems create obstacles for widespread deployment. Aircraft manufacturers and operators often face difficulties in aligning EVS with cockpit displays, navigation systems, and autopilot functions. Compatibility issues, along with pilot training requirements, increase resistance to adoption. Furthermore, ongoing advancements in sensor and display technologies demand continuous updates, complicating product life-cycle management. These integration barriers slow down adoption rates, particularly in older aircraft and retrofit markets.
Regional Analysis
North America
North America dominates the Enhanced Vision System market with a 38% share in 2024, supported by its market size of USD 96.0 million and projected growth to USD 185.7 million by 2032 at a CAGR of 8.7%. The region benefits from strong adoption in commercial and business aviation, coupled with significant defense spending. The presence of leading aerospace companies such as Honeywell and Collins Aerospace strengthens technological integration and accelerates certification approvals. Regulatory support from FAA for operational safety further fuels adoption, making North America the global leader in EVS deployment across both civil and military aviation.
Europe
Europe holds a 23% share in 2024, valued at USD 57.3 million and expected to reach USD 104.3 million by 2032 at a CAGR of 7.9%. The market is driven by strict EASA regulations, high penetration of business jets, and strong investments in avionics modernization programs. Countries such as Germany, France, and the UK lead adoption due to active aerospace manufacturing bases and fleet expansion in business and regional aircraft. The European market also benefits from defense modernization, with EVS playing a critical role in enhancing situational awareness for military aircraft operating in adverse weather conditions.
Asia Pacific
Asia Pacific emerges as the fastest-growing region, accounting for a 27% share in 2024, valued at USD 54.6 million and projected to reach USD 117.9 million by 2032, registering a 10.1% CAGR. Rapid growth in air travel, increasing procurement of commercial aircraft, and expanding defense modernization initiatives across China, India, Japan, and South Korea drive demand. Rising disposable incomes and a growing business aviation sector support wider EVS adoption. Regional governments are investing heavily in aviation safety infrastructure, positioning Asia Pacific as the most dynamic growth hub for EVS deployment over the forecast period.
Latin America
Latin America captures a 7% share in 2024, valued at USD 17.5 million, and is projected to expand to USD 31.8 million by 2032 at a CAGR of 7.8%. The market is supported by increasing adoption in regional and business aviation fleets, particularly in Brazil and Mexico, where growing middle-class populations and corporate travel drive demand. Governments are modernizing defense and surveillance aircraft, further strengthening EVS adoption. However, slower infrastructure development and higher costs remain barriers. Despite these constraints, Latin America demonstrates steady growth, with airlines gradually adopting EVS to ensure operational safety in diverse weather conditions.
Middle East
The Middle East accounts for a 4% share in 2024, valued at USD 11.9 million and forecasted to reach USD 21.4 million by 2032, growing at a CAGR of 7.7%. Regional adoption is driven by the expansion of premium airlines in the GCC countries, which emphasize advanced cockpit technologies for enhanced passenger safety. Defense programs in Saudi Arabia, UAE, and Israel contribute significantly to demand, with EVS playing a vital role in surveillance and combat aircraft. The region’s strategic focus on aviation hubs and ongoing investments in fleet modernization sustain its role as a key emerging EVS market.
Africa
Africa remains the smallest but steadily growing market, holding a 1% share in 2024, valued at USD 6.7 million and projected to reach USD 11.5 million by 2032 at a CAGR of 6.7%. Growth is supported by gradual expansion of commercial aviation, particularly in South Africa, Egypt, and Nigeria, where airlines seek advanced technologies to improve safety standards. The adoption of EVS is also tied to humanitarian and regional surveillance operations. However, limited aviation infrastructure and high costs hinder wider penetration. Despite these challenges, Africa is poised for incremental growth as aviation safety priorities gain regional attention.
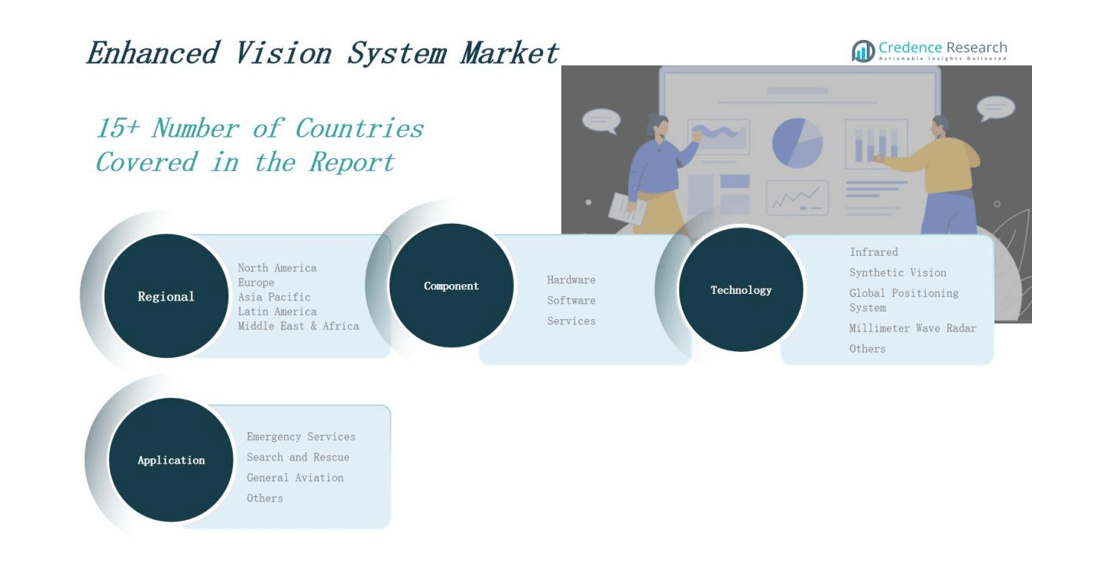
Market Segmentations:
By Component
- Hardware
- Software
- Services
By Application
- Emergency Services
- Search and Rescue
- General Aviation
- Others
By Technology
- Infrared
- Synthetic Vision
- Millimeter Wave Radar
- Others
By Region
- North America
- Europe
- Germany
- France
- U.K.
- Italy
- Spain
- Rest of Europe
- Asia Pacific
- China
- Japan
- India
- South Korea
- South-east Asia
- Rest of Asia Pacific
- Latin America
- Brazil
- Argentina
- Rest of Latin America
- Middle East & Africa
- GCC Countries
- South Africa
- Rest of the Middle East and Africa
Competitive Landscape
The Enhanced Vision System market is moderately consolidated, with global aerospace and defense companies driving innovation through strong product portfolios and strategic collaborations. Key players such as Honeywell International, Collins Aerospace, Elbit Systems, Thales Group, Astronics Corporation, and Esterline Technologies dominate the landscape by offering integrated EVS solutions that combine infrared, synthetic vision, and hybrid imaging technologies. Their competitive advantage lies in robust R&D capabilities, long-term partnerships with aircraft OEMs, and compliance with evolving regulatory standards. Defense-focused firms like Elbit Systems and L-3 Communications strengthen their presence through military contracts, while companies such as Opgal and MBDA expand applications in surveillance and border security. Market competition increasingly centers on hybrid vision systems, AI-enabled imaging, and cost-efficient integration with cockpit avionics. Regional players in Asia Pacific and Europe are also entering the market with localized solutions, intensifying rivalry. Continuous innovation, certification approvals, and aftermarket service networks remain critical success factors.
Shape Your Report to Specific Countries or Regions & Enjoy 30% Off!
Key Players
- Astronics Corporation
- Collins Aerospace (Part of UTC)
- Elbit Systems Ltd.
- Esterline Technologies Corporation
- Honeywell International, Inc.
- L-3 Communications Holdings, Inc.
- MBDA
- Opgal
- Thales Group
- United Technologies Corporation
Recent Developments
l In 2024, Universal Avionics partnered with Widerøe Airlines to modernize its Dash 8 fleet by integrating the InSight® flight deck along with the ClearVision™ Enhanced Flight Vision System (EFVS), strengthening adoption of advanced avionics and enhancing operational safety.
l In June 2023, Honeywell International agreed to acquire heads-up-display (HUD) assets from Saab. Additionally, Honeywell and Saab are partnering to further develop HUD products to improve situational awareness and flight safety.
l In 2025, L3Harris, in collaboration with Elbit Systems of America, advanced its AN/PSQ‑42 Enhanced Night Vision Goggle‑Binocular (ENVG‑B), combining image intensification and thermal imaging for enhanced vision during low‑light operations, now fielded with thousands of U.S. Army and Marine Corps units
Market Concentration & Characteristics
The Enhanced Vision System Market exhibits a moderately consolidated structure, with a limited number of global aerospace and defense companies holding significant shares. It is characterized by high entry barriers due to strict certification requirements, advanced technology integration, and the need for long-term partnerships with aircraft manufacturers. The market relies heavily on hardware components such as sensors, cameras, and head-up displays, which dominate revenue streams, while software and services support system optimization and compliance. Leading players focus on innovation in hybrid vision systems that combine synthetic and enhanced imaging, creating differentiation and expanding application scope. The market demonstrates strong dependence on commercial aviation adoption and defense procurement programs, both of which drive continuous demand. It is also marked by long product life cycles, high installation costs, and a growing emphasis on AI-enabled solutions. Competitive intensity remains steady, supported by investments in R&D, regional expansion, and aftermarket service offerings.
Report Coverage
The research report offers an in-depth analysis based on Component, Application, Technology and Region. It details leading market players, providing an overview of their business, product offerings, investments, revenue streams, and key applications. Additionally, the report includes insights into the competitive environment, SWOT analysis, current market trends, as well as the primary drivers and constraints. Furthermore, it discusses various factors that have driven market expansion in recent years. The report also explores market dynamics, regulatory scenarios, and technological advancements that are shaping the industry. It assesses the impact of external factors and global economic changes on market growth. Lastly, it provides strategic recommendations for new entrants and established companies to navigate the complexities of the market.
Future Outlook
- Demand will rise with stronger emphasis on aviation safety in low-visibility operations.
- Hybrid vision systems combining synthetic and enhanced imaging will gain wider adoption.
- Integration of AI and advanced analytics will improve real-time decision-making.
- Business and general aviation fleets will continue to be the largest adopters of EVS solutions.
- Defense modernization programs will expand opportunities for thermal and radar-based systems.
- Regulatory support for safer landings and navigation will accelerate adoption in commercial aviation.
- Asia Pacific will emerge as the fastest-growing region due to fleet expansion and infrastructure upgrades.
- Aftermarket services and training will see steady growth as airlines retrofit existing aircraft.
- Technology miniaturization will make EVS more accessible to regional and smaller aircraft operators.
- Competition will intensify as new entrants introduce cost-efficient and localized solutions.


