
Market Overview
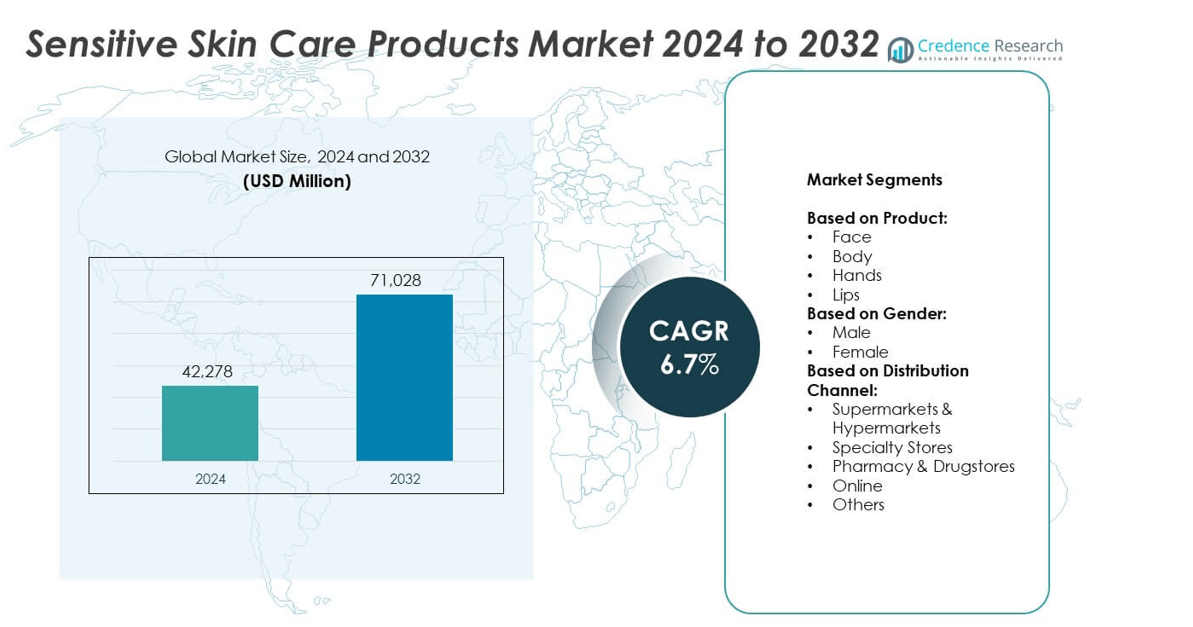
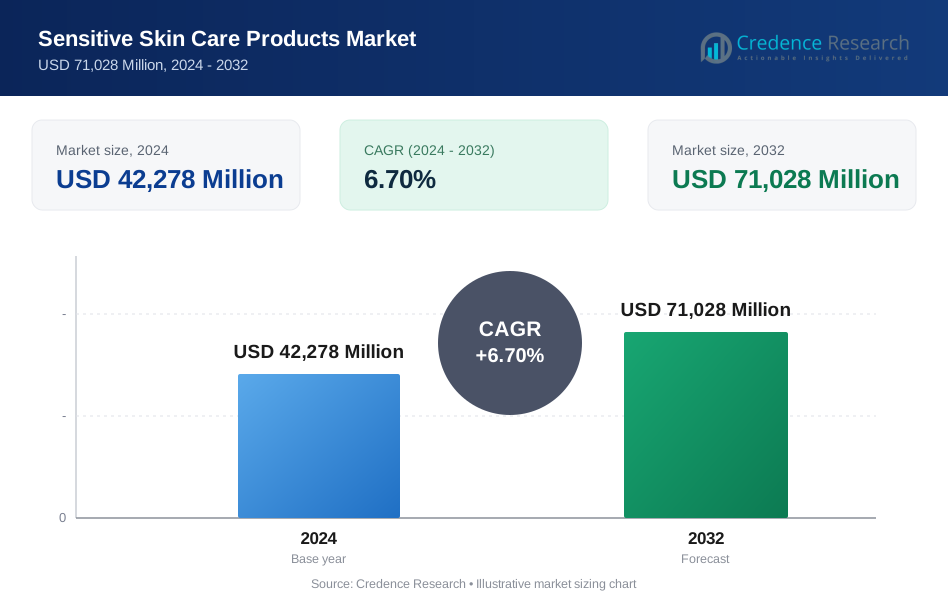
Sensitive Skin Care Products Market size was valued at USD 42,278 Million in 2024 and is expected to reach USD 71,028 Million by 2032, growing at a CAGR of 6.7% during the forecast period.
| REPORT ATTRIBUTE | DETAILS |
|---|---|
| Historical Period | 2020-2023 |
| Base Year | 2024 |
| Forecast Period | 2025-2032 |
| Sensitive Skin Care Products Market Size 2024 | USD 42,278 Million |
| Sensitive Skin Care Products Market, CAGR | 6.7% |
| Sensitive Skin Care Products Market Size 2032 | USD 71,028 Million |
Sensitive Skin Care Products market grows with rising cases of skin irritation, allergies, and pollution-driven sensitivities. Demand for hypoallergenic, fragrance-free, and dermatologist-tested products fuels innovation in clean-label and natural formulations. Consumers seek minimalist routines and multifunctional solutions, pushing brands toward simple, effective products. Digital engagement and influencer marketing educate buyers and drive adoption. E-commerce platforms expand product accessibility, while sustainability efforts such as recyclable packaging and cruelty-free certifications strengthen brand positioning and appeal to environmentally conscious consumers worldwide.
markets )n 80 words) do not write Markets share
North America leads the Sensitive Skin Care Products market due to high awareness and strong dermatology infrastructure. Europe follows with demand for safe, clinically tested products and strict regulatory compliance. Asia-Pacific grows rapidly with rising incomes and urbanization driving adoption of sensitive skin solutions. Key players include L'Oréal S.A., Johnson & Johnson Services Inc., Unilever PLC, and Amorepacific Corporation, focusing on innovation, sustainable packaging, and digital strategies to strengthen presence across established and emerging regions.
Market Insights
- Sensitive Skin Care Products market was valued at USD 42,278 Million in 2024 and is projected to reach USD 71,028 Million by 2032 at a CAGR of 6.7%.
- Rising cases of skin sensitivities, eczema, and allergies drive demand for hypoallergenic and dermatologist-tested solutions.
- Clean-label and natural formulations gain popularity, with consumers preferring plant-based and microbiome-friendly products.
- Leading players such as L'Oréal S.A., Johnson & Johnson Services Inc., Unilever PLC, and Procter & Gamble Company focus on innovation, clinical validation, and sustainable packaging.
- High product development costs and strict regulatory compliance pose challenges for smaller players and delay new launches.
- North America leads the market, followed by Europe, while Asia-Pacific shows fastest growth supported by urbanization and e-commerce adoption.
- Digital campaigns, influencer marketing, and personalized product recommendations strengthen consumer engagement and boost online sales globally.
Market Drivers
Rising Prevalence of Skin Sensitivities and Dermatological Issues
Sensitive Skin Care Products market expands with the growing number of consumers facing skin irritation, allergies, and conditions like eczema or rosacea. Increasing pollution, urban stress, and harsh weather trigger higher skin sensitivity cases. It pushes consumers to choose gentler, dermatologist-tested products. Rising awareness about skin barrier health fuels preference for hypoallergenic and fragrance-free solutions. Social media platforms educate users about skin-friendly routines and ingredients. Dermatologists recommend specialized products, strengthening trust and adoption.
- For instance, La Roche-Posay is recommended by 90,000 dermatologists worldwide.
Increasing Demand for Natural and Clean-Label Formulations
Consumers shift toward products with minimal chemicals, sulfates, and parabens, driving demand for natural solutions. Sensitive Skin Care Products market benefits from brands offering plant-based and non-toxic formulations. It aligns with rising health-conscious behavior and ethical consumption trends. Clean-label certifications enhance brand credibility and consumer loyalty. Manufacturers invest in botanical extracts and microbiome-friendly ingredients to improve product appeal. Regulatory push for safer cosmetic ingredients further encourages adoption of clean-label offerings.
- For instance, Cetaphil has tested its sensitive-skin products on over 32,000 patients across more than 550 clinical studies conducted by Galderma. The studies cover issues like dryness, irritation, roughness, and weakened skin barrier.
Expansion of E-Commerce and Digital Consumer Engagement
Growth of online retail channels strengthens access to specialized sensitive skin care products. E-commerce platforms allow easy product comparison and ingredient research before purchase. It supports niche brands reaching a global audience cost-effectively. Social media influencers and dermatologists endorse trusted solutions, boosting consumer confidence. Subscription models and direct-to-consumer channels enhance convenience and repeat sales. Digital campaigns drive consumer education, encouraging informed buying decisions.
R&D Innovation and Technological Advancements in Product Formulation
Continuous innovation supports development of advanced solutions targeting sensitive skin concerns. Sensitive Skin Care Products market witnesses new delivery systems such as microencapsulation for improved ingredient stability. It helps maintain efficacy and reduce irritation risk. Companies adopt pH-balanced and non-comedogenic formulations to ensure wider acceptance. Clinical testing and dermatological trials validate product safety and effectiveness. Collaboration between cosmetic chemists and dermatologists drives breakthrough product launches.
Market Trends
Growing Popularity of Personalized and Customized Skin Care Solutions
Sensitive Skin Care Products market sees rising interest in tailored solutions for unique skin needs. Brands use AI-powered skin analysis to recommend suitable products. It enhances consumer satisfaction by reducing trial-and-error purchases. Customizable formulations like serums and creams allow precise ingredient selection. Data-driven platforms offer quizzes to guide consumers toward effective routines. This trend fosters deeper engagement and brand loyalty.
- For instance, Kenvue reported that 69% of its packaging portfolio is now recyclable or refillable, with a goal to reach 100% by 2025. Additionally, the company has reduced its use of virgin plastic by over 21% (from its 2020 baseline), aiming for 25% by 2025 and 50% by 2030.
Shift Toward Minimalist and Multi-Functional Product Formulations
Consumers demand simple, effective routines with fewer steps, boosting interest in multifunctional products. Sensitive Skin Care Products market benefits from cleansers, moisturizers, and sunscreens offering combined benefits. It appeals to time-conscious users seeking efficiency and safety. Brands emphasize minimal ingredient lists to lower irritation risks. Packaging highlights essential actives like ceramides and niacinamide to build trust. This shift supports a streamlined, skin-friendly approach.
- For instance, Graphic Packaging Holding Company reported in its 2024 Impact Report that 97% of its packaging products sold are now characterized as recyclable. It also replaced roughly 1 billion plastic packages with paperboard packaging.
Rising Influence of Social Media and Dermatologist Endorsements
Online platforms shape purchase decisions through influencer recommendations and expert advice. Sensitive Skin Care Products market gains momentum through clinical claims showcased on social media. It builds consumer confidence in ingredient transparency and proven results. Dermatologists collaborate with brands to create education-driven campaigns. Viral trends encourage mass adoption of products suitable for sensitive skin. User-generated content amplifies brand credibility and awareness.
Focus on Sustainable and Ethical Product Development
Sustainability drives innovation in packaging, sourcing, and manufacturing across the market. Sensitive Skin Care Products market players adopt recyclable materials and refillable formats. It meets consumer demand for eco-friendly beauty solutions. Brands integrate cruelty-free testing and ethical sourcing certifications. Transparency in supply chain practices strengthens brand image. Sustainable formulations with biodegradable ingredients gain preference among environmentally conscious buyers.
Market Challenges Analysis
High Product Development Costs and Stringent Regulatory Compliance
Sensitive Skin Care Products market faces rising costs due to complex formulation requirements. Brands must invest heavily in R&D to ensure safety, hypoallergenic claims, and clinical validation. It raises time-to-market and limits smaller players' competitiveness. Regulatory bodies demand strict compliance with cosmetic safety and labeling standards. This pressure slows product launches and increases certification expenses. Failure to meet guidelines can lead to recalls, damaging brand reputation and consumer trust.
Intense Competition and Risk of Product Mislabeling
Fierce competition challenges brands to differentiate in a crowded market. Sensitive Skin Care Products market players struggle with greenwashing accusations and false hypoallergenic claims. It creates skepticism among consumers, affecting loyalty. Counterfeit and low-quality products increase risks of skin irritation and erode confidence. Price wars reduce profit margins for premium solutions. Maintaining consistent quality across multiple markets becomes difficult for global brands.
Market Opportunities
Expansion into Emerging Markets and Untapped Consumer Segments
Sensitive Skin Care Products market holds strong potential in Asia-Pacific, Latin America, and Middle East regions. Rising disposable incomes and growing awareness about skin health drive product demand. It creates opportunities for brands to introduce dermatologist-tested and affordable solutions. Localized formulations targeting regional skin concerns enhance acceptance. Distribution partnerships with pharmacies and online retailers expand market reach. Brands that invest in education campaigns can build trust with first-time buyers.
Innovation in Advanced Formulations and Technology Integration
Advances in biotechnology and dermatological research open new growth avenues. Sensitive Skin Care Products market benefits from probiotic-based, microbiome-friendly, and peptide-enriched products. It allows brands to offer targeted solutions with proven clinical results. AI-driven skin diagnostics support personalized product recommendations. Smart packaging with QR codes provides ingredient transparency and usage guidance. Collaborations with research institutes accelerate development of next-generation sensitive skin care lines.
Market Segmentation Analysis:
By Product:
Sensitive Skin Care Products market shows strong demand across multiple product categories. Face care segment leads with high adoption of moisturizers, cleansers, and sunscreens formulated for sensitive skin. It benefits from rising awareness of facial skin health and preference for fragrance-free, pH-balanced solutions. Body care products follow, supported by lotions and shower gels designed to reduce irritation and dryness. Hand care segment grows due to frequent handwashing and sanitizer use, which increase skin dryness. Lip care products gain popularity with demand for hydrating balms and SPF-infused options.
- For instance, Galderma conducted a large global survey involving nearly 17,000 participants in 2025. The results showed up to 70% of people worldwide describe having some degree of sensitive skin.
By Gender:
Female consumers as the dominant buyers of sensitive skin solutions. Women seek targeted face serums, creams, and anti-aging products tailored to delicate skin. It also shows rising adoption among male consumers due to increasing grooming habits and awareness of skin health. Male-oriented products like aftershave balms, facial cleansers, and soothing moisturizers address irritation from shaving and pollution exposure. Brands launch gender-neutral lines to appeal to a wider audience. This shift supports inclusive marketing strategies and product positioning.
- For instance, a JAMA Dermatology--backed pilot survey in 2023 found that 57% of respondents self-reported sensitive skin. Within that group, 15% said they experienced their skin symptoms daily. The study also revealed women (60%) reported sensitive skin more often than men (46.2%).
By Distribution Channel:
Supermarkets and hypermarkets as leading sales points due to broad product availability and convenience. Specialty stores attract consumers seeking dermatologist-recommended and premium solutions. It benefits from in-store consultations and expert guidance. Pharmacies and drugstores maintain steady demand from health-conscious buyers prioritizing clinically tested products. Online channels grow rapidly with the influence of e-commerce, offering personalized recommendations and reviews to guide buyers. Other channels, including direct-to-consumer and department stores, contribute to niche demand, helping brands expand reach across regions.
Segments:
Based on Product:
- Face
- Body
- Hands
- Lips
Based on Gender:
- Male
- Female
Based on Distribution Channel:
- Supermarkets & Hypermarkets
- Specialty Stores
- Pharmacy & Drugstores
- Online
- Others
Based on the Geography:
- North America
- U.S.
- Canada
- Mexico
- Europe
- UK
- France
- Germany
- Italy
- Spain
- Russia
- Belgium
- Netherlands
- Austria
- Sweden
- Poland
- Denmark
- Switzerland
- Rest of Europe
- Asia Pacific
- China
- Japan
- South Korea
- India
- Australia
- Thailand
- Indonesia
- Vietnam
- Malaysia
- Philippines
- Taiwan
- Rest of Asia Pacific
- Latin America
- Brazil
- Argentina
- Peru
- Chile
- Colombia
- Rest of Latin America
- Middle East
- UAE
- KSA
- Israel
- Turkey
- Iran
- Rest of Middle East
- Africa
- Egypt
- Nigeria
- Algeria
- Morocco
- Rest of Africa
Regional Analysis
North America
North America holds the largest share of the Sensitive Skin Care Products market, accounting for 35% of global revenue. High awareness about skin sensitivities and strong dermatological infrastructure support market dominance. Consumers in the U.S. and Canada demand fragrance-free, dermatologist-tested, and hypoallergenic products. It benefits from rising cases of eczema, rosacea, and contact dermatitis linked to pollution and stress. The region sees a surge in demand for clean-label and natural formulations, pushing companies to invest in plant-based ingredients and transparent labeling. Major players focus on clinical validation and dermatologist endorsements to build consumer trust. E-commerce platforms and specialty stores play a critical role in educating buyers and promoting premium products.
Europe
Europe represents 28% of the global market share, supported by high regulatory standards and preference for safe, clinically proven solutions. Consumers in Germany, France, and the UK are highly aware of skin health and seek allergen-free products. It encourages brands to maintain compliance with strict EU regulations, including REACH and Cosmetics Directive standards. Demand rises for sustainable and cruelty-free products, aligning with regional focus on ethical beauty. Growing popularity of pharmacy chains and dermo-cosmetic brands like La Roche-Posay and Avène strengthens sales. Influencer-driven marketing and dermatologist collaborations further expand awareness. Premiumization trends fuel growth in facial serums, moisturizers, and sunscreen products specifically for sensitive skin.
Asia-Pacific
Asia-Pacific captures 22% of the Sensitive Skin Care Products market, making it the fastest-growing region. Rising disposable incomes and growing awareness about skincare routines drive strong adoption. It benefits from urbanization, pollution-related skin concerns, and cultural emphasis on skin health. Countries like China, Japan, and South Korea lead demand for innovative formulations, including microbiome-friendly and lightweight textures suitable for humid climates. K-beauty and J-beauty trends influence product development worldwide, inspiring brands to create advanced solutions for sensitive skin. E-commerce platforms dominate distribution, offering localized products and subscription models. Local players compete with global brands by introducing affordable, dermatologist-approved options.
Latin America
Latin America accounts for 9% of the market share, driven by rising middle-class population and increasing grooming awareness. Consumers in Brazil and Mexico focus on affordable, soothing formulations to address skin irritation from climate and pollution. It creates opportunities for mass-market brands and pharmacy-led sales. Marketing campaigns focus on educating consumers about skin sensitivity and prevention of allergic reactions. Growth of specialty stores and dermatology clinics expands access to premium brands. Regional demand for sun protection and lightweight moisturizers strengthens product sales. Local players collaborate with dermatologists to increase trust and market penetration.
Middle East & Africa
Middle East & Africa represent 6% of global revenue but offer strong potential for future expansion. Harsh climatic conditions, including heat and dryness, heighten the need for hydrating and protective products. It encourages demand for soothing creams, sunscreens, and barrier-repair formulations. Consumers in the UAE, Saudi Arabia, and South Africa prefer dermatologist-endorsed brands and premium solutions. E-commerce and pharmacy channels are growing rapidly, offering better accessibility and variety. Rising awareness about skin health through social media and medical campaigns supports market growth. Global players invest in localized marketing and product launches to cater to specific skin concerns in the region.
Key Player Analysis
- Kao Corporation
- Johnson & Johnson Services Inc.
- Pevonia International Inc
- The Estée Lauder Companies Inc.
- maxingvest AG (Beiersdorf AG)
- L'Oréal S.A.
- Amorepacific Corporation
- Unilever PLC
- Sebapharma GmbH & Co. KG
- Procter & Gamble Company
Competitive Analysis
The competitive landscape of the Sensitive Skin Care Products market is shaped by leading players such as Kao Corporation, Johnson & Johnson Services Inc., Pevonia International Inc, The Estée Lauder Companies Inc., maxingvest AG (Beiersdorf AG), L'Oréal S.A., Amorepacific Corporation, Unilever PLC, Sebapharma GmbH & Co. KG, and Procter & Gamble Company. These companies compete through strong brand portfolios, continuous product innovation, and global distribution networks. They invest in advanced formulations such as pH-balanced, fragrance-free, and microbiome-friendly products to meet the rising demand for sensitive skin solutions. Leading players focus on clinical validation and dermatologist endorsements to build consumer trust and credibility. Many launch gender-neutral and multifunctional products to capture wider consumer segments. Sustainability initiatives, including recyclable packaging and cruelty-free certifications, strengthen brand positioning among eco-conscious buyers. Strategic mergers, acquisitions, and collaborations expand market presence and accelerate R&D efforts. Digital marketing and e-commerce partnerships allow them to engage directly with consumers and boost online sales. Regional expansion strategies target high-growth markets like Asia-Pacific and Latin America, aligning offerings with local preferences. The intense competition encourages constant innovation and drives the overall market toward premiumization and transparency in product labeling.
Recent Developments
- In 2024, Unilever launched a body wash collection addressing nine skincare needs, including hydration with 6% hyaluronic acid serum and Acne Clear formula targeting acne-prone sensitive skin on body areas
- In 2023, L'Oréal acquired Aesop, expanding its footprint in high-end natural sensitive skincare products, especially in China
- In 2022, La Roche-Posay (a L'Oréal brand) launched Anthelios UVMune 400 technology with products offering broad photoprotection designed for sensitive skin including an oily skin formulatio
Report Coverage
The research report offers an in-depth analysis based on Product, Gender, Distribution Channel and Geography. It details leading market players, providing an overview of their business, product offerings, investments, revenue streams, and key applications. Additionally, the report includes insights into the competitive environment, SWOT analysis, current market trends, as well as the primary drivers and constraints. Furthermore, it discusses various factors that have driven market expansion in recent years. The report also explores market dynamics, regulatory scenarios, and technological advancements that are shaping the industry. It assesses the impact of external factors and global economic changes on market growth. Lastly, it provides strategic recommendations for new entrants and established companies to navigate the complexities of the market.
Future Outlook
- Demand for dermatologist-tested and hypoallergenic products will continue to rise.
- Brands will focus on clean-label and natural ingredient formulations for sensitive skin.
- E-commerce will grow as a leading sales channel, offering wider product accessibility.
- Personalized skin care solutions using AI and data-driven tools will gain popularity.
- Sustainable packaging and eco-friendly production methods will become a key differentiator.
- Collaborations with dermatologists and medical professionals will boost product credibility.
- Emerging markets will see rapid adoption due to rising income and awareness levels.
- Multifunctional and minimalist products will dominate consumer preferences.
- Clinical testing and regulatory compliance will remain critical for market trust.
- Digital marketing and influencer collaborations will drive stronger consumer engagement.
Request a Free Sample
Fill in your details and we'll send you a free sample report.
- Sample data tables & charts
- Research methodology
Need a Custom Version of This Report?
Tailor the scope, geography, or segments to your exact requirements.
- Custom geography or segment scope
- Direct access to our analyst team
Frequently Asked Questions
What is the current market size for Sensitive Skin Care Products market, and what is its projected size in 2032?
Which Sensitive Skin Care Products market segment held the largest share in 2024?
What are the primary factors fueling the growth of the Sensitive Skin Care Products market?
Who are the leading companies in the Sensitive Skin Care Products Market?
Table of Content
Chapter 1. Report Introduction
- 1.1 Report Description & Purpose
- 1.1.1 Report Title & Market Definition
- 1.1.2 Unique Selling Propositions (USP) & Key Differentiators
- 1.1.3 Value Proposition for Stakeholders
- 1.2 Research Objectives
- 1.2.1 Market Sizing Objectives (Volume & Revenue) (Volume Where Applicable)
- 1.2.2 Segmentation Objectives
- 1.2.3 Competitive Intelligence Objectives
- 1.2.4 Forecast & Scenario Objectives
- 1.3 Report Scope
- 1.3.1 Sensitive Skin Care Products Scope – Segments & Subsegments Covered
- 1.3.2 Geographic Scope – Regions & Countries Covered
- 1.3.3 Historical Period, Base Year & Forecast Period (2024; forecast to 2032)
- 1.3.4 Inclusions & Exclusions
- 1.4 Industry Classification & Applicable Codes
- 1.5 Currency, Measurement Units & Valuation Basis
- 1.6 Target Stakeholders
- 1.7 Limitations & Assumptions
Chapter 2. Executive Summary
- 2.1 Global Sensitive Skin Care Products Market Snapshot
- 2.1.1 Market Size – Historical (2024) & Forecast (2024-2032) (2024: USD 42,278 Million → 2032: USD 71,028 Million)
- 2.1.2 Volume & Revenue – Global Totals (Volume Where Applicable)
- 2.1.3 Key Market Highlights – Top Five Facts
- 2.2 Sensitive Skin Care Products Market Segmentation Snapshot
- 2.2.1 Market Split by Region – 2024 vs. 2032
- 2.3 Competitive Snapshot
- 2.3.1 Top 10 Players by Revenue Share – 2024
- 2.3.2 Top 10 Players by Volume Share – 2024 (Volume Where Applicable)
- 2.3.3 Recent Strategic Developments (18-Month Summary)
- 2.4 Key Investment Highlights & Strategic Conclusions
Chapter 3. Sensitive Skin Care Products Market Dynamics & Industry Analysis
- 3.1 Market Overview & Context
- 3.1.1 Sensitive Skin Care Products Market Position in the Broader Industry Value Chain
- 3.1.2 Demand Structure & Purchasing Dynamics
- 3.1.3 Market Maturity & Development Stage by Region
- 3.2 Sensitive Skin Care Products Market Drivers
- 3.3 Sensitive Skin Care Products Market Restraints & Challenges
- 3.4 Sensitive Skin Care Products Market Opportunities
- 3.5 Porter's Five Forces Analysis
- 3.5.1 Threat of New Entrants
- 3.5.2 Bargaining Power of Suppliers
- 3.5.3 Bargaining Power of Buyers
- 3.5.4 Threat of Substitutes
- 3.5.5 Competitive Rivalry – Intensity Assessment
- 3.6 Sensitive Skin Care Products Value Chain Analysis
- 3.6.1 Upstream – Key Inputs, Resources & Suppliers
- 3.6.1.1 Key Input/Resource 1
- 3.6.1.2 Key Input/Resource 2
- 3.6.1.3 Key Input/Resource 3
- 3.6.2 Midstream – Core Operations & Value Creation
- 3.6.2.1 Operating Model & Process Overview
- 3.6.2.2 Key Operating Locations & Capabilities by Company
- 3.6.3 Downstream – Market Channels & End Users
- 3.6.3.1 Direct Sales & Customer Engagement Channels
- 3.6.3.2 Indirect Sales, Intermediaries & Partner Channels
- 3.6.4 Value Chain Profitability Analysis
- 3.6.1 Upstream – Key Inputs, Resources & Suppliers
- 3.7 PESTEL Analysis
- 3.7.1 Political Factors
- 3.7.2 Economic Factors
- 3.7.3 Social Factors
- 3.7.4 Technological Factors
- 3.7.5 Environmental Factors
- 3.7.6 Legal Factors
- 3.8 Sensitive Skin Care Products Supply Chain Analysis
- 3.8.1 Critical Input & Resource Availability Risk Assessment
- 3.8.2 Supplier & Operational Concentration Risk (Geographic Exposure)
- 3.8.3 Supply & Service Disruption Impact Analysis
- 3.9 Regulatory & Policy Landscape
Note: The regulatory and policy landscape section covers regulations based on their applicability to the market, Sensitive Skin Care Products category, geography, and scope of the study. Only regulatory frameworks with a material impact on operations, compliance, trade, sustainability, or market access are analyzed in detail.
Chapter 4. Key Investment Pockets & Opportunity Analysis
- 4.1 Sensitive Skin Care Products Market Attractiveness Analysis
- 4.1.1 By Region – Investment Attractiveness Matrix (Market Size × CAGR)
- 4.2 Absolute Revenue Growth Opportunity
- 4.2.1 By Region – Absolute Revenue Growth Through 2032
- 4.3 Incremental Demand Opportunity
- 4.3.1 By Region – Incremental Demand Through 2032
- 4.3.2 Segment – Incremental Demand
- 4.4 Emerging Submarket Opportunity Deep Dive (Subject to Applicability)
- 4.5 Priority Market Opportunity Scorecards
- 4.5.1 United States
- 4.5.2 Europe
- 4.5.3 Asia
- 4.5.4 Middle East & Africa
Note: Priority market opportunity scorecards reflect the geographic scope and strategic relevance of the study. Listed markets are indicative and may be adapted to the industry.
Chapter 5. Sensitive Skin Care Products Cross-Border Trade & Market Access Analysis
- 5.1 International Trade & Cross-Border Activity Overview
- 5.1.1 Global Export Value by Country (2024)
- 5.1.2 Global Export Volume by Country (2024) (Volume Where Applicable)
- 5.1.3 Global Import Value by Country (2024)
- 5.1.4 Global Import Volume by Country (2024) (Volume Where Applicable)
- 5.1.5 Net Trade Balance by Country (2024)
- 5.2 Export Analysis – Segment
- 5.2.1 Category 1 (Applicable Classification Code)
- 5.2.2 Category 2 (Applicable Classification Code)
- 5.2.3 Category 3 (Applicable Classification Code)
- 5.2.4 Category 4 (Applicable Classification Code)
- 5.2.5 Category 5 (Applicable Classification Code)
- 5.3 Import Analysis – Segment
- 5.3.1 Category 1 (Applicable Classification Code)
- 5.3.2 Category 2 (Applicable Classification Code)
- 5.3.3 Category 3 (Applicable Classification Code)
- 5.3.4 Category 4 (Applicable Classification Code)
- 5.3.5 Category 5 (Applicable Classification Code)
- 5.4 Cross-Border Pricing & Transaction Benchmarks
- 5.4.1 Export Pricing – Segment & Country
- 5.4.2 Import Pricing – Segment & Source Country
- 5.4.3 Price Trends (2024)
- 5.5 Key Cross-Border Trade & Delivery Routes
- 5.5.1 Cross-Border Trade/Delivery Route 1
- 5.5.2 Cross-Border Trade/Delivery Route 2
- 5.5.3 Cross-Border Trade/Delivery Route 3
- 5.5.4 Cross-Border Trade/Delivery Route 4
- 5.5.5 Cross-Border Trade/Delivery Route 5
- 5.6 Trade Policy & Market Access Impact Assessment
- 5.6.1 Tariff & Non-Tariff Barriers
- 5.6.2 Regional Trade & Economic Integration Frameworks
- 5.6.3 Bilateral & Multilateral Trade Agreements
- 5.6.4 Cross-Border Operating, Licensing & Localization Requirements
Note: This chapter applies where cross-border trade or delivery is relevant to Sensitive Skin Care Products. Goods, services, and digital offerings are assessed using applicable classifications and transaction measures. Import-export volumes, trade balances, and route analyses are included only where meaningful to the market.
Chapter 6. Competitive Landscape & Company Benchmarking
- 6.1 Sensitive Skin Care Products Market Concentration & Structure
- 6.1.1 Herfindahl-Hirschman Index (HHI) – vs. 2024
- 6.1.2 Leading, Mid-Sized & Emerging Player Structure
- 6.1.3 Global, Regional & Local Player Dynamics
- 6.2 Sensitive Skin Care Products Market Share Analysis – 2024
- 6.2.1 Global Revenue Share by Company
- 6.2.2 Global Volume Share by Company (Volume Where Applicable)
- 6.2.3 Regional Revenue Share
- 6.2.4 Market Share Evolution ( vs. 2024)
- 6.2.5 Company Market Share by Key Segment
- 6.2.6 Company Market Share by Customer Group
- 6.3 Operating Scale, Capacity & Infrastructure Analysis
- 6.3.1 Global Operating Scale & Supply Capacity
- 6.3.2 Resource Utilization & Operating Efficiency
- 6.3.3 Output, Service Delivery & Activity Metrics
- 6.3.4 Operating Footprint & Infrastructure Map
- 6.3.5 Planned Operational & Capacity Expansion
- 6.4 Sensitive Skin Care Products Competitive Benchmarking Matrix
- 6.4.1 Revenue, Growth, Profitability & Operating Metric Comparison
- 6.4.2 Channel Revenue Mix
- 6.4.3 Geographic Revenue Exposure
- 6.4.4 R&D Intensity
- 6.4.5 Sustainability Maturity
- 6.5 Strategic Developments in Sensitive Skin Care Products (Last 24 Months)
- 6.5.1 Mergers, Acquisitions & Divestments
- 6.5.2 New Products, Services & Solutions in Sensitive Skin Care Products
- 6.5.3 Operational & Infrastructure Expansions
- 6.5.4 Strategic Alliances, Joint Ventures & Partnerships
- 6.5.5 Distribution Expansion & Market Entry
- 6.5.6 Sustainability & ESG Initiatives
- 6.6 Competitive Strategy Mapping
- 6.6.1 Leader, Challenger, Follower & Niche Classification
- 6.6.2 Pricing Strategy Comparison
- 6.6.3 Channel Strategy Matrix
Note: Strategic developments are included based on their materiality and the availability of reliable information.
Chapter 7. Global Sensitive Skin Care Products Market – By Sales & Delivery Channel
- 7.1 Segment Overview
- 7.1.1 Volume & Revenue Split by Channel (2024 & 2032) (Volume Where Applicable)
- 7.1.2 Channel Mix Evolution (2024-2032)
Chapter 8. Regional Market Analysis – Global Overview
- 8.1 Global Regional Overview
- 8.1.1 Regional Volume Share (Volume Where Applicable)
- 8.1.2 Regional Revenue Share
- 8.1.3 Regional Volume by Region (Volume Where Applicable)
- 8.1.4 Regional Revenue by Region
- 8.1.5 Regional Forecast Through 2032
- 8.2 Cross-Regional Segment Analysis
- 8.2.1 By Sales & Delivery Channel
- 8.2.2 By Competitive Positioning & Price Tier
Chapter 9. North America Sensitive Skin Care Products Market
- 9.1 United States
- 9.2 Canada
- 9.3 Mexico
Chapter 10. Europe Sensitive Skin Care Products Market
- 10.1 Germany
- 10.2 France
- 10.3 Italy
- 10.4 United Kingdom
- 10.5 Spain
- 10.6 Poland
- 10.7 Russia
- 10.8 Netherlands
- 10.9 Belgium
- 10.10 Sweden
- 10.11 Denmark
- 10.12 Norway
- 10.13 Rest of Europe
Chapter 11. Asia Pacific Sensitive Skin Care Products Market
- 11.1 China
- 11.2 India
- 11.3 Japan
- 11.4 South Korea
- 11.5 Thailand
- 11.6 Indonesia
- 11.7 Vietnam
- 11.8 Malaysia
- 11.9 Australia
- 11.10 Rest of Asia Pacific
Chapter 12. Latin America Sensitive Skin Care Products Market
- 12.1 Brazil
- 12.2 Argentina
- 12.3 Colombia
- 12.4 Chile
- 12.5 Rest of Latin America
Chapter 13. Middle East Sensitive Skin Care Products Market
- 13.1 Saudi Arabia
- 13.2 United Arab Emirates
- 13.3 Turkey
- 13.4 Israel
- 13.5 Iran
- 13.6 Rest of the Middle East
Chapter 14. Africa Sensitive Skin Care Products Market
- 14.1 South Africa
- 14.2 Egypt
- 14.3 Nigeria
- 14.4 Morocco
- 14.5 Rest of Africa
Chapter 15. Sensitive Skin Care Products Company Profiles
- 15.1 [Company 01]
- 15.1.1 Company Overview
- 15.1.2 Key Management Personnel
- 15.1.3 Products & Services Portfolio
- 15.1.4 Financial Performance
- 15.1.5 Key Market Focus & Geographic Presence
- 15.1.6 Recent Developments & Strategic Initiatives
Note: The company profile list is preliminary and may change based on research findings, market developments, data availability, and client requirements.
Chapter 16. Appendices
- Appendix A – List of Abbreviations & Acronyms
- Appendix B – Industry Classification Code Reference – Full Series
- Appendix C – Supply, Output & Operating Capacity Data Tables
- Appendix D – End-Use & Demand Base Tables
- Appendix E – Demand, Adoption & Usage Assumptions
- Appendix F – Pricing & Revenue Metric Reference Tables
- Appendix G – Company Operations & Infrastructure Database
- Appendix H – Cross-Border Trade & Activity Data Tables (Where Applicable)
- Appendix I – Regulatory Summary Tables
- Appendix J – Primary Research Participant List (Anonymized)
- Appendix K – Primary Research Questionnaire Framework
- Appendix L – Data Sources & Bibliography
- Appendix M – Market Size Divergence & Source Comparison
Chapter 17. Research Methodology
- 17.1 Research Framework & Philosophy
- 17.2 Secondary Research – Sources, Hierarchy & Data Extraction
- 17.3 Data Modeling – Bottom-Up & Top-Down Market Sizing
- 17.4 Primary Research – Stakeholder Framework, LOI & Sample Sizes
- 17.5 Forecast Methodology – Regression, Scenario & Sensitivity Analysis
- 17.6 Quality Control – Four-Layer Validation Framework
- 17.7 Limitations & Standard Assumptions
- 17.8 Disclaimer
