Home » Healthcare » Single Use Assemblies Market

Single Use Assemblies Market

Single Use Assemblies Market By Product Segment (Bag Assemblies, Filtration Assemblies, Bottle Assemblies, Tubing Assemblies, Others); By Solution Segment (Standard Solutions, Customized Solutions); By Applications Segment (Cell Culture & Mixing, Filtration & Purifications, Storage Applications, Formulation and Fill-Finish Application, Others); By End-User Segment (Pharmaceutical & Biopharmaceutical Companies, Contract Research & Contract Manufacturing Organizations, Academics & Research Institutes) – Growth, Share, Opportunities & Competitive Analysis, 2024 – 2032

Price: $4699

Published: | Report ID: 88795 | Report Format : Excel, PDF
REPORT ATTRIBUTE DETAILS
Historical Period 2020-2023
Base Year 2024
Forecast Period 2025-2032
Single Use Assemblies Market Size 2023 USD 2,480.91 million
Single Use Assemblies Market, CAGR 12.2%
Single Use Assemblies Market Size 2032 USD 6,991.12 million


Market Overview:

Global Single Use Assemblies Market size was valued at USD 2,480.91 million in 2023 and is anticipated to reach USD 6,991.12 million by 2032, at a CAGR of 12.2% during the forecast period (2023-2032).

Several factors contribute to the accelerated growth of the single-use assemblies market. A primary driver is the burgeoning demand for biologics and biosimilars, which necessitate scalable and flexible manufacturing solutions. Single-use assemblies, including bag, filtration, and mixing system assemblies, are increasingly favored for their adaptability in various stages of bioprocessing. Additionally, the rise of contract development and manufacturing organizations (CDMOs), startups, and small to medium-sized enterprises (SMEs) has spurred the adoption of single-use technologies due to their cost-effectiveness and rapid implementation capabilities. Technological advancements, such as the integration of sensors and automation in single-use systems, further enhance their appeal by improving process monitoring and control.

Regionally, North America holds the largest share of the single-use assemblies market, accounting for over 35.7% in 2023. This dominance is attributed to the presence of leading biopharmaceutical companies, a well-established regulatory framework, and substantial investments in research and development. Europe follows as a significant market, driven by stringent regulatory standards and a strong emphasis on quality assurance in pharmaceutical manufacturing. The Asia-Pacific region is poised for the fastest growth, with countries like China, India, Japan, and South Korea expanding their biopharmaceutical industries and increasing investments in healthcare infrastructure. Emerging markets in Latin America, the Middle East, and Africa are also witnessing a gradual shift towards single-use technologies, propelled by the need for cost-effective and efficient manufacturing solutions.

Design Element 2

Access crucial information at unmatched prices!

Request your sample report today & start making informed decisions powered by Credence Research!

Download Sample

CTA Design Element 3

Market Insights:

  • The Global Single-Use Assemblies Market was valued at USD 2,480.91 million in 2023 and is expected to reach USD 6,991.12 million by 2032, growing at a CAGR of 12.2% from 2023 to 2032.
  • The increasing demand for biologics and biosimilars is a key driver, as single-use technologies offer flexible and scalable manufacturing solutions, particularly for the production of monoclonal antibodies and gene therapies.
  • Single-use assemblies are gaining preference due to their cost-effectiveness, as they eliminate the need for cleaning, sterilization, and validation, lowering operational and capital expenditures for small and medium-sized enterprises (SMEs) and contract manufacturing organizations (CMOs).
  • Technological advancements, including the integration of sensors and automation, are improving the flexibility, efficiency, and control of biopharmaceutical production, making single-use systems increasingly attractive for manufacturers.
  • The rise of contract development and manufacturing organizations (CDMOs) is boosting market growth, as CDMOs adopt single-use assemblies to provide scalable and cost-effective solutions for biologics production.
  • High initial investment costs remain a challenge, especially for SMEs, as the upfront costs for purchasing, installing, and validating single-use systems can be substantial.
  • Environmental concerns related to plastic waste from disposable components are increasing, pushing manufacturers to adopt sustainable practices and develop recyclable or biodegradable materials for single-use systems.

Report Scope

This report segments the Single Use Assemblies Market as follow

Single Use Assemblies Market

Market Drivers:

Growing Demand for Biologics and Biosimilars

The increasing demand for biologics and biosimilars is one of the primary drivers of the global single-use assemblies market. Biologics are complex, high-value drugs that require sophisticated manufacturing processes, while biosimilars are gaining traction as cost-effective alternatives. For instance, in the United States, the monoclonal antibodies segment accounted for the largest share of the single-use assemblies market, reflecting the growing use of these systems in mAb production due to lower capital investments, reduced workforce requirements, and faster changeover procedures. The need for scalable, flexible, and efficient production methods has led to the widespread adoption of single-use technologies in biopharmaceutical manufacturing. Single-use assemblies, such as disposable bioreactors, filtration units, and mixing systems, enable faster production turnaround times and reduce the risk of cross-contamination, making them ideal for biologics production. As the market for biologics continues to expand, particularly for monoclonal antibodies and gene therapies, the demand for single-use systems is expected to remain strong.

Cost-Effectiveness and Reduced Risk of Contamination

Single-use assemblies provide significant cost benefits over traditional stainless-steel systems. By eliminating the need for cleaning, sterilization, and validation, single-use technologies lower operational and capital expenditures, making them more affordable, especially for small and medium-sized enterprises (SMEs) and contract manufacturing organizations (CMOs). These systems also reduce the risk of cross-contamination, which is critical in biopharmaceutical manufacturing. For example, Merck KGaA invested approximately USD 14 million in 2024 to expand its M Lab Collaboration Center in Shanghai, China, adding new biology application and process development labs that utilize single-use assemblies for efficient bioprocessing. Contamination risk is minimized by using sterile, disposable components that are discarded after each use, thereby ensuring the production of high-quality products. The reduction in cleaning validation and downtime between production runs further contributes to cost savings and operational efficiency.

Technological Advancements in Single-Use Systems

Technological innovations in single-use assemblies are transforming the bioprocessing landscape. The integration of sensors, automation, and real-time process monitoring into single-use systems enhances the reliability, efficiency, and flexibility of biopharmaceutical manufacturing. These technological advancements allow for greater control over production parameters such as temperature, pressure, and pH levels, ensuring the consistency and quality of the final product. Additionally, the use of integrated software and data analytics tools provides real-time insights into the production process, enabling manufacturers to optimize their operations, reduce cycle times, and improve yield. As these technologies continue to evolve, single-use systems are becoming an increasingly attractive option for biopharmaceutical companies.

Expansion of Contract Development and Manufacturing Organizations (CDMOs)

The rise of contract development and manufacturing organizations (CDMOs) has significantly boosted the adoption of single-use assemblies in the biopharmaceutical sector. CDMOs provide outsourced services for drug development and manufacturing, enabling companies to access specialized expertise and scale production quickly without making significant capital investments. As more biopharmaceutical companies turn to CDMOs for support in manufacturing biologics and biosimilars, the demand for flexible, scalable, and cost-effective solutions like single-use assemblies has surged. These organizations often rely on single-use technologies to meet the growing demand for drug products while ensuring compliance with stringent regulatory standards. The rapid expansion of CDMOs, particularly in emerging markets, will continue to drive the growth of the global single-use assemblies market.

Market Trends:

Advancements in Single-Use Assembly Technologies

The global single-use assemblies market is witnessing significant technological advancements that are enhancing the efficiency and versatility of biopharmaceutical manufacturing processes. Innovations include the development of pre-assembled, gamma-irradiated systems that are ready-to-use, reducing setup times and minimizing the risk of contamination. These advancements enable manufacturers to streamline operations and improve product quality. For instance, Sartorius Stedim Biotech notes that single-use bioreactors up to 2000-L scale are now widely used, offering increased flexibility for processes requiring up to 1000 kg of product per year, and supporting a wide variety of molecules such as antibodies, proteins, vaccines, cell therapies, and gene therapies. Additionally, the integration of automation and real-time monitoring capabilities into single-use systems allows for better process control and data analytics, facilitating more precise and consistent production outcomes. As these technologies continue to evolve, they are expected to further drive the adoption of single-use assemblies across the industry.

Customization and Integration of Single-Use Systems

There is a growing trend towards the customization and integration of single-use assemblies to meet the specific needs of biopharmaceutical manufacturers. Customized solutions offer tailored configurations that optimize the production process, enhancing efficiency and reducing costs. This trend is particularly evident among contract development and manufacturing organizations (CDMOs) and small to medium-sized enterprises (SMEs), which require flexible and scalable manufacturing solutions. The ability to integrate single-use systems with existing infrastructure and processes further supports this trend, allowing for seamless transitions and minimizing disruptions during implementation. For instance, Aptar Pharma expanded its manufacturing capacity in North America in April 2024, specifically to meet the growing demand for proprietary single-use systems that can be customized for various applications. As the demand for personalized and adaptable manufacturing solutions increases, the market for customized single-use assemblies is expected to expand.

Sustainability Initiatives and Environmental Considerations

Sustainability is becoming an increasingly important consideration in the single-use assemblies market. The growing environmental concerns associated with the disposal of plastic-based disposable components are prompting manufacturers to explore more sustainable alternatives. Initiatives include the development of recyclable and biodegradable materials for single-use systems, as well as the implementation of circular economy practices such as energy recovery through incineration. These efforts aim to reduce the environmental impact of single-use technologies while maintaining their performance and safety standards. Regulatory bodies are also placing greater emphasis on the environmental aspects of single-use systems, encouraging the adoption of sustainable practices within the industry.

Expansion into Emerging Markets

The single-use assemblies market is experiencing significant growth in emerging markets, driven by increased investments in healthcare infrastructure and the expansion of biopharmaceutical manufacturing capabilities. Countries in regions such as Asia-Pacific, Latin America, and the Middle East are increasingly adopting single-use technologies to enhance the efficiency and scalability of their manufacturing processes. The adoption of single-use assemblies in these regions is facilitated by their cost-effectiveness, ease of implementation, and ability to meet the growing demand for biologics and biosimilars. As these markets continue to develop, the demand for single-use assemblies is expected to rise, contributing to the global market expansion.

Market Challenges Analysis:

High Initial Investment Costs

One of the key restraints in the global single-use assemblies market is the high initial investment required for the adoption of single-use technologies. While these systems offer cost-saving benefits in terms of reduced cleaning and sterilization requirements, the upfront costs for purchasing, installing, and validating single-use systems can be substantial. For small to medium-sized enterprises (SMEs) and biopharmaceutical companies with limited capital, this can pose a significant barrier to entry. Additionally, the need for ongoing maintenance and replacement of single-use components adds to the financial burden. As a result, the high initial costs of adopting these technologies may hinder market growth, especially in price-sensitive regions.

Environmental Impact Concerns

Another challenge facing the single-use assemblies market is the growing concern about the environmental impact of disposable plastic components. The accumulation of plastic waste from single-use systems has led to heightened scrutiny from regulatory bodies, environmental organizations, and consumers. Despite the benefits of these technologies in terms of efficiency and flexibility, the disposal of plastic-based products raises sustainability issues. While there are ongoing efforts to develop biodegradable and recyclable materials, the environmental concerns surrounding plastic waste remain a challenge for the industry. Manufacturers are under increasing pressure to adopt more sustainable practices, which could require significant investment in research and development and may slow the growth of the market.

Regulatory Compliance and Standardization Issues

The lack of standardized regulatory guidelines across different regions poses a challenge for the global adoption of single-use assemblies. As the market expands, ensuring compliance with stringent regulatory requirements is crucial for maintaining product quality and safety. The absence of consistent global standards for single-use systems can complicate manufacturing processes, especially for companies that operate in multiple regions.  For instance, companies like Cytiva note that, in the absence of specific single-use regulatory guidelines, biomanufacturers must take different approaches to ensure product quality and safety, often leading to increased complexity and resource demands for companies operating internationally. Additionally, regulatory bodies in some countries may have varying requirements for the validation and qualification of single-use systems, further hindering market expansion. The need for more unified standards is essential for streamlining operations and facilitating the widespread adoption of single-use technologies.

Market Opportunities:

The global single-use assemblies market presents significant opportunities driven by the increasing demand for efficient and cost-effective biopharmaceutical manufacturing solutions. As the production of biologics and biosimilars continues to expand, biopharmaceutical companies are increasingly adopting single-use systems for their ability to streamline operations and reduce operational costs. The flexibility of single-use assemblies, combined with their capacity to scale production quickly, positions them as an ideal solution for meeting the growing demand for customized drugs and smaller production runs. This trend is particularly advantageous for contract manufacturing organizations (CMOs) and small to medium-sized enterprises (SMEs), which require adaptable, high-performance solutions that minimize upfront investments. Additionally, the integration of advanced technologies such as sensors and automation into single-use systems offers opportunities for improving process control and increasing productivity.

Another key opportunity lies in the expanding presence of single-use technologies in emerging markets. With increasing investments in healthcare infrastructure, particularly in regions like Asia-Pacific, Latin America, and the Middle East, the demand for efficient manufacturing solutions is on the rise. The adoption of single-use assemblies in these markets is spurred by the need to meet the rising demand for biologics and biosimilars, while maintaining flexibility and reducing costs. As these regions continue to develop their biopharmaceutical manufacturing capabilities, single-use systems will play a pivotal role in driving industry growth. Moreover, with an increasing focus on sustainability, opportunities for developing eco-friendly and recyclable single-use technologies further enhance the market’s growth potential.

Market Segmentation Analysis:

The global single-use assemblies market is segmented across various categories, including product type, solution type, application, and end-user segments, each contributing to its growth and evolution.

By Product Segment:
The product segment includes Bag Assemblies, Filtration Assemblies, Bottle Assemblies, Tubing Assemblies, and Others. Bag Assemblies hold a significant market share, driven by their versatile applications in biopharmaceutical manufacturing. Filtration Assemblies are widely adopted for their role in separating unwanted materials, making them integral to the bioprocessing industry. Bottle Assemblies and Tubing Assemblies provide critical components for the safe transportation and containment of fluids during production. The “Others” category encompasses various specialized solutions tailored to specific manufacturing needs.

By Solution Segment:
This segment divides into Standard and Customized Solutions. Standard Solutions are typically cost-effective and suitable for large-scale manufacturing, while Customized Solutions are increasingly in demand due to their flexibility in meeting specific production needs and improving process efficiency.

By Applications Segment:
Key applications include Cell Culture & Mixing, Filtration & Purifications, Storage Applications, and Formulation and Fill-Finish Applications. The growing need for efficient cell culture and mixing systems in the biopharmaceutical sector propels the demand for single-use assemblies. Filtration & Purification is crucial for maintaining product quality and purity, while Storage Applications and Formulation & Fill-Finish Applications are critical for the final stages of biopharmaceutical production.

By End-User Segment:
The market caters to Pharmaceutical & Biopharmaceutical Companies, Contract Research & Contract Manufacturing Organizations, and Academics & Research Institutes. Pharmaceutical companies are the largest consumers, followed by CDMOs and research institutions, which benefit from the flexibility and cost-efficiency of single-use assemblies in their processes.

Segmentation:

By Product Segment:

  • Bag Assemblies
  • Filtration Assemblies
  • Bottle Assemblies
  • Tubing Assemblies
  • Others

By Solution Segment:

  • Standard Solutions
  • Customized Solutions

By Applications Segment:

  • Cell Culture & Mixing
  • Filtration & Purifications
  • Storage Applications
  • Formulation and Fill-Finish Application
  • Others

By End-User Segment:

  • Pharmaceutical & Biopharmaceutical Companies
  • Contract Research & Contract Manufacturing Organizations
  • Academics & Research Institutes

Regional Analysis:

The global single-use assemblies market is characterized by significant growth across various regions, with North America holding the largest market share, followed by Europe and the Asia-Pacific (APAC) region. These regions exhibit distinct growth dynamics driven by technological advancements, increasing demand for biopharmaceuticals, and growing healthcare infrastructure.

North America

North America leads the global single-use assemblies market, accounting for over 35% of the market share in 2023. The market in this region is driven by the presence of major biopharmaceutical companies, robust healthcare infrastructure, and significant investments in research and development (R&D). The United States, in particular, has been at the forefront of adopting advanced bioprocessing technologies, including single-use systems. These systems are extensively used in the production of biologics and biosimilars, helping companies meet the growing demand for personalized medicine. The regulatory framework in North America is well-established, providing a favorable environment for the adoption of new technologies. As the need for biologic drugs continues to rise, the demand for single-use assemblies is expected to grow, further strengthening North America’s market position.

Europe

Europe holds the second-largest market share, accounting for around 30% of the global single-use assemblies market. The market in Europe is driven by the strong presence of biopharmaceutical manufacturers, especially in countries like Germany, France, and Switzerland. These countries are known for their advanced pharmaceutical manufacturing capabilities and have been quick to adopt single-use technologies due to their efficiency, flexibility, and cost-effectiveness. Additionally, Europe’s stringent regulatory environment ensures the quality and safety of these systems, boosting their adoption. The increasing demand for biologics and the shift towards contract manufacturing organizations (CMOs) in Europe further drive the growth of single-use assemblies in the region.

Asia-Pacific (APAC)

The Asia-Pacific region is witnessing the fastest growth in the single-use assemblies market, The APAC region is expected to capture nearly 20% of the market share by 2030. Key drivers of this growth include the increasing investment in healthcare infrastructure, expanding pharmaceutical manufacturing capabilities, and the rising demand for biologics and biosimilars in countries like China, India, and Japan. The adoption of single-use technologies in these markets is also being fueled by the growing need for flexible and cost-effective production methods. As the biopharmaceutical industry in APAC continues to develop, single-use assemblies are becoming essential for meeting production demands efficiently and economically.

Latin America and Middle East & Africa (MEA)

The Latin America and Middle East & Africa (MEA) regions together account for a smaller share of the global market, but they represent important emerging markets. In Latin America, countries such as Brazil and Mexico are gradually adopting single-use technologies to improve their biopharmaceutical manufacturing processes. Similarly, in the MEA region, growing investments in healthcare infrastructure, particularly in countries like Saudi Arabia and the UAE, are driving the demand for single-use assemblies. Although these regions currently hold a relatively smaller share, they present promising opportunities for market expansion due to their increasing focus on biopharmaceutical manufacturing and the demand for efficient, scalable production systems.

Shape Your Report to Specific Countries or Regions & Enjoy 30% Off!

Key Player Analysis:

  • Thermo Fisher Scientific Inc.
  • Sartorius AG
  • Danaher Corporation
  • Merck KGaA
  • Avantor, Inc.
  • Parker-Hannifin Corporation
  • Saint-Gobain S.A.
  • Repligen Corporation
  • Corning Incorporated
  • Entegris
  • Lonza
  • Zacros Corporation
  • NewAge Industries
  • Cobetter

Competitive Analysis:

The global single-use assemblies market is highly competitive, with key players focusing on technological innovations, strategic partnerships, and market expansion. Leading companies such as Thermo Fisher Scientific, Sartorius AG, Merck Group, and GE Healthcare dominate the market, leveraging their extensive product portfolios and R&D capabilities. These companies offer a wide range of single-use solutions, including bioreactors, filtration systems, and mixing components, designed to improve operational efficiency and flexibility in biopharmaceutical manufacturing. Additionally, companies are focusing on expanding their geographic presence, particularly in emerging markets, to capitalize on the growing demand for biologics and biosimilars. Strategic collaborations, mergers, and acquisitions are common strategies employed by market leaders to strengthen their market position and enhance product offerings. The increasing adoption of automation, real-time process monitoring, and data analytics in single-use systems is further intensifying competition, as companies strive to deliver more efficient and customizable solutions to meet the evolving needs of the biopharmaceutical industry.

Recent Developments:

  • In April 2025, Sartorius AG announced the acquisition of MatTek Corp, including Visikol Inc. This acquisition is significant for the single-use assemblies market because MatTek is a leading developer and manufacturer of advanced 3D microtissue models, which are widely used in cell culture and drug discovery.
  • Thermo Fisher Scientific Inc.’s February 2025 agreement to acquire Solventum’s Purification & Filtration business is relevant to the single-use assemblies market. The acquisition will expand Thermo Fisher’s capabilities in purification and filtration, which are core components of single-use assembly systems for biomanufacturing. By broadening its bioproduction portfolio, Thermo Fisher is positioned to meet the increasing demand for modular, flexible, and contamination-reducing single-use solutions in biologics manufacturing.

Market Concentration & Characteristics:

The global single-use assemblies market exhibits moderate concentration, with a few dominant players holding substantial market shares, while several smaller companies contribute to its competitive landscape. Major industry players such as Thermo Fisher Scientific, Sartorius AG, Merck Group, and GE Healthcare are at the forefront, leveraging their extensive technological expertise and established brand presence. These companies have a global reach and offer a broad range of products, which include bioreactors, filtration systems, and mixing solutions, catering to diverse biopharmaceutical manufacturing needs. The market is characterized by continuous innovation, particularly in areas such as automation, real-time monitoring, and integration of advanced materials. This drives the development of more efficient, flexible, and customizable single-use systems. Additionally, companies are investing in R&D to meet the growing demand for biologics and biosimilars while maintaining a focus on regulatory compliance and sustainability. The market’s dynamic nature fosters both competition and collaboration among key players, ensuring ongoing advancements.

Report Coverage:

The research report offers an in-depth analysis based on Product Segment, Solution Segment, Applications Segment and End User Segment. It details leading market players, providing an overview of their business, product offerings, investments, revenue streams, and key applications. Additionally, the report includes insights into the competitive environment, SWOT analysis, current market trends, as well as the primary drivers and constraints. Furthermore, it discusses various factors that have driven market expansion in recent years. The report also explores market dynamics, regulatory scenarios, and technological advancements that are shaping the industry. It assesses the impact of external factors and global economic changes on market growth. Lastly, it provides strategic recommendations for new entrants and established companies to navigate the complexities of the market.

Future Outlook:

  • The global single-use assemblies market is expected to continue its strong growth, driven by the increasing demand for biologics and biosimilars.
  • Technological advancements, including automation and real-time monitoring, will enhance the efficiency and flexibility of single-use systems.
  • The market will see increased adoption in emerging regions, particularly Asia-Pacific, as healthcare infrastructure expands.
  • A rising trend towards sustainable, recyclable, and biodegradable materials will address environmental concerns related to single-use plastics.
  • Contract manufacturing organizations (CMOs) will continue to drive demand for scalable, cost-effective single-use solutions.
  • Partnerships and collaborations between key players will foster product innovations and expand geographic reach.
  • The development of more customizable single-use assemblies will meet the specific needs of biopharmaceutical manufacturers.
  • Regulatory standards will evolve, influencing the design and adoption of single-use technologies in various regions.
  • Small to medium-sized enterprises (SMEs) will increasingly adopt single-use systems to remain competitive and meet production demands.
  • Integration with digital technologies and data analytics will enable manufacturers to optimize production processes and improve decision-making.

CHAPTER NO. 1 : INTRODUCTION 28

1.1.1. Report Description 28

Purpose of the Report 28

USP & Key Product 28

1.1.2. Key Benefits for Stakeholders 28

1.1.3. Target Audience 29

1.1.4. Report Scope 29

1.1.5. Regional Scope 30

CHAPTER NO. 2 : EXECUTIVE SUMMARY 31

2.1. Single Use Assemblies Market Snapshot 31

2.1.1. Global Single Use Assemblies Market, 2018 – 2032 (USD Million) 32

CHAPTER NO. 3 : GEOPOLITICAL CRISIS IMPACT ANALYSIS 33

3.1. Russia-Ukraine and Israel-Palestine War Impacts 33

CHAPTER NO. 4 : SINGLE USE ASSEMBLIES MARKET – INDUSTRY ANALYSIS 34

4.1. Introduction 34

4.2. Market Drivers 35

4.2.1. Driving Factor 1 Analysis 35

4.2.2. Driving Factor 2 Analysis 36

4.3. Market Restraints 37

4.3.1. Restraining Factor Analysis 37

4.4. Market Opportunities 38

4.4.1. Market Opportunities Analysis 38

4.5. Porter’s Five Force analysis 39

4.6. Value Chain Analysis 40

4.7. Buying Criteria 41

CHAPTER NO. 5 : ANALYSIS COMPETITIVE LANDSCAPE 42

5.1. Company Market Share Analysis – 2023 42

5.1.1. Global Single Use Assemblies Market: Company Market Share, by Revenue, 2023 42

5.1.2. Global Single Use Assemblies Market: Top 6 Company Market Share, by Revenue, 2023 42

5.1.3. Global Single Use Assemblies Market: Top 3 Company Market Share, by Revenue, 2023 43

5.2. Global Single Use Assemblies Market Company Revenue Market Share, 2023 44

5.3. Company Assessment Metrics, 2023 44

5.3.1. Stars 44

5.3.2. Emerging Leaders 45

5.3.3. Pervasive Players 45

5.3.4. Participants 45

5.4. Start-ups /Code Assessment Metrics, 2023 45

5.4.1. Progressive Companies 45

5.4.2. Responsive Companies 45

5.4.3. Dynamic Companies 45

5.4.4. Starting Blocks 45

5.5. Strategic Developments 46

5.5.1. Acquisition & Mergers 46

New Product Launch 46

Regional Expansion 46

5.6. Key Players Product Matrix 47

CHAPTER NO. 6 : PESTEL & ADJACENT MARKET ANALYSIS 48

6.1. PESTEL 48

6.1.1. Political Factors 48

6.1.2. Economic Factors 48

6.1.3. Social Factors 48

6.1.4. Technological Factors 48

6.1.5. Environmental Factors 48

6.1.6. Legal Factors 48

6.2. Adjacent Market Analysis 48

CHAPTER NO. 7 : SINGLE USE ASSEMBLIES MARKET – BY PRODUCT SEGMENT ANALYSIS 49

7.1. Single Use Assemblies Market Overview, by Product Segment 49

7.1.1. Single Use Assemblies Market Revenue Share, By Product, 2023 & 2032 50

7.1.2. Single Use Assemblies Market Attractiveness Analysis, By Product 51

7.1.3. Incremental Revenue Growth Opportunities, by Product, 2024 – 2032 51

7.1.4. Single Use Assemblies Market Revenue, By Product, 2018, 2023, 2027 & 2032 52

7.2. Bag Assemblies 53

7.2.1. Global Single Use Assemblies Market Revenue for Bag Assemblies, By Region, 2018 – 2023 (USD Million) 54

7.2.2. Global Single Use Assemblies Market Revenue for Bag Assemblies, By Region, 2024 – 2032 (USD Million) 54

7.3. Filtration Assemblies 55

7.3.1. Global Single Use Assemblies Market Revenue for Filtration Assemblies, By Region, 2018 – 2023 (USD Million) 56

7.3.2. Global Single Use Assemblies Market Revenue for Filtration Assemblies, By Region, 2024 – 2032 (USD Million) 56

7.4. Bottle Assemblies 57

7.4.1. Global Single Use Assemblies Market Revenue for Bottle Assemblies, By Region, 2018 – 2023 (USD Million) 58

7.4.2. Global Single Use Assemblies Market Revenue for Bottle Assemblies, By Region, 2024 – 2032 (USD Million) 58

7.5. Tubing Assemblies 58

7.5.1. Global Single Use Assemblies Market Revenue for Tubing Assemblies, By Region, 2018 – 2023 (USD Million) 60

7.5.2. Global Single Use Assemblies Market Revenue for Tubing Assemblies, By Region, 2024 – 2032 (USD Million) 60

7.6. Others 61

7.6.1. Global Single Use Assemblies Market Revenue for Others, By Region, 2018 – 2023 (USD Million) 62

7.6.2. Global Single Use Assemblies Market Revenue for Others, By Region, 2024 – 2032 (USD Million) 62

CHAPTER NO. 8 : SINGLE USE ASSEMBLIES MARKET – BY SOLUTION SEGMENT ANALYSIS 63

8.1. Single Use Assemblies Market Overview, by Solution Segment 63

8.1.1. Single Use Assemblies Market Revenue Share, By Solution, 2023 & 2032 64

8.1.2. Single Use Assemblies Market Attractiveness Analysis, By Solution 65

8.1.3. Incremental Revenue Growth Opportunities, by Solution, 2024 – 2032 65

8.1.4. Single Use Assemblies Market Revenue, By Solution, 2018, 2023, 2027 & 2032 66

8.2. Standard Solutions 67

8.2.1. Global Articulated Single Use Assemblies Market Revenue, By Region, 2018 – 2023 (USD Million) 68

8.2.2. Global Articulated Single Use Assemblies Market Revenue, By Region, 2024 – 2032 (USD Million) 68

8.3. Customized Solutions 69

8.3.1. Global Linear Single Use Assemblies Market Revenue, By Region, 2018 – 2023 (USD Million) 70

8.3.2. Global Linear Single Use Assemblies Market Revenue, By Region, 2024 – 2032 (USD Million) 70

CHAPTER NO. 9 : SINGLE USE ASSEMBLIES MARKET – BY APPLICATIONS SEGMENT ANALYSIS 71

9.1. Single Use Assemblies Market Overview, by Applications Segment 71

9.1.1. Single Use Assemblies Market Revenue Share, By Applications, 2023 & 2032 72

9.1.2. Single Use Assemblies Market Attractiveness Analysis, By Applications 73

9.1.3. Incremental Revenue Growth Opportunities, by Applications, 2024 – 2032 73

9.1.4. Single Use Assemblies Market Revenue, By Applications, 2018, 2023, 2027 & 2032 74

9.2. Cell culture & Mixing 75

9.2.1. Global Single Use Assemblies Market for Cell culture & Mixing Revenue, By Region, 2018 – 2023 (USD Million) 76

9.2.2. Global Single Use Assemblies Market for Cell culture & Mixing Revenue, By Region, 2024 – 2032 (USD Million) 76

9.3. Filtration & Purifications 77

9.3.1. Global Single Use Assemblies Market for Filtration & Purifications Revenue, By Region, 2018 – 2023 (USD Million) 78

9.3.2. Global Single Use Assemblies Market for Filtration & Purifications Revenue, By Region, 2024 – 2032 (USD Million) 78

9.4. Storage Applications 79

9.4.1. Global Single Use Assemblies Market for Storage Applications  Revenue, By Region, 2018 – 2023 (USD Million) 80

9.4.2. Global Single Use Assemblies Market for Storage Applications  Revenue, By Region, 2024 – 2032 (USD Million) 80

9.5. Formulation and Fill-Finish Application 81

9.5.1. Global Single Use Assemblies Market for Formulation and Fill-Finish Application  Revenue, By Region, 2018 – 2023 (USD Million) 82

9.5.2. Global Single Use Assemblies Market for Formulation and Fill-Finish Application  Revenue, By Region, 2024 – 2032 (USD Million) 82

9.6. Others 83

9.6.1. Global Single Use Assemblies Market for Others Revenue, By Region, 2018 – 2023 (USD Million) 84

9.6.2. Global Single Use Assemblies Market for Others Revenue, By Region, 2024 – 2032 (USD Million) 84

CHAPTER NO. 10 : SINGLE USE ASSEMBLIES MARKET – BY END USER SEGMENT ANALYSIS 85

10.1. Single Use Assemblies Market Overview, by End User Segment 85

10.1.1. Single Use Assemblies Market Revenue Share, By End User, 2023 & 2032 86

10.1.2. Single Use Assemblies Market Attractiveness Analysis, By End User 87

10.1.3. Incremental Revenue Growth Opportunities, by End User, 2024 – 2032 87

10.1.4. Single Use Assemblies Market Revenue, By End User, 2018, 2023, 2027 & 2032 88

10.2. Pharmaceutical & Biopharmaceutical Companies 89

10.2.1. Global Single Use Assemblies Market for Pharmaceutical & Biopharmaceutical Companies Revenue, By Region, 2018 – 2023 (USD Million) 90

10.2.2. Global Single Use Assemblies Market for Pharmaceutical & Biopharmaceutical Companies Revenue, By Region, 2024 – 2032 (USD Million) 90

10.3. Contract Research & Contract Manufacturing Organization 91

10.3.1. Global Single Use Assemblies Market for Contract Research & Contract Manufacturing Organization Revenue, By Region, 2018 – 2023 (USD Million) 92

10.3.2. Global Single Use Assemblies Market for Contract Research & Contract Manufacturing Organization Revenue, By Region, 2024 – 2032 (USD Million) 92

10.4. Academics & Research Institute 93

10.4.1. Global Single Use Assemblies Market for Academics & Research Institute Revenue, By Region, 2018 – 2023 (USD Million) 94

10.4.2. Global Single Use Assemblies Market for Academics & Research Institute Revenue, By Region, 2024 – 2032 (USD Million) 94

CHAPTER NO. 11 : SINGLE USE ASSEMBLIES MARKET – REGIONAL ANALYSIS 95

11.1. Single Use Assemblies Market Overview, by Regional Segments 95

11.2. Region 96

11.2.1. Global Single Use Assemblies Market Revenue Share, By Region, 2023 & 2032 96

11.2.2. Single Use Assemblies Market Attractiveness Analysis, By Region 97

11.2.3. Incremental Revenue Growth Opportunities, by Region, 2024 – 2032 97

11.2.4. Single Use Assemblies Market Revenue, By Region, 2018, 2023, 2027 & 2032 98

11.2.5. Global Single Use Assemblies Market Revenue, By Region, 2018 – 2023 (USD Million) 99

11.2.6. Global Single Use Assemblies Market Revenue, By Region, 2024 – 2032 (USD Million) 99

11.3. Product 100

11.4. Global Single Use Assemblies Market Revenue, By Product, 2018 – 2023 (USD Million) 100

11.5. Global Single Use Assemblies Market Revenue, By Product, 2024 – 2032 (USD Million) 100

11.6. Solution 101

11.7. Global Single Use Assemblies Market Revenue, By Solution, 2018 – 2023 (USD Million) 101

11.7.1. Global Single Use Assemblies Market Revenue, By Solution, 2024 – 2032 (USD Million) 101

11.8. Applications 102

11.9. Global Single Use Assemblies Market Revenue, By Applications, 2018 – 2023 (USD Million) 102

11.9.1. Global Single Use Assemblies Market Revenue, By Applications, 2024 – 2032 (USD Million) 102

11.10. End User 103

11.10.1. Global Single Use Assemblies Market Revenue, By End User, 2018 – 2023 (USD Million) 103

11.10.2. Global Single Use Assemblies Market Revenue, By End User, 2024 – 2032 (USD Million) 103

CHAPTER NO. 12 : SINGLE USE ASSEMBLIES MARKET – NORTH AMERICA 104

12.1. North America 104

12.1.1. Key Highlights 104

12.1.2. North America Single Use Assemblies Market Revenue, By Country, 2018 – 2023 (USD Million) 105

12.2. Product 106

12.3. North America Single Use Assemblies Market Revenue, By Product, 2018 – 2023 (USD Million) 106

12.4. Global Single Use Assemblies Market Revenue, By Product, 2024 – 2032 (USD Million) 106

12.5. Solution 107

12.6. North America Single Use Assemblies Market Revenue, By Solution, 2018 – 2023 (USD Million) 107

12.6.1. North America Single Use Assemblies Market Revenue, By Solution, 2024 – 2032 (USD Million) 107

12.7. Applications 108

12.8. North America Single Use Assemblies Market Revenue, By Applications, 2018 – 2023 (USD Million) 108

12.8.1. North America Single Use Assemblies Market Revenue, By Applications, 2024 – 2032 (USD Million) 108

12.9. End User 109

12.9.1. North America Single Use Assemblies Market Revenue, By End User, 2018 – 2023 (USD Million) 109

12.9.2. North America Single Use Assemblies Market Revenue, By End User, 2024 – 2032 (USD Million) 109

12.10. U.S. 110

12.11. Canada 110

12.12. Mexico 110

CHAPTER NO. 13 : SINGLE USE ASSEMBLIES MARKET – EUROPE 111

13.1. Europe 111

13.1.1. Key Highlights 111

13.1.2. Europe Single Use Assemblies Market Revenue, By Country, 2018 – 2023 (USD Million) 112

13.2. Product 113

13.3. Europe Single Use Assemblies Market Revenue, By Product, 2018 – 2023 (USD Million) 113

13.4. Europe Single Use Assemblies Market Revenue, By Product, 2024 – 2032 (USD Million) 113

13.5. Solution 114

13.6. Europe Single Use Assemblies Market Revenue, By Solution, 2018 – 2023 (USD Million) 114

13.6.1. Europe Single Use Assemblies Market Revenue, By Solution, 2024 – 2032 (USD Million) 114

13.7. Applications 115

13.8. Europe Single Use Assemblies Market Revenue, By Applications, 2018 – 2023 (USD Million) 115

13.8.1. Europe Single Use Assemblies Market Revenue, By Applications, 2024 – 2032 (USD Million) 115

13.9. End User 116

13.9.1. Europe Single Use Assemblies Market Revenue, By End User, 2018 – 2023 (USD Million) 116

13.9.2. Europe Single Use Assemblies Market Revenue, By End User, 2024 – 2032 (USD Million) 116

13.10. UK 117

13.11. France 117

13.12. Germany 117

13.13. Italy 117

13.14. Spain 117

13.15. Russia 117

13.16. Belgium 117

13.17. Netherland 117

13.18. Austria 117

13.19. Sweden 117

13.20. Poland 117

13.21. Denmark 117

13.22. Switzerland 117

13.23. Rest of Europe 117

CHAPTER NO. 14 : SINGLE USE ASSEMBLIES MARKET – ASIA PACIFIC 118

14.1. Asia Pacific 118

14.1.1. Key Highlights 118

14.1.2. Asia Pacific Single Use Assemblies Market Revenue, By Country, 2018 – 2023 (USD Million) 119

14.2. Product 120

14.3. Asia Pacific Single Use Assemblies Market Revenue, By Product, 2018 – 2023 (USD Million) 120

14.4. Asia Pacific Single Use Assemblies Market Revenue, By Product, 2024 – 2032 (USD Million) 120

14.5. Solution 121

14.6. Asia Pacific Single Use Assemblies Market Revenue, By Solution, 2018 – 2023 (USD Million) 121

14.6.1. Asia Pacific Single Use Assemblies Market Revenue, By Solution, 2024 – 2032 (USD Million) 121

14.7. Applications 122

14.8. Asia Pacific Single Use Assemblies Market Revenue, By Applications, 2018 – 2023 (USD Million) 122

14.8.1. Asia Pacific Single Use Assemblies Market Revenue, By Applications, 2024 – 2032 (USD Million) 122

14.9. End User 123

14.9.1. Asia Pacific Single Use Assemblies Market Revenue, By End User, 2018 – 2023 (USD Million) 123

14.9.2. Asia Pacific Single Use Assemblies Market Revenue, By End User, 2024 – 2032 (USD Million) 123

14.10. China 124

14.11. Japan 124

14.12. South Korea 124

14.13. India 124

14.14. Australia 124

14.15. Thailand 124

14.16. Indonesia 124

14.17. Vietnam 124

14.18. Malaysia 124

14.19. Philippines 124

14.20. Taiwan 124

14.21. Rest of Asia Pacific 124

CHAPTER NO. 15 : SINGLE USE ASSEMBLIES MARKET – LATIN AMERICA 125

15.1. Latin America 125

15.1.1. Key Highlights 125

15.1.2. Latin America Single Use Assemblies Market Revenue, By Country, 2018 – 2023 (USD Million) 126

15.2. Product 127

15.3. Latin America Single Use Assemblies Market Revenue, By Product, 2018 – 2023 (USD Million) 127

15.4. Latin America Single Use Assemblies Market Revenue, By Product, 2024 – 2032 (USD Million) 127

15.5. Solution 128

15.6. Latin America Single Use Assemblies Market Revenue, By Solution, 2018 – 2023 (USD Million) 128

15.6.1. Latin America Single Use Assemblies Market Revenue, By Solution, 2024 – 2032 (USD Million) 128

15.7. Applications 129

15.8. Latin America Single Use Assemblies Market Revenue, By Applications, 2018 – 2023 (USD Million) 129

15.8.1. Latin America Single Use Assemblies Market Revenue, By Applications, 2024 – 2032 (USD Million) 129

15.9. End User 130

15.9.1. Latin America Single Use Assemblies Market Revenue, By End User, 2018 – 2023 (USD Million) 130

15.9.2. Latin America Single Use Assemblies Market Revenue, By End User, 2024 – 2032 (USD Million) 130

15.10. Brazil 131

15.11. Argentina 131

15.12. Peru 131

15.13. Chile 131

15.14. Colombia 131

15.15. Rest of Latin America 131

CHAPTER NO. 16 : SINGLE USE ASSEMBLIES MARKET – MIDDLE EAST 132

16.1. Middle East 132

16.1.1. Key Highlights 132

16.1.2. Middle East Single Use Assemblies Market Revenue, By Country, 2018 – 2023 (USD Million) 133

16.2. Product 134

16.3. Middle East Single Use Assemblies Market Revenue, By Product, 2018 – 2023 (USD Million) 134

16.4. Middle East Single Use Assemblies Market Revenue, By Product, 2024 – 2032 (USD Million) 134

16.5. Solution 135

16.6. Middle East Single Use Assemblies Market Revenue, By Solution, 2018 – 2023 (USD Million) 135

16.6.1. Middle East Single Use Assemblies Market Revenue, By Solution, 2024 – 2032 (USD Million) 135

16.7. Applications 136

16.8. Middle East Single Use Assemblies Market Revenue, By Applications, 2018 – 2023 (USD Million) 136

16.8.1. Middle East Single Use Assemblies Market Revenue, By Applications, 2024 – 2032 (USD Million) 136

16.9. End User 137

16.9.1. Middle East Single Use Assemblies Market Revenue, By End User, 2018 – 2023 (USD Million) 137

16.9.2. Middle East Single Use Assemblies Market Revenue, By End User, 2024 – 2032 (USD Million) 137

16.10. UAE 138

16.11. KSA 138

16.12. Israel 138

16.13. Turkey 138

16.14. Iran 138

16.15. Rest of Middle East 138

CHAPTER NO. 17 : SINGLE USE ASSEMBLIES MARKET – AFRICA 139

17.1. Africa 139

17.1.1. Key Highlights 139

17.1.2. Africa Single Use Assemblies Market Revenue, By Country, 2018 – 2023 (USD Million) 140

17.2. Product 141

17.3. Africa Single Use Assemblies Market Revenue, By Product, 2018 – 2023 (USD Million) 141

17.4. Africa Single Use Assemblies Market Revenue, By Product, 2024 – 2032 (USD Million) 141

17.5. Solution 142

17.6. Africa Single Use Assemblies Market Revenue, By Solution, 2018 – 2023 (USD Million) 142

17.6.1. Africa Single Use Assemblies Market Revenue, By Solution, 2024 – 2032 (USD Million) 142

17.7. Applications 143

17.8. Africa Single Use Assemblies Market Revenue, By Applications, 2018 – 2023 (USD Million) 143

17.8.1. Africa Single Use Assemblies Market Revenue, By Applications, 2024 – 2032 (USD Million) 143

17.9. End User 144

17.9.1. Africa Single Use Assemblies Market Revenue, By End User, 2018 – 2023 (USD Million) 144

17.9.2. Africa Single Use Assemblies Market Revenue, By End User, 2024 – 2032 (USD Million) 144

17.10. Egypt 145

17.11. Nigeria 145

17.12. Algeria 145

17.13. Morocco 145

17.14. Rest of Africa 145

CHAPTER NO. 18 : COMPANY PROFILES 146

18.1. Thermo Fisher Scientific Inc. 146

18.1.1. Company Overview 146

18.1.2. Product Portfolio 146

18.1.3. Swot Analysis 146

18.1.4. Business Strategy 147

18.1.5. Financial Overview 147

18.2. Sartorius AG 148

18.3. Danaher Corporation 148

18.4. Merck KGaA 148

18.5. Avantor, Inc. 148

18.6. Parker-Hannifin Corporation 148

18.7. Saint-Gobain S.A. 148

18.8. Repligen Corporation 148

18.9. Corning Incorporated. 148

18.10. Entegris 148

18.11. Lonza 148

18.12. Zacros Corporation 148

18.13. NewAge Industries 148

18.14. Cobetter 148

18.15. Others 148

]

List of Figures

FIG NO. 1. Global Single Use Assemblies Market Revenue, 2018 – 2032 (USD Million) 32

FIG NO. 2. Porter’s Five Forces Analysis for Global Single Use Assemblies Market 39

FIG NO. 3. Value Chain Analysis for Global Single Use Assemblies Market 40

FIG NO. 4. Company Share Analysis, 2023 42

FIG NO. 5. Company Share Analysis, 2023 42

FIG NO. 6. Company Share Analysis, 2023 43

FIG NO. 7. Single Use Assemblies Market – Company Revenue Market Share, 2023 44

FIG NO. 8. Single Use Assemblies Market Revenue Share, By Product, 2023 & 2032 50

FIG NO. 9. Market Attractiveness Analysis, By Product 51

FIG NO. 10. Incremental Revenue Growth Opportunities by Product, 2024 – 2032 51

FIG NO. 11. Single Use Assemblies Market Revenue, By Product, 2018, 2023, 2027 & 2032 52

FIG NO. 12. Global Single Use Assemblies Market for Bag Assemblies, Revenue (USD Million) 2018 – 2032 53

FIG NO. 13. Global Single Use Assemblies Market for Filtration Assemblies, Revenue (USD Million) 2018 – 2032 55

FIG NO. 14. Global Single Use Assemblies Market for Bottle Assemblies, Revenue (USD Million) 2018 – 2032 57

FIG NO. 15. Global Single Use Assemblies Market for Tubing Assemblies, Revenue (USD Million) 2018 – 2032 59

FIG NO. 16. Global Single Use Assemblies Market for Others, Revenue (USD Million) 2018 – 2032 61

FIG NO. 17. Single Use Assemblies Market Revenue Share, By Solution, 2023 & 2032 64

FIG NO. 18. Market Attractiveness Analysis, By Solution 65

FIG NO. 19. Incremental Revenue Growth Opportunities by Solution, 2024 – 2032 65

FIG NO. 20. Single Use Assemblies Market Revenue, By Solution, 2018, 2023, 2027 & 2032 66

FIG NO. 21. Global Single Use Assemblies Market for Standard Solutions, Revenue (USD Million) 2018 – 2032 67

FIG NO. 22. Global Single Use Assemblies Market for Customized Solutions, Revenue (USD Million) 2018 – 2032 69

FIG NO. 23. Single Use Assemblies Market Revenue Share, By Applications, 2023 & 2032 72

FIG NO. 24. Market Attractiveness Analysis, By Applications 73

FIG NO. 25. Incremental Revenue Growth Opportunities by Applications, 2024 – 2032 73

FIG NO. 26. Single Use Assemblies Market Revenue, By Applications, 2018, 2023, 2027 & 2032 74

FIG NO. 27. Global Single Use Assemblies Market for Cell culture & Mixing , Revenue (USD Million) 2018 – 2032 75

FIG NO. 28. Global Single Use Assemblies Market for Filtration & Purifications, Revenue (USD Million) 2018 – 2032 77

FIG NO. 29. Global Single Use Assemblies Market for Storage Applications, Revenue (USD Million) 2018 – 2032 79

FIG NO. 30. Global Single Use Assemblies Market for Formulation and Fill-Finish Application , Revenue (USD Million) 2018 – 2032 81

FIG NO. 31. Global Single Use Assemblies Market for Others, Revenue (USD Million) 2018 – 2032 83

FIG NO. 32. Single Use Assemblies Market Revenue Share, By End User, 2023 & 2032 86

FIG NO. 33. Market Attractiveness Analysis, By End User 87

FIG NO. 34. Incremental Revenue Growth Opportunities by End User, 2024 – 2032 87

FIG NO. 35. Single Use Assemblies Market Revenue, By End User, 2018, 2023, 2027 & 2032 88

FIG NO. 36. Global Single Use Assemblies Market for Pharmaceutical & Biopharmaceutical Companies, Revenue (USD Million) 2018 – 2032 89

FIG NO. 37. Global Single Use Assemblies Market for Contract Research & Contract Manufacturing Organization, Revenue (USD Million) 2018 – 2032 91

FIG NO. 38. Global Single Use Assemblies Market for Academics & Research Institute, Revenue (USD Million) 2018 – 2032 93

FIG NO. 39. Global Single Use Assemblies Market Revenue Share, By Region, 2023 & 2032 96

FIG NO. 40. Market Attractiveness Analysis, By Region 97

FIG NO. 41. Incremental Revenue Growth Opportunities by Region, 2024 – 2032 97

FIG NO. 42. Single Use Assemblies Market Revenue, By Region, 2018, 2023, 2027 & 2032 98

FIG NO. 43. North America Single Use Assemblies Market Revenue, 2018 – 2032 (USD Million) 104

FIG NO. 44. Europe Single Use Assemblies Market Revenue, 2018 – 2032 (USD Million) 111

FIG NO. 45. Asia Pacific Single Use Assemblies Market Revenue, 2018 – 2032 (USD Million) 118

FIG NO. 46. Latin America Single Use Assemblies Market Revenue, 2018 – 2032 (USD Million) 125

FIG NO. 47. Middle East Single Use Assemblies Market Revenue, 2018 – 2032 (USD Million) 132

FIG NO. 48. Africa Single Use Assemblies Market Revenue, 2018 – 2032 (USD Million) 139

List of Tables

TABLE NO. 1. : Global Single Use Assemblies Market: Snapshot 31

TABLE NO. 2. : Drivers for the Single Use Assemblies Market: Impact Analysis 35

TABLE NO. 3. : Restraints for the Single Use Assemblies Market: Impact Analysis 37

TABLE NO. 4. : Global Single Use Assemblies Market Revenue for Bag Assemblies, By Region, 2018 – 2023 (USD Million) 54

TABLE NO. 5. : Global Single Use Assemblies Market Revenue for Bag Assemblies, By Region, 2024 – 2032 (USD Million) 54

TABLE NO. 6. : Global Single Use Assemblies Market Revenue for Filtration Assemblies, By Region, 2018 – 2023 (USD Million) 56

TABLE NO. 7. : Global Single Use Assemblies Market Revenue for Filtration Assemblies, By Region, 2024 – 2032 (USD Million) 56

TABLE NO. 8. : Global Single Use Assemblies Market Revenue for Bottle Assemblies, By Region, 2018 – 2023 (USD Million) 58

TABLE NO. 9. : Global Single Use Assemblies Market Revenue for Bottle Assemblies, By Region, 2024 – 2032 (USD Million) 58

TABLE NO. 10. : Global Single Use Assemblies Market Revenue for Tubing Assemblies, By Region, 2018 – 2023 (USD Million) 60

TABLE NO. 11. : Global Single Use Assemblies Market Revenue for Tubing Assemblies, By Region, 2024 – 2032 (USD Million) 60

TABLE NO. 12. : Global Single Use Assemblies Market Revenue for Others, By Region, 2018 – 2023 (USD Million) 62

TABLE NO. 13. : Global Single Use Assemblies Market Revenue for Others, By Region, 2024 – 2032 (USD Million) 62

TABLE NO. 14. : Global Articulated Single Use Assemblies Market Revenue, By Region, 2018 – 2023 (USD Million) 68

TABLE NO. 15. : Global Articulated Single Use Assemblies Market Revenue, By Region, 2024 – 2032 (USD Million) 68

TABLE NO. 16. : Global Linear Single Use Assemblies Market Revenue, By Region, 2018 – 2023 (USD Million) 70

TABLE NO. 17. : Global Linear Single Use Assemblies Market Revenue, By Region, 2024 – 2032 (USD Million) 70

TABLE NO. 18. : Global Single Use Assemblies Market for Cell culture & Mixing  Revenue, By Region, 2018 – 2023 (USD Million) 76

TABLE NO. 19. : Global Single Use Assemblies Market for Cell culture & Mixing  Revenue, By Region, 2024 – 2032 (USD Million) 76

TABLE NO. 20. : Global Single Use Assemblies Market for Filtration & Purifications Revenue, By Region, 2018 – 2023 (USD Million) 78

TABLE NO. 21. : Global Single Use Assemblies Market for Filtration & Purifications Revenue, By Region, 2024 – 2032 (USD Million) 78

TABLE NO. 22. : Global Single Use Assemblies Market for Storage Applications  Revenue, By Region, 2018 – 2023 (USD Million) 80

TABLE NO. 23. : Global Single Use Assemblies Market for Storage Applications  Revenue, By Region, 2024 – 2032 (USD Million) 80

TABLE NO. 24. : Global Single Use Assemblies Market for Formulation and Fill-Finish Application  Revenue, By Region, 2018 – 2023 (USD Million) 82

TABLE NO. 25. : Global Single Use Assemblies Market for Formulation and Fill-Finish Application  Revenue, By Region, 2024 – 2032 (USD Million) 82

TABLE NO. 26. : Global Single Use Assemblies Market for Others Revenue, By Region, 2018 – 2023 (USD Million) 84

TABLE NO. 27. : Global Single Use Assemblies Market for Others Revenue, By Region, 2024 – 2032 (USD Million) 84

TABLE NO. 28. : Global Single Use Assemblies Market for Pharmaceutical & Biopharmaceutical Companies Revenue, By Region, 2018 – 2023 (USD Million) 90

TABLE NO. 29. : Global Single Use Assemblies Market for Pharmaceutical & Biopharmaceutical Companies Revenue, By Region, 2024 – 2032 (USD Million) 90

TABLE NO. 30. : Global Single Use Assemblies Market for Contract Research & Contract Manufacturing Organization Revenue, By Region, 2018 – 2023 (USD Million) 92

TABLE NO. 31. : Global Single Use Assemblies Market for Contract Research & Contract Manufacturing Organization Revenue, By Region, 2024 – 2032 (USD Million) 92

TABLE NO. 32. : Global Single Use Assemblies Market for Academics & Research Institute Revenue, By Region, 2018 – 2023 (USD Million) 94

TABLE NO. 33. : Global Single Use Assemblies Market for Academics & Research Institute Revenue, By Region, 2024 – 2032 (USD Million) 94

TABLE NO. 34. : Global Single Use Assemblies Market Revenue, By Region, 2018 – 2023 (USD Million) 99

TABLE NO. 35. : Global Single Use Assemblies Market Revenue, By Region, 2024 – 2032 (USD Million) 99

TABLE NO. 36. : Global Single Use Assemblies Market Revenue, By Product, 2018 – 2023 (USD Million) 100

TABLE NO. 37. : Global Single Use Assemblies Market Revenue, By Product, 2024 – 2032 (USD Million) 100

TABLE NO. 38. : Global Single Use Assemblies Market Revenue, By Solution, 2018 – 2023 (USD Million) 101

TABLE NO. 39. : Global Single Use Assemblies Market Revenue, By Solution, 2024 – 2032 (USD Million) 101

TABLE NO. 40. : Global Single Use Assemblies Market Revenue, By Applications, 2018 – 2023 (USD Million) 102

TABLE NO. 41. : Global Single Use Assemblies Market Revenue, By Applications, 2024 – 2032 (USD Million) 102

TABLE NO. 42. : Global Single Use Assemblies Market Revenue, By End User, 2018 – 2023 (USD Million) 103

TABLE NO. 43. : Global Single Use Assemblies Market Revenue, By End User, 2024 – 2032 (USD Million) 103

TABLE NO. 44. : North America Single Use Assemblies Market Revenue, By Country, 2018 – 2023 (USD Million) 105

TABLE NO. 45. : North America Single Use Assemblies Market Revenue, By Country, 2024 – 2032 (USD Million) 105

TABLE NO. 46. : North America Single Use Assemblies Market Revenue, By Product, 2018 – 2023 (USD Million) 106

TABLE NO. 47. : Global Single Use Assemblies Market Revenue, By Product, 2024 – 2032 (USD Million) 106

TABLE NO. 48. : North America Single Use Assemblies Market Revenue, By Solution, 2018 – 2023 (USD Million) 107

TABLE NO. 49. : North America Single Use Assemblies Market Revenue, By Solution, 2024 – 2032 (USD Million) 107

TABLE NO. 50. : North America Single Use Assemblies Market Revenue, By Applications, 2018 – 2023 (USD Million) 108

TABLE NO. 51. : North America Single Use Assemblies Market Revenue, By Applications, 2024 – 2032 (USD Million) 108

TABLE NO. 52. : North America Single Use Assemblies Market Revenue, By End User, 2018 – 2023 (USD Million) 109

TABLE NO. 53. : North America Single Use Assemblies Market Revenue, By End User, 2024 – 2032 (USD Million) 109

TABLE NO. 54. : Europe Single Use Assemblies Market Revenue, By Country, 2018 – 2023 (USD Million) 112

TABLE NO. 55. : Europe Single Use Assemblies Market Revenue, By Country, 2024 – 2032 (USD Million) 112

TABLE NO. 56. : Europe Single Use Assemblies Market Revenue, By Product, 2018 – 2023 (USD Million) 113

TABLE NO. 57. : Europe Single Use Assemblies Market Revenue, By Product, 2024 – 2032 (USD Million) 113

TABLE NO. 58. : Europe Single Use Assemblies Market Revenue, By Solution, 2018 – 2023 (USD Million) 114

TABLE NO. 59. : Europe Single Use Assemblies Market Revenue, By Solution, 2024 – 2032 (USD Million) 114

TABLE NO. 60. : Europe Single Use Assemblies Market Revenue, By Applications, 2018 – 2023 (USD Million) 115

TABLE NO. 61. : Europe Single Use Assemblies Market Revenue, By Applications, 2024 – 2032 (USD Million) 115

TABLE NO. 62. : Europe Single Use Assemblies Market Revenue, By End User, 2018 – 2023 (USD Million) 116

TABLE NO. 63. : Europe Single Use Assemblies Market Revenue, By End User, 2024 – 2032 (USD Million) 116

TABLE NO. 64. : Asia Pacific Single Use Assemblies Market Revenue, By Country, 2018 – 2023 (USD Million) 119

TABLE NO. 65. : Asia Pacific Single Use Assemblies Market Revenue, By Country, 2024 – 2032 (USD Million) 119

TABLE NO. 66. : Asia Pacific Single Use Assemblies Market Revenue, By Product, 2018 – 2023 (USD Million) 120

TABLE NO. 67. : Asia Pacific Single Use Assemblies Market Revenue, By Product, 2024 – 2032 (USD Million) 120

TABLE NO. 68. : Asia Pacific Single Use Assemblies Market Revenue, By Solution, 2018 – 2023 (USD Million) 121

TABLE NO. 69. : Asia Pacific Single Use Assemblies Market Revenue, By Solution, 2024 – 2032 (USD Million) 121

TABLE NO. 70. : Asia Pacific Single Use Assemblies Market Revenue, By Applications, 2018 – 2023 (USD Million) 122

TABLE NO. 71. : Asia Pacific Single Use Assemblies Market Revenue, By Applications, 2024 – 2032 (USD Million) 122

TABLE NO. 72. : Asia Pacific Single Use Assemblies Market Revenue, By End User, 2018 – 2023 (USD Million) 123

TABLE NO. 73. : Asia Pacific Single Use Assemblies Market Revenue, By End User, 2024 – 2032 (USD Million) 123

TABLE NO. 74. : Latin America Single Use Assemblies Market Revenue, By Country, 2018 – 2023 (USD Million) 126

TABLE NO. 75. : Latin America Single Use Assemblies Market Revenue, By Country, 2024 – 2032 (USD Million) 126

TABLE NO. 76. : Global Single Use Assemblies Market Revenue, By Product, 2018 – 2023 (USD Million) 127

TABLE NO. 77. : Latin America Single Use Assemblies Market Revenue, By Product, 2024 – 2032 (USD Million) 127

TABLE NO. 78. : Latin America Single Use Assemblies Market Revenue, By Solution, 2018 – 2023 (USD Million) 128

TABLE NO. 79. : Latin America Single Use Assemblies Market Revenue, By Solution, 2024 – 2032 (USD Million) 128

TABLE NO. 80. : Latin America Single Use Assemblies Market Revenue, By Applications, 2018 – 2023 (USD Million) 129

TABLE NO. 81. : Latin America Single Use Assemblies Market Revenue, By Applications, 2024 – 2032 (USD Million) 129

TABLE NO. 82. : Latin America Single Use Assemblies Market Revenue, By End User, 2018 – 2023 (USD Million) 130

TABLE NO. 83. : Latin America Single Use Assemblies Market Revenue, By End User, 2024 – 2032 (USD Million) 130

TABLE NO. 84. : Middle East Single Use Assemblies Market Revenue, By Country, 2018 – 2023 (USD Million) 133

TABLE NO. 85. : Middle East Single Use Assemblies Market Revenue, By Country, 2024 – 2032 (USD Million) 133

TABLE NO. 86. : Middle East Single Use Assemblies Market Revenue, By Product, 2018 – 2023 (USD Million) 134

TABLE NO. 87. : Middle East Single Use Assemblies Market Revenue, By Product, 2024 – 2032 (USD Million) 134

TABLE NO. 88. : Middle East Single Use Assemblies Market Revenue, By Solution, 2018 – 2023 (USD Million) 135

TABLE NO. 89. : Middle East Single Use Assemblies Market Revenue, By Solution, 2024 – 2032 (USD Million) 135

TABLE NO. 90. : Middle East Single Use Assemblies Market Revenue, By Applications, 2018 – 2023 (USD Million) 136

TABLE NO. 91. : Middle East Single Use Assemblies Market Revenue, By Applications, 2024 – 2032 (USD Million) 136

TABLE NO. 92. : Middle East Single Use Assemblies Market Revenue, By End User, 2018 – 2023 (USD Million) 137

TABLE NO. 93. : Middle East Single Use Assemblies Market Revenue, By End User, 2024 – 2032 (USD Million) 137

TABLE NO. 94. : Africa Single Use Assemblies Market Revenue, By Country, 2018 – 2023 (USD Million) 140

TABLE NO. 95. : Africa Single Use Assemblies Market Revenue, By Country, 2024 – 2032 (USD Million) 140

TABLE NO. 96. : Africa Single Use Assemblies Market Revenue, By Product, 2018 – 2023 (USD Million) 141

TABLE NO. 97. : Africa Single Use Assemblies Market Revenue, By Product, 2024 – 2032 (USD Million) 141

TABLE NO. 98. : Africa Single Use Assemblies Market Revenue, By Solution, 2018 – 2023 (USD Million) 142

TABLE NO. 99. : Africa Single Use Assemblies Market Revenue, By Solution, 2024 – 2032 (USD Million) 142

TABLE NO. 100. : Africa Single Use Assemblies Market Revenue, By Applications, 2018 – 2023 (USD Million) 143

TABLE NO. 101. : Africa Single Use Assemblies Market Revenue, By Applications, 2024 – 2032 (USD Million) 143

TABLE NO. 102. : Africa Single Use Assemblies Market Revenue, By End User, 2018 – 2023 (USD Million) 144

TABLE NO. 103. : Africa Single Use Assemblies Market Revenue, By End User, 2024 – 2032 (USD Million) 144


Frequently Asked Questions

What is the current size of the Global Single Use Assemblies Market?

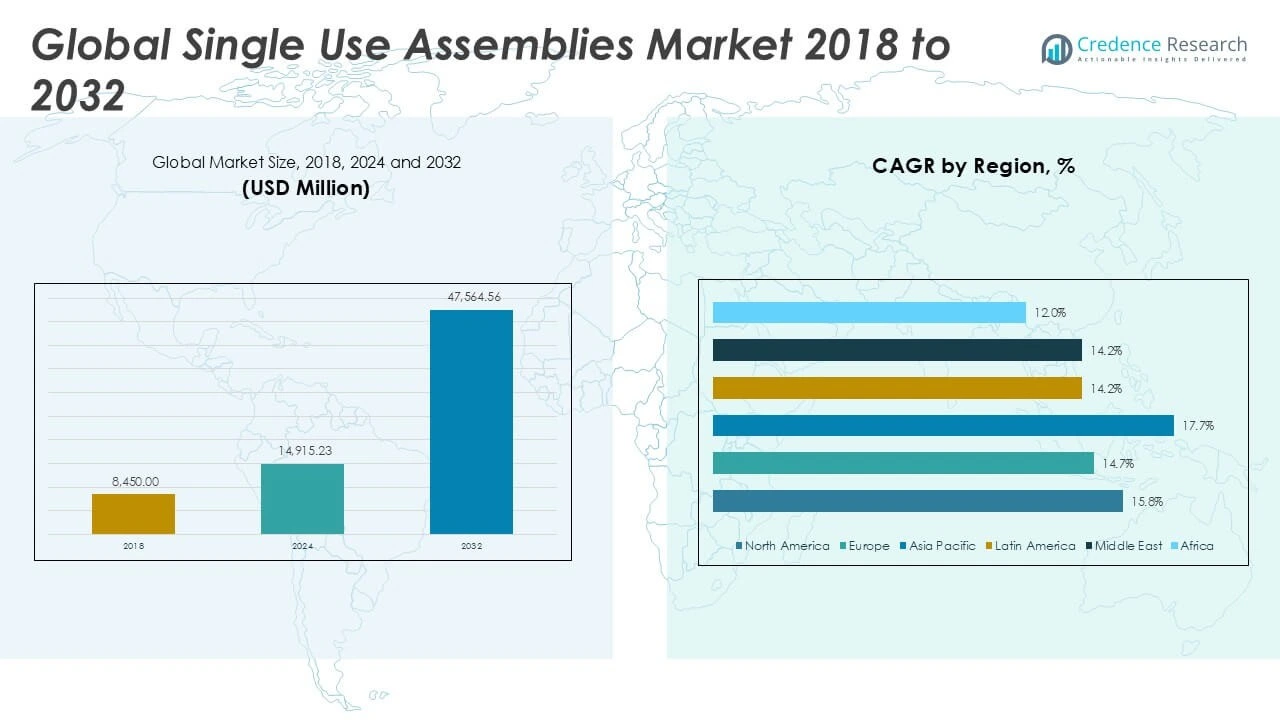
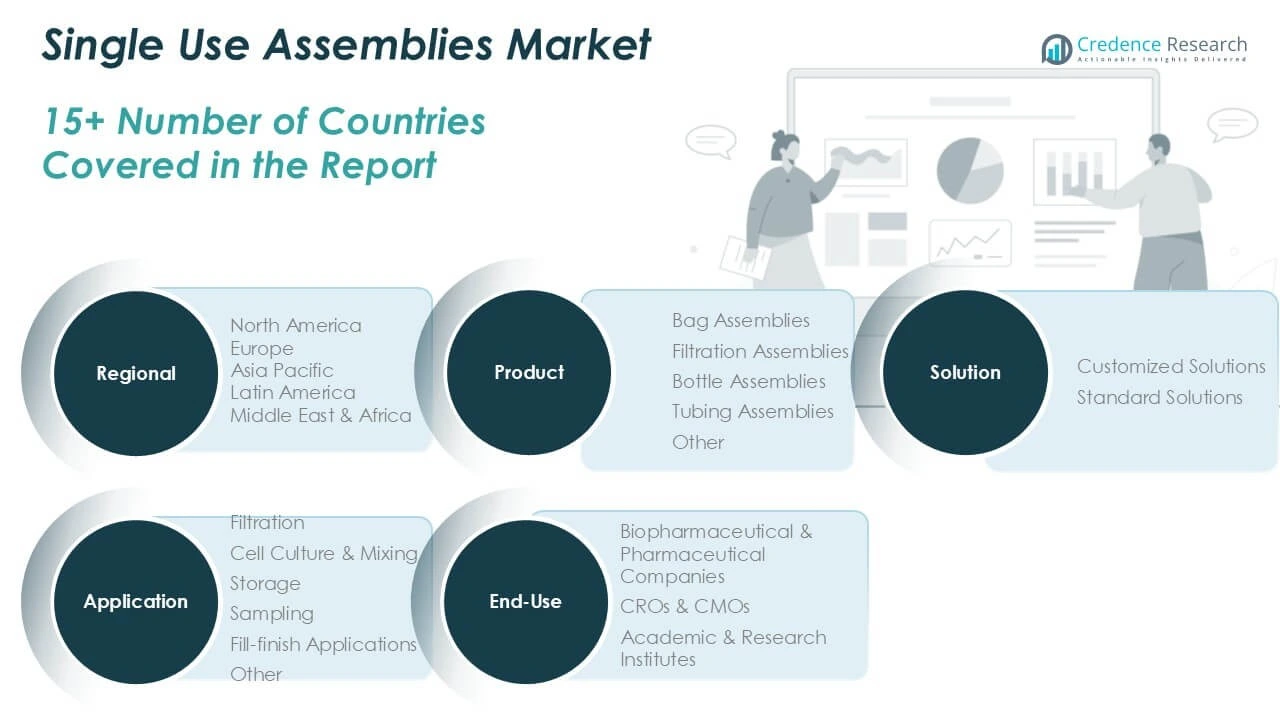
The Global Single Use Assemblies Market was valued at USD 2,480.91 million in 2023 and is projected to reach USD 6,991.12 million by 2032, growing at a CAGR of 12.2% during the forecast period from 2023 to 2032.

What factors are driving the growth of the Global Single Use Assemblies Market?

Key drivers include the increasing demand for biologics and biosimilars, the rise of contract development and manufacturing organizations (CDMOs), the need for scalable and flexible manufacturing solutions, and technological advancements in sensors and automation for process monitoring.

What are some challenges faced by the Global Single Use Assemblies Market?

Challenges include the high initial investment for implementing single-use systems, environmental concerns related to plastic waste, and regulatory inconsistencies across regions that may hinder market growth.

Who are the major players in the Global Single Use Assemblies Market?

Major players include Thermo Fisher Scientific, Sartorius AG, Merck Group, GE Healthcare, and Danaher Corporation, all of which dominate the market through extensive product offerings and strong R&D capabilities.

Middle East and Africa Single-Use Bio-Processing Systems Market

Published:
Report ID: 91973

Germany Single-Use Bio-Processing Systems Market

Published:
Report ID: 93913

Saudi Arabia Single-Use Bio-Processing Systems Market

Published:
Report ID: 93877

South Korea Single-Use Bio-Processing Systems Market

Published:
Report ID: 93669

Canada Single-Use Bio-Processing Systems Market

Published:
Report ID: 93661

UK Single-Use Bio-Processing Systems Market

Published:
Report ID: 91980

UAE Single-Use Bio-Processing Systems Market

Published:
Report ID: 93326

South Africa Single-Use Bio-Processing Systems Market

Published:
Report ID: 93351

China Single-Use Bio-Processing Systems Market

Published:
Report ID: 91962

Qatar Dental Care Market

Published:
Report ID: 30608

Middle East and Africa Single-Use Bio-Processing Systems Market

Published:
Report ID: 91973

Trauma Fixation Market

Published:
Report ID: 94400

Indonesia Platelet Rich Plasma (PRP) Market

Published:
Report ID: 94373

Latin America Platelet Rich Plasma (PRP) Market

Published:
Report ID: 94381

India Platelet Rich Plasma (PRP) Market

Published:
Report ID: 94389

U.S. Platelet Rich Plasma (PRP) Market

Published:
Report ID: 94405

North America Platelet Rich Plasma (PRP) Market

Published:
Report ID: 94435

UK Platelet Rich Plasma (PRP) Market

Published:
Report ID: 94444

Germany Platelet Rich Plasma (PRP) Market

Published:
Report ID: 94511

Africa Platelet Rich Plasma (PRP) Market

Published:
Report ID: 94463

Purchase Options

The report comes as a view-only PDF document, optimized for individual clients. This version is recommended for personal digital use and does not allow printing.
$4699

To meet the needs of modern corporate teams, our report comes in two formats: a printable PDF and a data-rich Excel sheet. This package is optimized for internal analysis and multi-location access, making it an excellent choice for organizations with distributed workforce.
$5699

The report will be delivered in printable PDF format along with the report’s data Excel sheet. This license offers 100 Free Analyst hours where the client can utilize Credence Research Inc.’s research team. It is highly recommended for organizations seeking to execute short, customized research projects related to the scope of the purchased report.
$7699

Credence Staff 3

MIKE, North America

Support Staff at Credence Research

KEITH PHILLIPS, Europe

Smallform of Sample request

Report delivery within 24 to 48 hours

– Other Info –

What people say?-

User Review

I am very impressed with the information in this report. The author clearly did their research when they came up with this product and it has already given me a lot of ideas.

Jana Schmidt
CEDAR CX Technologies

– Connect with us –

Phone

+91 6232 49 3207


support

24/7 Research Support


sales@credenceresearch.com

– Research Methodology –

Going beyond the basics: advanced techniques in research methodology

– Trusted By –

Pepshi, LG, Nestle
Motorola, Honeywell, Johnson and johnson
LG Chem, SIEMENS, Pfizer
Unilever, Samsonite, QIAGEN

Request Sample