Market Overview:
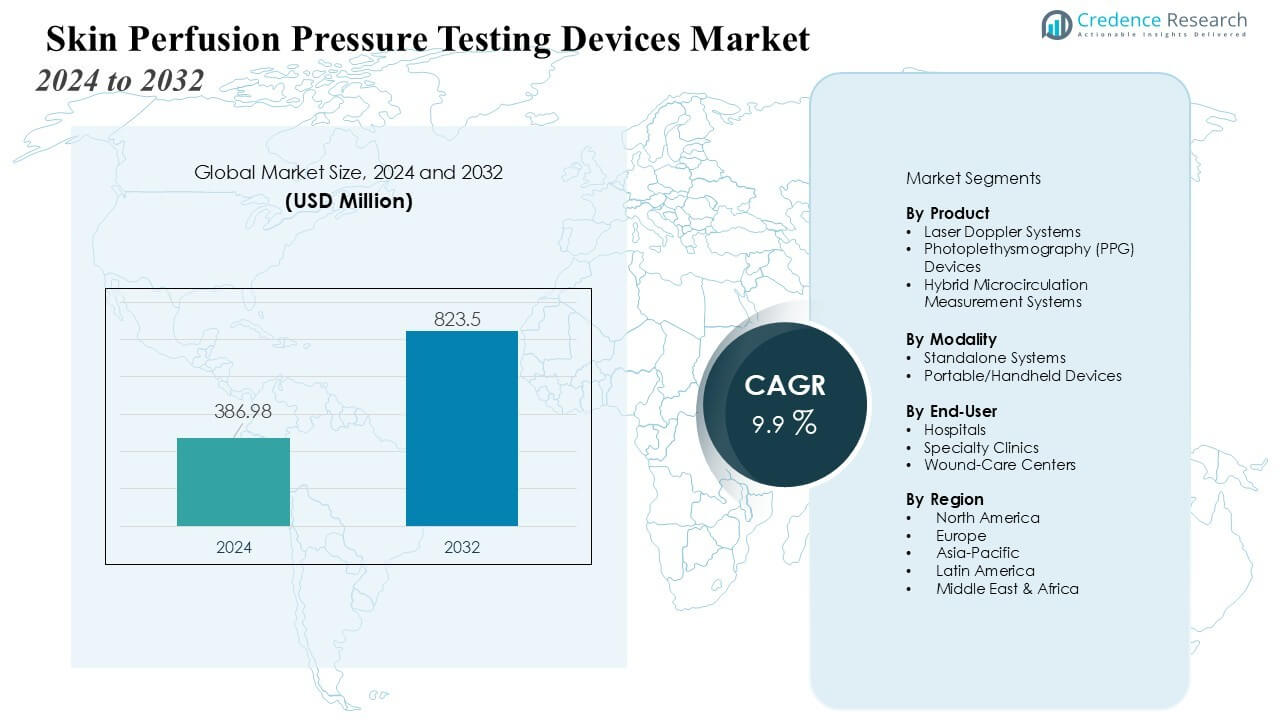
The Skin Perfusion Pressure Testing Devices Market size was valued at USD 386.98 million in 2024 and is anticipated to reach USD 823.5 million by 2032, at a CAGR of 9.9% during the forecast period.
| REPORT ATTRIBUTE |
DETAILS |
| Historical Period |
2020-2023 |
| Base Year |
2024 |
| Forecast Period |
2025-2032 |
| Skin Perfusion Pressure Testing Devices Market Size 2024 |
USD 386.98 million |
| Skin Perfusion Pressure Testing Devices Market, CAGR |
9.9% |
| Skin Perfusion Pressure Testing Devices Market Size 2032 |
USD 823.5 million |
Market growth is driven by the rising prevalence of diabetes, chronic limb ischemia, and venous ulcers, which require reliable microcirculation measurement to guide therapeutic decisions. The shift toward early vascular assessment, combined with advances in photoplethysmography (PPG), laser Doppler technologies, and portable diagnostic platforms, enhances device accuracy and ease of use. Growing emphasis on preventing amputations and improving wound-care outcomes further accelerates adoption among hospitals, vascular clinics, and wound-care centers.
Regionally, North America leads due to well-established vascular diagnostic standards, high disease burden, and strong reimbursement support. Europe follows with increased integration of perfusion monitoring in chronic wound management protocols. Asia-Pacific is expected to record the fastest growth, driven by rising diabetes prevalence, expanding healthcare infrastructure, and increasing awareness of early PAD diagnosis across China, India, and Southeast Asia.
Market Insights:
- The Skin Perfusion Pressure Testing Devices Market is valued at USD 386.98 million in 2024 and expected to reach USD 823.5 million by 2032, growing at a CAGR of 9.9%.
- Rising prevalence of diabetes, PAD, and chronic wounds is increasing the need for reliable microcirculation assessment to support early diagnosis and treatment decisions.
- Advancements in PPG, laser Doppler, and portable SPP technologies are enhancing measurement accuracy and expanding usage across hospitals and wound-care centers.
- High equipment costs, limited training, and lack of standardized interpretation protocols restrict adoption in smaller clinics and developing regions.
- North America leads the market, while Asia-Pacific is the fastest-growing region due to expanding healthcare infrastructure and rising diabetes-related complications.
Access crucial information at unmatched prices!
Request your sample report today & start making informed decisions powered by Credence Research Inc.!
Download Sample
Market Drivers:
Rising Burden of Peripheral Arterial Disease and Chronic Wounds
The Skin Perfusion Pressure Testing Devices Market benefits from the global rise in peripheral arterial disease, diabetic foot ulcers, and chronic limb ischemia. Healthcare providers rely on SPP assessment to determine tissue viability and guide clinical decision-making for wound-healing outcomes. The growing diabetic population strengthens the need for accurate microcirculatory evaluation. It enables clinicians to reduce amputation risks and improve treatment planning. Demand strengthens across hospitals and wound-care centers that prioritize early vascular assessment.
- For instance, the PeriFlux System 6000 by Perimed AB supports real-time microcirculatory blood flow monitoring, delivering perfusion data with temporal resolution under 0.1 seconds, significantly aiding clinicians in reducing amputation risks.
Advancements in Non-Invasive Microcirculation Measurement Technologies
Continuous innovation in photoplethysmography, laser Doppler, and automated SPP systems enhances measurement precision and clinical reliability. The Skin Perfusion Pressure Testing Devices Market gains traction as medical facilities adopt devices that deliver faster readings with improved reproducibility. Portable and user-friendly platforms support wider use in outpatient and home-care settings. It empowers clinicians to perform real-time perfusion analysis with minimal patient discomfort. Technology upgrades drive stronger confidence in routine vascular screening.
- For instance, Moor Instruments’ moorVMS-LDF laser Doppler device offers highly sensitive microvascular blood flow measurements with a data transfer rate to a PC of 40 Hz via the USB port, which ensures detailed real-time perfusion data for analysis.
Growing Emphasis on Early Diagnosis and Preventive Vascular Care
Clinicians prioritize early detection of microvascular impairment to avoid severe complications linked to PAD and complex ulcers. The Skin Perfusion Pressure Testing Devices Market aligns with preventive healthcare goals by enabling objective evaluation of wound-healing potential. Hospitals integrate SPP measurements into vascular triage pathways to support better risk stratification. It improves the accuracy of treatment decisions in time-sensitive cases. Demand grows with rising awareness of the economic burden caused by late-stage wound complications.
Shift Toward Evidence-Based Wound Management and Treatment Optimization
Health systems adopt perfusion-based evaluation protocols to enhance wound-care outcomes and lower healthcare costs. The Skin Perfusion Pressure Testing Devices Market gains momentum as SPP results guide decisions on revascularization, offloading strategies, and advanced therapies. Evidence-backed perfusion thresholds support consistent clinical practice across diverse care settings. It strengthens confidence in personalized treatment planning. Wider adoption increases with growing focus on measurable healing metrics and quality-of-care improvement.
Market Trends:
Growing Integration of Portable, Wireless, and AI-Enhanced Diagnostic Platforms
The Skin Perfusion Pressure Testing Devices Market moves toward compact, wireless, and ergonomically designed solutions that support point-of-care diagnostics. Healthcare providers favor devices that offer shorter test durations and real-time perfusion insights with high measurement consistency. AI-enabled analytics strengthen interpretation accuracy and reduce clinician workload in busy vascular and wound-care settings. It improves workflow efficiency by automating data processing and supporting predictive clinical decisions. Adoption increases in outpatient wound clinics, home-care services, and emergency departments that require rapid evaluation tools. Manufacturers invest in cloud-connected systems that allow remote monitoring and streamlined documentation. The trend expands with rising demand for technology that supports early-stage vascular assessment.
- For instance, the PeriFlux System 5000 by Perimed, renowned for its non-invasive optical sensing and multi-channel technology, aids in improving patient assessment workflows and data accuracy by allowing for multiple site measurements simultaneously, which helps clinics streamline their processes.
Rising Preference for Evidence-Driven, Standardized Vascular and Wound-Care Protocols
The Skin Perfusion Pressure Testing Devices Market aligns with health systems that move toward standardized perfusion-based wound assessment pathways. Clinical guidelines increasingly highlight objective microcirculation evaluation to determine treatment suitability for revascularization, compression therapy, or advanced wound-healing interventions. It supports consistent care delivery by reducing diagnostic variability across providers. Hospitals implement SPP testing to strengthen patient triage, risk stratification, and post-procedural monitoring. Increased reliance on quantifiable perfusion metrics elevates the demand for devices with high reproducibility and minimal operator dependency. Integration with electronic health records improves data continuity and supports longitudinal clinical outcomes tracking. The trend gains momentum with the global shift toward measurable performance benchmarks in chronic wound management.
- For Instance, the PeriFlux 6000 laser Doppler system indicates it provides reproducible skin perfusion pressure measurements using thermostatic probes and an operator-independent workflow to improve accuracy and reliability for patient assessment.
Market Challenges Analysis:
High Equipment Costs and Limited Access in Resource-Constrained Settings
The Skin Perfusion Pressure Testing Devices Market faces challenges linked to high acquisition and maintenance costs that restrict adoption across smaller clinics and rural healthcare facilities. Many care centers struggle to justify investment when budget constraints push them toward lower-cost vascular assessment tools. It limits access to reliable perfusion measurement in regions with high prevalence of diabetes and chronic wounds. Hospitals often prioritize essential imaging or surgical equipment over specialized perfusion devices. Reimbursement gaps further weaken purchasing decisions in developing markets. Cost pressure slows penetration in outpatient wound-care centers that seek scalable diagnostic solutions.
Operator Variability, Training Gaps, and Lack of Standardized Interpretation Protocols
The Skin Perfusion Pressure Testing Devices Market encounters barriers tied to inconsistent test execution and interpretation across clinicians. Variation in cuff placement, device handling, and patient positioning affects measurement accuracy. It creates concerns around diagnostic reliability in complex vascular cases. Many institutions lack structured training programs that ensure uniform device usage. Limited awareness of perfusion-based evaluation restricts integration into routine vascular assessment pathways. Absence of universal clinical guidelines reduces confidence among providers who need standardized decision-support criteria. This challenge slows broader incorporation of SPP testing in wound-management algorithms.
Market Opportunities:
Rising Demand for Early Diagnostics and Expanding Role of Preventive Vascular Care
The Skin Perfusion Pressure Testing Devices Market gains strong opportunities from global focus on early detection of peripheral arterial disease and chronic wound complications. Healthcare systems prioritize objective perfusion assessment to support timely intervention and reduce the likelihood of amputations. It enables clinicians to implement targeted treatment plans based on reliable microcirculation insights. Growing diabetic populations in emerging economies create significant unmet needs for accurate vascular diagnostics. Hospitals integrate SPP testing into multidisciplinary wound-care pathways that emphasize prevention. Rising adoption of value-based care models strengthens interest in perfusion-guided decision-making.
Technological Advancements and Wider Adoption Across Home-Care and Outpatient Settings
The Skin Perfusion Pressure Testing Devices Market benefits from new opportunities driven by compact, wireless, and AI-supported diagnostic platforms. Manufacturers develop user-friendly and portable systems that expand access beyond hospital-based vascular labs. It supports real-time monitoring and remote patient evaluation in home-care environments. Integration with digital health records improves care continuity and strengthens clinical confidence. Expanding investments in wound-care clinics and community-based vascular centers accelerate device deployment. Demand rises with growing preference for evidence-driven assessment in diverse care settings.
Market Segmentation Analysis:
By Product
The Skin Perfusion Pressure Testing Devices Market includes laser Doppler systems, photoplethysmography-based devices, and hybrid platforms that combine multiple microcirculation measurement technologies. Laser Doppler units lead due to high sensitivity and reliable perfusion detection in complex wound cases. Photoplethysmography devices gain traction for their portability and ease of use in outpatient settings. Hybrid solutions attract growing interest from hospitals that require multifunctional diagnostic capabilities. It strengthens clinical workflows by supporting diverse vascular assessment needs.
- For instance, Moor Instruments’ moorVMS-VASC 2.0 laser Doppler system offers precise real-time perfusion data and has achieved clinical adoption in vascular labs globally, supported by strong diagnostic accuracy.
By Modality
The market divides into standalone systems and portable handheld devices. Standalone units maintain strong adoption in vascular laboratories and advanced wound-care centers that depend on high-precision diagnostics. Portable devices register faster growth due to rising demand for point-of-care evaluation and improved mobility. It extends perfusion testing to emergency departments, home-care environments, and remote clinics. Compact designs and wireless connectivity support wider use among multidisciplinary care teams.
- For instance, NovaGuide 2’s portable ultrasound device demonstrated a 64 percent sensitivity rate in detecting right-to-left shunts (RLS), outperforming traditional transthoracic echocardiography which had a 20 percent rate, enabling accurate point-of-care diagnostics in diverse care settings.
By End User
The market includes hospitals, specialty clinics, and wound-care centers. Hospitals hold the largest share due to high patient volumes and stronger integration of vascular assessment in treatment pathways. Specialty clinics adopt SPP testing to improve diagnostic accuracy in peripheral arterial disease and chronic ulcer management. Wound-care centers expand usage to evaluate tissue viability and guide intervention decisions. It supports better healing outcomes by enabling consistent and objective perfusion measurement.
Segmentations:
By Product
- Laser Doppler Systems
- Photoplethysmography (PPG) Devices
- Hybrid Microcirculation Measurement Systems
By Modality
- Standalone Systems
- Portable/Handheld Devices
By End User
- Hospitals
- Specialty Clinics
- Wound-Care Centers
By Region
- North America
- Europe
- Germany
- France
- U.K.
- Italy
- Spain
- Rest of Europe
- Asia Pacific
- China
- Japan
- India
- South Korea
- South-east Asia
- Rest of Asia Pacific
- Latin America
- Brazil
- Argentina
- Rest of Latin America
- Middle East & Africa
- GCC Countries
- South Africa
- Rest of the Middle East and Africa
Regional Analysis:
Strong Market Leadership in North America Driven by Advanced Vascular Care Infrastructure
The Skin Perfusion Pressure Testing Devices Market holds a dominant position in North America due to strong healthcare infrastructure, high awareness of peripheral arterial disease, and widespread adoption of evidence-based wound-care protocols. Hospitals integrate SPP testing into routine vascular assessments to support early diagnosis and reduce limb-related complications. Reimbursement support accelerates device uptake among outpatient centers and specialty wound clinics. It strengthens clinical decision-making in diabetic foot management, where perfusion measurement is essential. Growing emphasis on preventive vascular care fuels steady demand across the region. Investments in advanced diagnostic technologies further reinforce market expansion.
Steady Growth in Europe Supported by Clinical Standardization and Expanding Wound-Care Networks
Europe records stable demand for SPP testing devices due to well-established chronic wound-management frameworks and rising clinical emphasis on perfusion-based evaluation. The Skin Perfusion Pressure Testing Devices Market benefits from adoption in hospitals that prioritize objective assessment of microcirculation before therapeutic interventions. National healthcare systems encourage the use of standardized diagnostic pathways that improve treatment planning. It aligns with efforts to reduce amputation rates linked to diabetic foot complications. Strong presence of vascular specialists increases usage across Germany, the UK, France, and the Nordics. Expansion of specialized wound-care centers continues to strengthen regional uptake.
Rapid Expansion in Asia-Pacific Fueled by Rising Diabetes Burden and Healthcare Modernization
Asia-Pacific emerges as the fastest-growing region due to rising diabetic populations, expanding hospital infrastructure, and increasing awareness of early vascular diagnostics. The Skin Perfusion Pressure Testing Devices Market gains momentum as countries invest in modern wound-care facilities and adopt advanced perfusion measurement tools. Healthcare providers focus on early detection to manage PAD-related complications more effectively. It supports significant opportunities in India, China, Japan, and South Korea. Government-led programs for diabetes and chronic wound management drive device deployment across public and private sectors. Growing preference for portable and cost-efficient modalities further accelerates regional growth.
Shape Your Report to Specific Countries or Regions & Enjoy 30% Off!
Key Player Analysis:
- Vasamed Incorporated
- Moor Instruments
- Perimed AB
- ELCAT GmbH
- ATYS Medical
- Viasonix
- Promed Group
Competitive Analysis:
The Skin Perfusion Pressure Testing Devices Market features a competitive landscape driven by innovation, clinical reliability, and expansion into point-of-care vascular diagnostics. Leading companies such as Vasamed Incorporated, Moor Instruments, Perimed AB, ELCAT GmbH, ATYS Medical, Viasonix, and Promed Group strengthen their positions through continuous product upgrades and emphasis on high-accuracy perfusion measurement. Many players focus on enhancing device portability, wireless integration, and AI-supported analytics to support faster clinical decisions. It increases adoption across hospitals, specialty clinics, and wound-care centers that require objective microcirculation evaluation. Strategic partnerships with healthcare providers, distributors, and digital health platforms expand market presence in developed and emerging regions. Investments in training programs and clinical education improve user proficiency and strengthen brand loyalty. Competition intensifies with growing demand for devices that deliver reproducible results and support evidence-driven vascular assessment workflows.
Recent Developments:
- In February 2025, Perimed AB partnered with Serendipity Partners, who acquired a 49% stake to accelerate growth and innovation in vascular assessment technologies, particularly for diabetic foot diagnostics.
- In August 2025, ProMed Pharma acquired a 28,000 sq. ft. pharmaceutical manufacturing plant in Plymouth, Minnesota from Bora Pharmaceuticals, expanding its manufacturing capabilities.
Report Coverage:
The research report offers an in-depth analysis based on Product, Modality, End User and Region. It details leading Market players, providing an overview of their business, product offerings, investments, revenue streams, and key applications. Additionally, the report includes insights into the competitive environment, SWOT analysis, current Market trends, as well as the primary drivers and constraints. Furthermore, it discusses various factors that have driven Market expansion in recent years. The report also explores Market dynamics, regulatory scenarios, and technological advancements that are shaping the industry. It assesses the impact of external factors and global economic changes on Market growth. Lastly, it provides strategic recommendations for new entrants and established companies to navigate the complexities of the Market.
Future Outlook:
- Growing adoption of portable and wireless SPP devices will strengthen point-of-care vascular diagnostics across hospitals and outpatient centers.
- Rising focus on early detection of peripheral arterial disease will increase reliance on objective perfusion measurement.
- Integration of AI-enabled analytics will improve interpretation accuracy and reduce clinician workload in wound-care settings.
- Expansion of home-care services will create opportunities for compact devices that support remote monitoring.
- Stronger emphasis on evidence-driven wound-management protocols will elevate the role of perfusion-based assessment.
- Increasing diabetic foot complications across emerging markets will accelerate demand for reliable microcirculation evaluation.
- Healthcare providers will integrate SPP testing into multidisciplinary care pathways for better treatment planning.
- Manufacturers will invest in advanced sensors and ergonomic designs to enhance user experience and diagnostic consistency.
- Growth in digital health platforms will support seamless data sharing and long-term clinical tracking.
- Rising government focus on chronic disease management will encourage broader adoption of perfusion-testing technologies across public health systems.


