Home » Information and Communications Technology » Technology & Media » Smart Facility Management Market

Smart Facility Management Market By Component (Software, Hardware, Services); By Deployment Mode (Cloud, On-premise); By End-user (Commercial Offices & Corporate Real Estate, Healthcare & Hospitals, Industrial & Manufacturing, Retail & Logistics, Education & Government); By Functionality (Energy & Sustainability Management, Space & Occupancy Management, Predictive Maintenance & Asset Health, Security & Access Management, Workorder & Service Automation); By Buyer Persona (In-house FM Teams [Owner/Operator], Real-estate Developers / REITs, Third-party FM Service Providers) – Growth, Share, Opportunities & Competitive Analysis, 2024 – 2032

Report ID: 168520 | Report Format : Excel, PDF

Market Overview:

The Global Smart Facility Management Market size was valued at USD 10,320.00 million in 2018 to USD 14,024.37 million in 2024 and is anticipated to reach USD 29,330.48 million by 2032, at a CAGR of 9.82% during the forecast period.

REPORT ATTRIBUTE DETAILS
Historical Period 2020-2023
Base Year 2024
Forecast Period 2025-2032
Smart Facility Management Market Size 2024 USD 14,024.37 million
Smart Facility Management Market, CAGR 9.82%
Smart Facility Management Market Size 2032 USD 29,330.48 million


Growth stays steady due to strong demand for automated building operations and rising interest in predictive maintenance. Companies invest in IoT, AI, and cloud platforms that enhance efficiency and reduce operational waste. Energy management tools support better monitoring across large commercial sites. Digital solutions help firms lower downtime across critical assets. Smart tools also improve workforce management and safety compliance. The Global Smart Facility Management Market benefits from wide use of integrated systems across corporate and public buildings.

North America leads due to early use of advanced automation platforms and strong spending on digital building upgrades. Europe follows due to strict sustainability rules that support adoption of smart building tools across major cities. Asia Pacific emerges fast due to rapid construction growth and higher adoption of connected systems across large commercial spaces. The Middle East gains traction due to wide smart city plans that push digital facility operations. Latin America sees stable progress due to steady investment in modern building infrastructure. Africa grows at a slower pace due to limited digital readiness but gains momentum in urban centers.

Smart Facility Management Market size

Market Insights:

  • The Global Smart Facility Management Market was valued at USD 10,320.00 million in 2018, reached USD 14,024.37 million in 2024, and is projected to hit USD 29,330.48 million by 2032, growing at a 82% CAGR during the forecast period.
  • North America (33.57%), Europe (27.45%), and Asia Pacific (24.64%) represent the top three regional shares due to strong digital infrastructure, strict energy-efficiency regulations, and rapid smart-building investments across commercial and public sectors.
  • Asia Pacific emerges as the fastest-growing region with an 2% CAGR and a 24.64% share, supported by large-scale construction growth, enterprise digitalization, and rising adoption of cloud-based facility platforms.
  • Buyer persona distribution in the chart shows Real-estate Developers / REITs holding the largest portion (≈38–40%), driven by portfolio modernization, energy-efficient upgrades, and higher adoption of predictive management tools.
  • Third-party FM Service Providers account for roughly 35–38% of the structure, supported by contract outsourcing, multi-site facility coverage, and rising need for integrated service automation across global portfolios.

Access crucial information at unmatched prices!

Request your sample report today & start making informed decisions powered by Credence Research Inc.!

Download Sample

Market Drivers:

Rising Demand for Intelligent Building Operations

The Global Smart Facility Management Market gains strong momentum due to rapid adoption of automated systems in large commercial structures. Many enterprises deploy IoT sensors to monitor assets in real time and enhance building health. Predictive tools support fewer breakdowns across energy, HVAC, and security systems. Firms adopt software platforms that cut delays in maintenance tasks and increase workforce output. Cloud dashboards improve visibility across multi-site properties for better planning. Smart tools also support strong sustainability targets across regulated regions. Building owners invest in digital upgrades to support efficient service cycles. Growing interest in automation strengthens long-term adoption across global facilities.

  • For instance, Siemens Desigo CC integrates more than 2,000 data points per building across HVAC, lighting, and security, enabling unified control for large facilities.

Growing Focus on Energy Efficiency and Sustainability Compliance

Energy rules drive faster deployment of high-performance systems that help reduce waste across major buildings. Many firms integrate energy dashboards that track daily loads and optimize usage patterns. Building owners rely on advanced controls to manage lighting, HVAC, and power distribution. Predictive analytics help operators cut downtime through early detection of faults. Sustainability goals guide upgrades in older buildings to match green-building norms. Smart meters improve transparency for corporate reporting. Integrated tools support better planning during peak-load periods. Rising focus on long-term energy savings strengthens demand across global facilities.

  • For instance, Schneider Electric’s EcoStruxure platform has delivered up to 30% energy savings in commercial buildings by using real-time energy analytics and automated load optimization.

Expansion of Smart Infrastructure and Digital-First Building Strategies

Strong growth in smart city projects boosts adoption of modern facility tools across public and private infrastructure. Property owners invest in integrated platforms that support asset tracking across campuses and industrial zones. Mobile tools help teams manage tasks and inspections with fewer delays. AI-based management improves the quality of service planning across complex sites. Cloud systems reduce dependence on manual logs and paper-based records. Many firms push digital workflows to improve response time for repair teams. Integrated communication tools help managers coordinate across distributed workforces. The Global Smart Facility Management Market benefits from strong alignment with long-term digital transformation plans.

Increasing Need for Predictive Maintenance Across Large Facilities

Large buildings face more pressure to avoid sudden failures across critical assets such as HVAC units, lifts, and power systems. Predictive tools monitor vibration, temperature, and performance data to detect faults early. Many companies deploy sensors across high-risk assets to cut downtime. Real-time alerts help maintenance teams respond faster during equipment degradation. Cloud systems store long historical records to support stronger planning cycles. Asset life improves when predictive routines replace manual inspection cycles. Digital diagnostics improve operational safety for large commercial and industrial buildings. This shift supports continuous adoption across global markets.

Market Trends:

Rapid Growth of AI-Driven Automation and Smart Decision-Support Tools

The Global Smart Facility Management Market sees fast adoption of AI tools that guide managers with data-based insights. Many platforms use AI models to predict asset failures with high accuracy. Smart building systems combine AI with digital twins to improve planning. AI chatbots support faster task routing for maintenance teams. Image analytics help monitor occupancy in large office spaces. Intelligent allocation tools improve workflow efficiency across multi-site portfolios. AI also supports strong control over energy distribution in dynamic environments. These shifts move facilities toward more autonomous operations.

  • For instance, Johnson Controls uses its OpenBlue AI engine to deliver up to 30% reduction in energy spend and up to 20% reduction in maintenance spend through automated fault detection and predictive workflows.

Shift Toward Integrated Command Centers for Multi-Site Oversight

Large organizations deploy centralized command platforms to manage multiple buildings through one interface. Such systems merge workflows across energy, security, cleaning, and maintenance routines. Real-time feeds support stronger decision-making for multi-location teams. Integrated dashboards reduce delays caused by siloed operations. Managers gain full transparency into building health without on-site checks. This consolidation helps reduce manual reconciliation across departments. Cloud-enabled command centers support remote management models. The trend remains strong in industries with large distributed asset bases.

  • For instance, Honeywell has a significant global reach, with its technologies used in more than 10 million commercial buildingsworldwide to improve performance and create safer, healthier, and more comfortable spaces.

Rising Adoption of Smart Workplace Experience Platforms

Workplace experience tools gain importance due to rising demand for flexible and hybrid work models. Many offices deploy smart apps that manage seating, room scheduling, and visitor flow. Occupancy sensors guide better use of shared spaces. Digital badges support secure access with minimal physical touchpoints. User-centric dashboards improve employee comfort and safety. Integrated platforms help firms manage indoor air quality in busy offices. Mobile apps support quick reporting of issues for faster resolution. This trend expands due to increased focus on workforce well-being.

Growing Use of Robotics and Autonomous Systems in Routine Operations

Robotics tools gain traction across cleaning, inspection, and indoor transport tasks. Many buildings adopt autonomous cleaning units to maintain large floor areas. Inspection robots help detect issues across ducting, ceiling spaces, and remote zones. Service robots support safe movement of goods in hospitals and industrial units. Autonomous tools cut physical strain on support teams. Firms adopt robots to maintain consistent service levels. Robotics platforms connect to cloud systems for performance tracking. The trend grows due to rising interest in low-contact facility operations.

Smart Facility Management Market share

Market Challenges Analysis:

High Integration Costs and Limited Technical Readiness Across Many Regions

The Global Smart Facility Management Market faces pressure due to high upfront costs tied to sensors, platforms, and structured networks. Many older buildings require major upgrades before smart tools operate smoothly. Limited technical skills slow adoption across developing regions with low digital maturity. Some firms struggle to manage new data flows without trained staff. Integration challenges rise when buildings use mixed legacy systems across energy and security. Cybersecurity concerns add more pressure during platform deployment. Procurement delays hinder project timelines in large facilities. Uneven digital readiness affects adoption across global markets.

Concerns Over Data Protection, System Complexity, and Vendor Dependence

Many organizations face difficulty managing data privacy across multi-layered facility systems. Complex system architecture increases the risk of access gaps during operation. Vendor lock-in challenges arise when buildings depend on closed-architecture solutions. Firms struggle to manage interoperability across devices from different suppliers. Limited standards reduce smooth communication across building systems. Data storage rules vary across regions and create compliance pressure. Many operators fear exposure during cloud migration. These barriers slow the pace of adoption across global markets.

Market Opportunities:

Expansion of Connected Infrastructure and Demand for Predictive Digital Ecosystems

The Global Smart Facility Management Market gains openings due to fast modernization of commercial and industrial buildings. Many operators invest in connected infrastructure to improve asset visibility. Predictive tools support more accurate scheduling for repair routines. Digital twins help teams simulate building behavior with minimal risk. Energy dashboards gain traction across sustainability-driven portfolios. Cloud-based tools widen access for global enterprises managing multiple sites. High interest in efficient service cycles creates strong entry points for advanced software vendors. New projects support long-term opportunities in emerging regions.

Rising Focus on Workforce Efficiency and Smart Workplace Enablement Solutions

Many companies deploy workplace platforms that support strong employee comfort and productivity. Smart apps guide navigation, seating, and service requests. Indoor monitoring tools help maintain healthier environments across dense offices. Integrated systems support faster task routing for facility teams. Workforce insights help manage space consumption more effectively. Strong demand for hybrid work models fuels adoption of digital workplace tools. Smart automation reduces delays during routine operations. These shifts create steady growth corridors for new vendors.

Market Segmentation Analysis:

By Component

The Global Smart Facility Management Market uses software as the core layer that drives automation, reporting, and real-time asset visibility. Hardware segments support sensors, access devices, and connected equipment used across large sites. Services gain traction due to rising need for integration, training, and long-term maintenance support across complex portfolios. Each component group plays a direct role in improving operational efficiency and sustainability outcomes for modern buildings.

  • For instance, ABB’s building automation systems and sensors support multiple, widely used, open protocolssuch as BACnet, Modbus, KNX, and DALI, which enables facilities to integrate diverse third-party hardware and standardize monitoring across mixed hardware environments.

By Deployment Mode

Cloud deployment gains strong preference due to faster scaling, remote access, and lower upgrade cycles. Many enterprises select cloud platforms to support real-time monitoring across multi-site portfolios. On-premise solutions remain relevant in facilities with strict data control rules and legacy systems. Both modes support stronger security, higher uptime, and stable workflows for large user groups.

  • For instance, the Microsoft Azure IoT Hubservice can be scaled to manage hundreds of millions, or even billions, of IoT messages daily across multiple instances, supporting high-scale cloud deployments for enterprise facility operations.

By End-user

Commercial offices and corporate real estate drive wide adoption with strong focus on workplace optimization. Healthcare and hospitals demand advanced tools for safety, asset tracking, and indoor environment control. Industrial and manufacturing sites rely on predictive tools to manage equipment health. Retail and logistics adopt smart systems to improve space planning and flow control. Education and government buildings use integrated platforms to improve safety and energy performance.

By Functionality

Energy and sustainability tools support strict efficiency goals for modern buildings. Space and occupancy tools guide flexible workplace planning. Predictive maintenance improves asset health and cuts downtime. Security and access tools strengthen protection across sensitive areas. Workorder automation supports faster service cycles.

By Buyer Persona

In-house FM teams focus on control, visibility, and cost savings. Real-estate developers and REITs prioritize value creation and tenant experience. Third-party FM service providers adopt scalable platforms to improve delivery quality across large portfolios.

Smart Facility Management Market segmentation

Segmentation:

By Component

  • Software
  • Hardware
  • Services

By Deployment Mode

  • Cloud
  • On-premise

By End-user

  • Commercial Offices & Corporate Real Estate
  • Healthcare & Hospitals
  • Industrial & Manufacturing
  • Retail & Logistics
  • Education & Government

By Functionality

  • Energy & Sustainability Management
  • Space & Occupancy Management
  • Predictive Maintenance & Asset Health
  • Security & Access Management
  • Workorder & Service Automation

By Buyer Persona

  • In-house FM Teams (Owner/Operator)
  • Real-estate Developers / REITs
  • Third-party FM Service Providers

By Region

  • North America
    • U.S.
    • Canada
    • Mexico
  • Europe
    • Germany
    • France
    • U.K.
    • Italy
    • Spain
    • Rest of Europe
  • Asia Pacific
    • China
    • Japan
    • India
    • South Korea
    • South-east Asia
    • Rest of Asia Pacific
  • Latin America
    • Brazil
    • Argentina
    • Rest of Latin America
  • Middle East & Africa
    • GCC Countries
    • South Africa
    • Rest of the Middle East and Africa

Regional Analysis:

North America

The North America Global Smart Facility Management Market size was valued at USD 3,508.80 million in 2018 to USD 4,706.50 million in 2024 and is anticipated to reach USD 9,828.70 million by 2032, at a CAGR of 9.8 during the forecast period. The region holds a 33.57% market share. The Global Smart Facility Management Market grows in North America due to strong use of digital building systems across commercial and public sites. Large enterprises deploy AI and IoT tools to improve asset performance. Many buildings integrate predictive platforms to cut downtime and reduce service delays. Strong regulatory focus on energy efficiency drives wider digital adoption. Cloud tools gain traction across multi-site portfolios needing real-time visibility. Many firms invest in access control upgrades to strengthen workplace safety. The region keeps a leadership position due to mature technology readiness.

Europe

The Europe Global Smart Facility Management Market size was valued at USD 2,938.41 million in 2018 to USD 3,849.73 million in 2024 and is anticipated to reach USD 7,640.08 million by 2032, at a CAGR of 9.1 during the forecast period. The region holds a 27.45% market share. The Global Smart Facility Management Market expands in Europe due to strong sustainability rules that push buildings toward advanced energy systems. Many companies install smart meters to support reporting across regulated sectors. Digital twins gain traction in large commercial zones. Predictive platforms support better service cycles in older buildings. Security upgrades move toward cloud-enabled access systems. Many cities adopt automated platforms to monitor public infrastructure. The region benefits from strong government support for green building initiatives.

Asia Pacific

The Asia Pacific Global Smart Facility Management Market size was valued at USD 2,431.39 million in 2018 to USD 3,456.25 million in 2024 and is anticipated to reach USD 8,004.31 million by 2032, at a CAGR of 11.2 during the forecast period. The region holds a 24.64% market share. The Global Smart Facility Management Market grows in Asia Pacific due to rapid construction and rising investment in advanced workplace systems. Smart sensors gain traction in high-density commercial properties. Many enterprises adopt cloud platforms to support remote oversight. Digital systems improve response time for service teams across large building clusters. Smart energy tools support strong demand for efficient operations. Predictive maintenance platforms reduce strain on aging infrastructure. The region emerges as the fastest-growing due to strong digital transformation.

Latin America

The Latin America Global Smart Facility Management Market size was valued at USD 743.04 million in 2018 to USD 1,001.20 million in 2024 and is anticipated to reach USD 1,961.33 million by 2032, at a CAGR of 8.9 during the forecast period. The region holds a 7.14% market share. The Global Smart Facility Management Market advances in Latin America due to rising modernization of commercial buildings. Many operators deploy cloud-based tools to manage distributed sites. Energy monitoring systems gain visibility across urban centers. Security upgrades support stronger access control in public facilities. Digital adoption grows in retail and logistics hubs. Workforce automation tools help reduce operational delays. The region shows steady progress supported by improved connectivity.

Middle East

The Middle East Global Smart Facility Management Market size was valued at USD 252.84 million in 2018 to USD 309.85 million in 2024 and is anticipated to reach USD 545.71 million by 2032, at a CAGR of 7.5 during the forecast period. The region holds a 2.21% market share. The Global Smart Facility Management Market develops in the Middle East due to large smart city projects across major economies. High-end commercial buildings adopt advanced automation tools. Energy systems move toward integrated dashboards for real-time control. Security and access platforms see faster deployment in premium developments. Many facilities adopt AI-based monitoring to reduce service delays. Cloud migration grows across government sites and corporate campuses. Growth stays stable due to strong investment in high-value infrastructure.

Africa

The Africa Global Smart Facility Management Market size was valued at USD 445.51 million in 2018 to USD 700.85 million in 2024 and is anticipated to reach USD 1,350.35 million by 2032, at a CAGR of 8.5 during the forecast period. The region holds a 5.00% market share. The Global Smart Facility Management Market progresses in Africa due to rising demand for efficient building operations across growing cities. Many facilities adopt basic automation to support energy savings. Cloud-based tools gain traction due to lower setup costs. Security upgrades remain a priority across commercial and public sites. Predictive tools help manage asset health in aging buildings. Digital platforms support better workflow execution. Growth improves as connectivity expands across more urban markets.

Shape Your Report to Specific Countries or Regions & Enjoy 30% Off!

Key Player Analysis:

Competitive Analysis:

The Global Smart Facility Management Market features strong competition among technology leaders, software platform providers, and integrated facility service companies. Many players expand portfolios with AI-driven tools that support real-time monitoring and predictive insights. It sees rising investment in cloud platforms that enhance interoperability across large portfolios. Vendors strengthen their presence through partnerships that link hardware, software, and service ecosystems. Product differentiation grows through advanced analytics, automation, and workplace experience tools. Several companies focus on energy and sustainability modules to meet global regulatory goals. High competition drives continuous upgrades in security, asset visibility, and workflow automation. Market leaders gain advantage through broad integration capabilities and global service networks.

Recent Developments:

  • In November 2025, Schneider Electric partnered with the Vellore Institute of Technology (VIT) to establish a Centre of Excellence in Smart City and Smart Factory Technologies at VIT’s Vellore campus. This initiative aims to advance research, innovation, and skill development in emerging domains critical to India’s digital and sustainable future. The first batch was set to onboard 1,100 students, with plans to scale significantly in coming years, building on VIT’s distinction as the first Indian university to be empanelled as a Schneider Electric Priority Campus globally.
  • Building X, the cornerstone of Siemens’ smart building ecosystem, was further advanced in November 2025 with the presentation of enhanced capabilities that establish it as an open, interoperable, and entirely cloud-based solution. The platform acts as a “single source of truth” that eliminates complexity across different stakeholders in the building lifecycle, including occupants, investors, real estate companies, and facility managers, while supporting decarbonization goals. Building X combines data from different sources into a digital twin of building operations, linking the real and digital worlds of buildings, enabling operators to remedy problems faster and make buildings more sustainable while improving performance and optimizing user experience.
  • In September 2025, Siemens Limited announced an expanded partnership with L&T Technology Services (LTTS). This strategic collaboration aims to advance machine and line simulation and IIoT technology, setting new benchmarks for innovation within LTTS’ sustainability segment, encompassing process engineering, discrete manufacturing, and industrial products. By integrating Siemens’ flagship platforms—TIA Portal, Industrial Edge, and Tecnomatix—with LTTS’ AI-driven engineering expertise, the partnership accelerates digital adoption, improves precision in system design, and drives faster, smarter decision-making across manufacturing ecosystems.
  • In March 2025, Siemens Smart Infrastructure unveiled Building X Portfolio Manager, an advanced software-as-a-service application designed to revolutionize enterprise facility management. This innovative platform unifies real estate, energy, sustainability, and operational data into a single, intelligent solution. The application became available on the market from May 2025. Building X Portfolio Manager integrates operational technology, information technology, and enterprise systems while consolidating data from sensors, meters, IoT devices, and data lakes. The platform enables portfolio managers, consultants, and energy engineers to gain comprehensive visibility of all services and operations across multiple sites, including real-time tracking, automation, and integrated data management to enhance decision-making for building aspects such as energy, water, sustainability, space, environment, parking, and occupancy. As part of Siemens Xcelerator, the platform combines artificial intelligence-driven insights, automation, and cross-domain portfolio management.

Report Coverage:

The research report offers an in-depth analysis based on By Component, By Deployment Mode, By End-user, By Functionality, and By Buyer Persona. It details leading market players, providing an overview of their business, product offerings, investments, revenue streams, and key applications. Additionally, the report includes insights into the competitive environment, SWOT analysis, current market trends, as well as the primary drivers and constraints. Furthermore, it discusses various factors that have driven market expansion in recent years. The report also explores market dynamics, regulatory scenarios, and technological advancements that are shaping the industry. It assesses the impact of external factors and global economic changes on market growth. Lastly, it provides strategic recommendations for new entrants and established companies to navigate the complexities of the market.

Future Outlook:

  • AI-driven automation will reshape asset monitoring and preventive service cycles.
  • Cloud platforms will gain wider use for centralized command and remote operations.
  • Smart workplace tools will expand to support hybrid workforce models.
  • Predictive maintenance systems will reduce downtime for critical building assets.
  • Energy optimization tools will gain traction across sustainability-focused portfolios.
  • Integrated security and access systems will strengthen compliance in sensitive sectors.
  • Space analytics will guide flexible workplace layouts across major regions.
  • Vendor partnerships will expand to link hardware, software, and managed services.
  • Smart city initiatives will boost deployment across public-sector infrastructure.

CHAPTER NO. 1 : INTRODUCTION 29

1.1. Report Description 29

Purpose of the Report 29

USP & Key Offerings 29

1.1.1. Key Benefits for Stakeholders 30

1.1.2. Target Audience 30

1.2. Report Scope 31

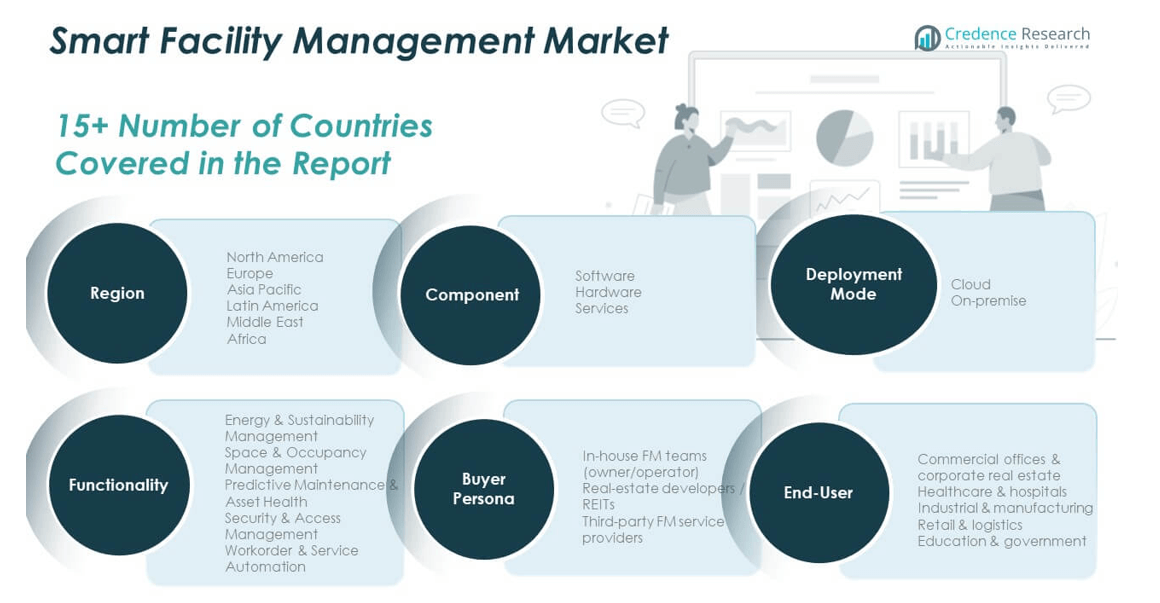
1.3. Regional Scope 32

CHAPTER NO. 2 : EXECUTIVE SUMMARY 33

2.1. Smart Facility Management Market Snapshot 33

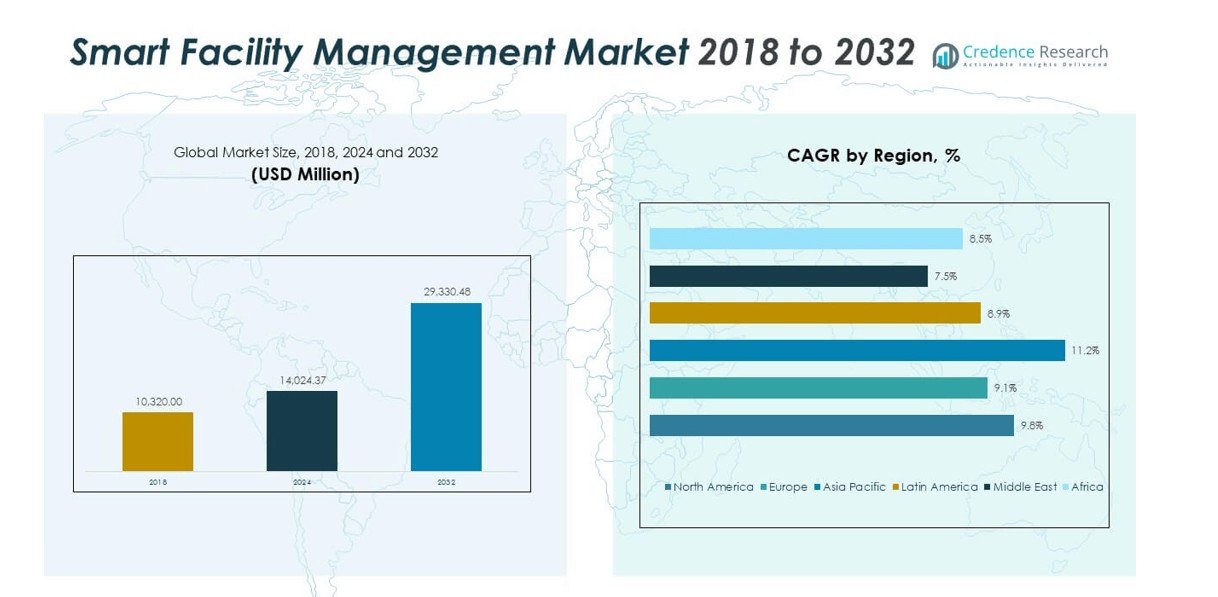
2.1.1. Global Smart Facility Management Market, 2020 – 2033 (USD Million) 35

2.2. Insights from Primary Respondents 36

CHAPTER NO. 3 : GEOPOLITICAL CRISIS IMPACT ANALYSIS 37

3.1. Russia-Ukraine and Israel-Palestine War Impacts 37

CHAPTER NO. 4 : SMART FACILITY MANAGEMENT MARKET INDUSTRY ANALYSIS 38

4.1. Introduction 38

4.2. Market Drivers 39

4.2.1. Growing Adoption of IoT and AI in Building Operations 40

4.2.2. Rising Focus on Energy Efficiency and Sustainability 41

4.3. Market Restraints 42

4.3.1. High Initial Investment and Implementation Costs 43

4.4. Market Opportunities 44

4.4.1. Market Opportunity Analysis 44

4.5. Porter’s Five Forces Analysis 45

CHAPTER NO. 5 : ANALYSIS COMPETITIVE LANDSCAPE 46

5.1. Company Market Share Analysis 2024 46

5.1.1. Global Smart Facility Management Market: Company Market Share, by Revenue, 2024 46

5.1.2. Global Smart Facility Management Market: Top 6 Company Market Share, by Revenue, 2024 47

5.1.3. Global Smart Facility Management Market: Top 3 Company Market Share, by Revenue, 2024 48

5.2. Global Smart Facility Management Market Company Revenue Market Share, 2023 49

5.3. Company Assessment Metrics, 2024 51

5.3.1. Stars 51

5.3.2. Emerging Leaders 51

5.3.3. Pervasive Players 51

5.3.4. Participants 51

5.4. Start-ups /SMEs Assessment Metrics, 2024 52

5.4.1. Progressive Companies 52

5.4.2. Responsive Companies 52

5.4.3. Dynamic Companies 52

5.4.4. Starting Blocks 52

5.5. Strategic Developments 53

5.5.1. Acquisitions & Mergers 53

5.5.2. New Product Launch 53

5.5.3. Regional Expansion 54

5.6. Key Players Product Matrix 55

CHAPTER NO. 6 : PESTEL & ADJACENT MARKET ANALYSIS 57

6.1. PESTEL 57

6.1.1. Political Factors 57

6.1.2. Economic Factors 57

6.1.3. Social Factors 57

6.1.4. Technological Factors 57

6.1.5. Environmental Factors 57

6.1.6. Legal Factors 57

6.2. Adjacent Market Analysis 57

CHAPTER NO. 7 : SMART FACILITY MANAGEMENT MARKET BY COMPONENT SEGMENT ANALYSIS 58

7.1. Smart Facility Management Market Overview, by Component Segment 58

7.1.1. Smart Facility Management Market Revenue Share, By Component, 2024 & 2033 59

7.1.2. Smart Facility Management Market Attractiveness Analysis, By Component 60

7.1.3. Incremental Revenue Growth Opportunity, by Component, 2026 – 2033 61

7.1.4. Smart Facility Management Market Revenue, By Component, 2020, 2024, 2029 & 2033 62

7.2. Software 63

7.3. Hardware 64

7.4. Services 65

CHAPTER NO. 8 : SMART FACILITY MANAGEMENT MARKET BY DEPLOYMENT MODE SEGMENT ANALYSIS 66

8.1. Smart Facility Management Market Overview, by Deployment Mode Segment 66

8.1.1. Smart Facility Management Market Revenue Share, By Deployment Mode, 2024 & 2033 67

8.1.2. Smart Facility Management Market Attractiveness Analysis, By Deployment Mode 68

8.1.3. Incremental Revenue Growth Opportunity, by Deployment Mode, 2026 – 2033 69

8.1.4. Smart Facility Management Market Revenue, By Deployment Mode, 2020, 2024, 2029 & 2033 70

8.2. Cloud 71

8.3. On-premise 72

CHAPTER NO. 9 : SMART FACILITY MANAGEMENT MARKET BY END-USER SEGMENT ANALYSIS 73

9.1. Smart Facility Management Market Overview, by End-user Segment 73

9.1.1. Smart Facility Management Market Revenue Share, By End-user, 2024 & 2033 74

9.1.2. Smart Facility Management Market Attractiveness Analysis, By End-user 75

9.1.3. Incremental Revenue Growth Opportunity, by End-user, 2026 – 2033 76

9.1.4. Smart Facility Management Market Revenue, By End-user, 2020, 2024, 2029 & 2033 77

9.2. Commercial offices & corporate real estate 78

9.3. Healthcare & hospitals 79

9.4. Industrial & manufacturing 80

9.5. Retail & logistics 81

9.6. Education & government 82

CHAPTER NO. 10 : SMART FACILITY MANAGEMENT MARKET BY FUNCTIONALITY SEGMENT ANALYSIS 83

10.1. Smart Facility Management Market Overview, by Functionality Segment 83

10.1.1. Smart Facility Management Market Revenue Share, By Functionality, 2024 & 2033 84

10.1.2. Smart Facility Management Market Attractiveness Analysis, By Functionality 85

10.1.3. Incremental Revenue Growth Opportunity, by Functionality, 2026 – 2033 86

10.1.4. Smart Facility Management Market Revenue, By Functionality, 2020, 2024, 2029 & 2033 87

10.2. Energy & Sustainability Management 88

10.3. Space & Occupancy Management 89

10.4. Predictive Maintenance & Asset Health 90

10.5. Security & Access Management 91

10.6. Workorder & Service Automation 92

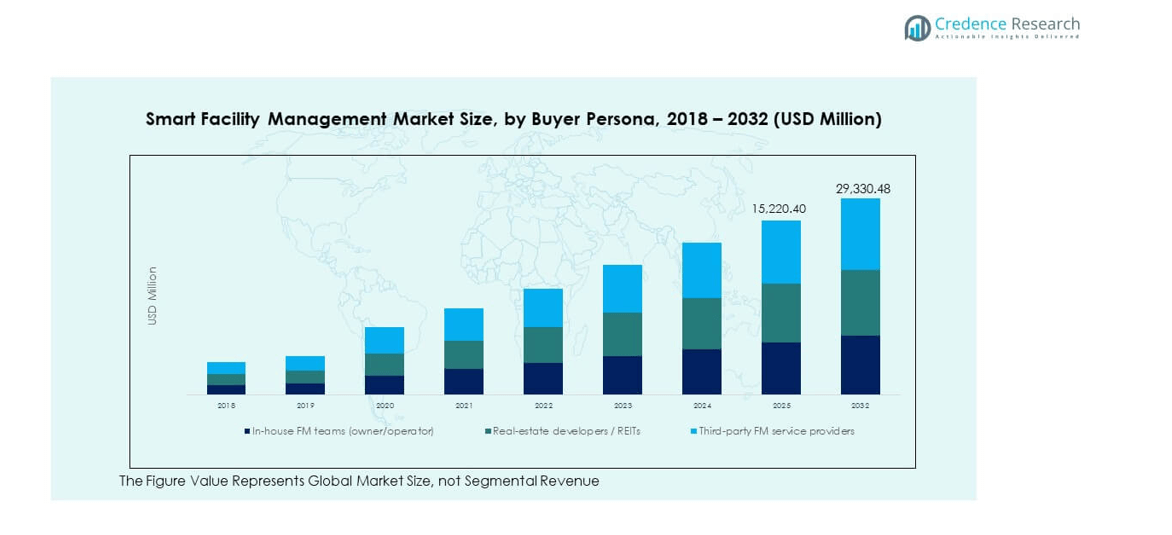
CHAPTER NO. 11 : SMART FACILITY MANAGEMENT MARKET BY BUYER PERSONA SEGMENT ANALYSIS 93

11.1. Smart Facility Management Market Overview, by Buyer Persona Segment 93

11.1.1. Smart Facility Management Market Revenue Share, By Sales Channel, 2024 & 2033 94

11.1.2. Smart Facility Management Market Attractiveness Analysis, By Sales Channel 95

11.1.3. Incremental Revenue Growth Opportunity, by Sales Channel, 2026 – 2033 96

11.1.4. Smart Facility Management Market Revenue, By Sales Channel, 2020, 2024, 2029 & 2033 97

11.2. In-house FM teams (owner/operator) 98

11.3. Real-estate developers / REITs 99

11.4. Third-party FM service providers 100

CHAPTER NO. 12 : SMART FACILITY MANAGEMENT MARKET REGIONAL ANALYSIS 101

12.1. Smart Facility Management Market Overview, by Regional Segments 101

12.2. Region 102

12.2.1. Global Smart Facility Management Market Revenue Share, By Region, 2024 & 2033 102

12.2.2. Smart Facility Management Market Attractiveness Analysis, By Region 103

12.2.3. Incremental Revenue Growth Opportunity, by Region, 2025 – 2033 104

12.2.4. Smart Facility Management Market Revenue, By Region, 2020, 2024, 2029 & 2033 105

CHAPTER NO. 13 : SMART FACILITY MANAGEMENT MARKET NORTH AMERICA 106

13.1. North America 106

13.1.1. Key Highlights 107

13.1.2. North America Smart Facility Management Market Revenue, By Country, 2020 – 2025 (USD Million) 108

13.1.3. North America Smart Facility Management Market Revenue, By Component, 2020 – 2025 (USD Million) 109

13.1.4. North America Smart Facility Management Market Revenue, By Deployment Mode, 2020 – 2025 (USD Million) 110

13.1.5. North America Smart Facility Management Market Revenue, By End-user, 2020 – 2025 (USD Million) 112

13.1.6. North America Smart Facility Management Market Revenue, By Functionality, 2020 – 2025 (USD Million) 114

13.1.7. North America Smart Facility Management Market Revenue, By Sales Channel, 2020 – 2025 (USD Million) 116

13.2. U.S. 118

13.3. Canada 118

13.4. Mexico 118

CHAPTER NO. 14 : SMART FACILITY MANAGEMENT MARKET EUROPE 119

14.1. Europe 119

14.1.1. Key Highlights 120

14.1.2. Europe Smart Facility Management Market Revenue, By Country, 2020 – 2025 (USD Million) 121

14.1.3. Europe Smart Facility Management Market Revenue, By Component, 2020 – 2025 (USD Million) 123

14.1.4. Europe Smart Facility Management Market Revenue, By Deployment Mode, 2020 – 2025 (USD Million) 124

14.1.5. Europe Smart Facility Management Market Revenue, By End-user, 2020 – 2025 (USD Million) 126

14.1.6. Europe Smart Facility Management Market Revenue, By Functionality, 2020 – 2025 (USD Million) 128

14.1.7. Europe Smart Facility Management Market Revenue, By Sales Channel, 2020 – 2025 (USD Million) 130

14.2. UK 132

14.3. France 132

14.4. Germany 132

14.5. Italy 132

14.6. Spain 132

14.7. Russia 132

14.8. Belgium 132

14.9. Netherland 132

14.10. Austria 132

14.11. Sweden 132

14.12. Poland 132

14.13. Denmark 132

14.14. Switzerland 132

14.15. Rest of Europe 132

CHAPTER NO. 15 : SMART FACILITY MANAGEMENT MARKET ASIA PACIFIC 133

15.1. Asia Pacific 133

15.1.1. Key Highlights 134

15.1.2. Asia Pacific Smart Facility Management Market Revenue, By Country, 2020 – 2025 (USD Million) 135

15.1.3. Asia Pacific Smart Facility Management Market Revenue, By Component, 2020 – 2025 (USD Million) 137

15.1.4. Asia Pacific Smart Facility Management Market Revenue, By Deployment Mode, 2020 – 2025 (USD Million) 138

15.1.5. Asia Pacific Smart Facility Management Market Revenue, By End-user, 2020 – 2025 (USD Million) 140

15.1.6. Asia Pacific Smart Facility Management Market Revenue, By Functionality, 2020 – 2025 (USD Million) 142

15.1.7. Asia Pacific Smart Facility Management Market Revenue, By Sales Channel, 2020 – 2025 (USD Million) 144

15.2. China 146

15.3. Japan 146

15.4. South Korea 146

15.5. India 146

15.6. Australia 146

15.7. Thailand 146

15.8. Indonesia 146

15.9. Vietnam 146

15.10. Malaysia 146

15.11. Philippines 146

15.12. Taiwan 146

15.13. Rest of Asia Pacific 146

CHAPTER NO. 16 : SMART FACILITY MANAGEMENT MARKET LATIN AMERICA 147

16.1. Latin America 147

16.1.1. Key Highlights 148

16.1.2. Latin America Smart Facility Management Market Revenue, By Country, 2020 – 2025 (USD Million) 149

16.1.3. Latin America Smart Facility Management Market Revenue, By Component, 2020 – 2025 (USD Million) 151

16.1.4. Latin America Smart Facility Management Market Revenue, By Deployment Mode, 2020 – 2025 (USD Million) 152

16.1.5. Latin America Smart Facility Management Market Revenue, By End-user, 2020 – 2025 (USD Million) 154

16.1.6. Latin America Smart Facility Management Market Revenue, By Functionality, 2020 – 2025 (USD Million) 156

16.1.7. Latin America Smart Facility Management Market Revenue, By Sales Channel, 2020 – 2025 (USD Million) 158

16.2. Brazil 160

16.3. Argentina 160

16.4. Peru 160

16.5. Chile 160

16.6. Colombia 160

16.7. Rest of Latin America 160

CHAPTER NO. 17 : SMART FACILITY MANAGEMENT MARKET MIDDLE EAST 161

17.1. Middle East 161

17.1.1. Key Highlights 162

17.1.2. Middle East Smart Facility Management Market Revenue, By Country, 2020 – 2025 (USD Million) 163

17.1.3. Middle East Smart Facility Management Market Revenue, By Component, 2020 – 2025 (USD Million) 165

17.1.4. Middle East Smart Facility Management Market Revenue, By Deployment Mode, 2020 – 2025 (USD Million) 166

17.1.5. Middle East Smart Facility Management Market Revenue, By End-user, 2020 – 2025 (USD Million) 168

17.1.6. Middle East Smart Facility Management Market Revenue, By Functionality, 2020 – 2025 (USD Million) 170

17.1.7. Middle East Smart Facility Management Market Revenue, By Sales Channel, 2020 – 2025 (USD Million) 172

17.2. UAE 174

17.3. KSA 174

17.4. Israel 174

17.5. Turkey 174

17.6. Iran 174

17.7. Rest of Middle East 174

CHAPTER NO. 18 : SMART FACILITY MANAGEMENT MARKET AFRICA 175

18.1. Africa 175

18.1.1. Key Highlights 176

18.1.2. Africa Smart Facility Management Market Revenue, By Country, 2020 – 2025 (USD Million) 177

18.1.3. Africa Smart Facility Management Market Revenue, By Component, 2020 – 2025 (USD Million) 179

18.1.4. Africa Smart Facility Management Market Revenue, By Deployment Mode, 2020 – 2025 (USD Million) 180

18.1.5. Africa Smart Facility Management Market Revenue, By End-user, 2020 – 2025 (USD Million) 182

18.1.6. Africa Smart Facility Management Market Revenue, By Functionality, 2020 – 2025 (USD Million) 184

18.1.7. Africa Smart Facility Management Market Revenue, By Sales Channel, 2020 – 2025 (USD Million) 186

18.2. Egypt 188

18.3. Nigeria 188

18.4. Algeria 188

18.5. Morocco 188

18.6. Rest of Africa 188

CHAPTER NO. 19 : COMPANY PROFILES 189

19.1. Siemens 189

19.1.1. Company Overview 189

19.1.2. Product Portfolio 189

19.1.3. Financial Overview 190

19.2. Honeywell 191

19.3. Johnson Controls 191

19.4. Schneider Electric 191

19.5. ABB 191

19.6. Company 6 191

19.7. Company 7 191

19.8. Company 8 191

19.9. Company 9 191

19.10. Company 10 191

19.11. Company 11 191

19.12. Company 12 191

19.13. Company 13 191

19.14. Company 14 191

List of Figures

FIG NO. 1. Global Smart Facility Management Market Revenue, 2020 – 2033 (USD Million) 35

FIG NO. 2. Porter’s Five Forces Analysis for Global Smart Facility Management Market 45

FIG NO. 3. Company Share Analysis, 2024 46

FIG NO. 4. Company Share Analysis, 2024 47

FIG NO. 5. Company Share Analysis, 2024 48

FIG NO. 6. Smart Facility Management Market Company Revenue Market Share, 2023 49

FIG NO. 7. Company Assessment Metrics, 2024 51

FIG NO. 8. Smart Facility Management Market Revenue Share, By Component, 2024 & 2033 59

FIG NO. 9. Market Attractiveness Analysis, By Component 60

FIG NO. 10. Incremental Revenue Growth Opportunity by Component, 2026 – 2033 61

FIG NO. 11. Smart Facility Management Market Revenue, By Component, 2020, 2024, 2029 & 2033 62

FIG NO. 12. Global Smart Facility Management Market for Software, Revenue (USD Million) 2020 – 2033 63

FIG NO. 13. Global Smart Facility Management Market for Hardware, Revenue (USD Million) 2020 – 2033 64

FIG NO. 14. Global Smart Facility Management Market for Services, Revenue (USD Million) 2020 – 2033 65

FIG NO. 15. Smart Facility Management Market Revenue Share, By Deployment Mode, 2024 & 2033 67

FIG NO. 16. Market Attractiveness Analysis, By Deployment Mode 68

FIG NO. 17. Incremental Revenue Growth Opportunity by Deployment Mode, 2026 – 2033 69

FIG NO. 18. Smart Facility Management Market Revenue, By Deployment Mode, 2020, 2024, 2029 & 2033 70

FIG NO. 19. Global Smart Facility Management Market for Cloud, Revenue (USD Million) 2020 – 2033 71

FIG NO. 20. Global Smart Facility Management Market for On-premise, Revenue (USD Million) 2020 – 2033 72

FIG NO. 21. Smart Facility Management Market Revenue Share, By End-user, 2024 & 2033 74

FIG NO. 22. Market Attractiveness Analysis, By End-user 75

FIG NO. 23. Incremental Revenue Growth Opportunity by End-user, 2026 – 2033 76

FIG NO. 24. Smart Facility Management Market Revenue, By End-user, 2020, 2024, 2029 & 2033 77

FIG NO. 25. Global Smart Facility Management Market for Commercial offices & corporate real estate, Revenue (USD Million) 2020 – 2033 78

FIG NO. 26. Global Smart Facility Management Market for Healthcare & hospitals, Revenue (USD Million) 2020 – 2033 79

FIG NO. 27. Global Smart Facility Management Market for Industrial & manufacturing, Revenue (USD Million) 2020 – 2033 80

FIG NO. 28. Global Smart Facility Management Market for Retail & logistics, Revenue (USD Million) 2020 – 2033 81

FIG NO. 29. Global Smart Facility Management Market for Education & government, Revenue (USD Million) 2020 – 2033 82

FIG NO. 30. Smart Facility Management Market Revenue Share, By Functionality, 2024 & 2033 84

FIG NO. 31. Market Attractiveness Analysis, By Functionality 85

FIG NO. 32. Incremental Revenue Growth Opportunity by Functionality, 2026 – 2033 86

FIG NO. 33. Smart Facility Management Market Revenue, By Functionality, 2020, 2024, 2029 & 2033 87

FIG NO. 34. Global Smart Facility Management Market for Energy & Sustainability Management, Revenue (USD Million) 2020 – 2033 88

FIG NO. 35. Global Smart Facility Management Market for Space & Occupancy Management, Revenue (USD Million) 2020 – 2033 89

FIG NO. 36. Global Smart Facility Management Market for Predictive Maintenance & Asset Health, Revenue (USD Million) 2020 – 2033 90

FIG NO. 37. Global Smart Facility Management Market for Security & Access Management, Revenue (USD Million) 2020 – 2033 91

FIG NO. 38. Global Smart Facility Management Market for Workorder & Service Automation, Revenue (USD Million) 2020 – 2033 92

FIG NO. 39. Smart Facility Management Market Revenue Share, By Sales Channel, 2024 & 2033 94

FIG NO. 40. Market Attractiveness Analysis, By Sales Channel 95

FIG NO. 41. Incremental Revenue Growth Opportunity by Sales Channel, 2026 – 2033 96

FIG NO. 42. Smart Facility Management Market Revenue, By Sales Channel, 2020, 2024, 2029 & 2033 97

FIG NO. 43. Global Smart Facility Management Market for In-house FM teams (owner/operator), Revenue (USD Million) 2020 – 2033 98

FIG NO. 44. Global Smart Facility Management Market for Real-estate developers / REITs, Revenue (USD Million) 2020 – 2033 99

FIG NO. 45. Global Smart Facility Management Market for Third-party FM service providers, Revenue (USD Million) 2020 – 2033 100

FIG NO. 46. Global Smart Facility Management Market Revenue Share, By Region, 2024 & 2033 102

FIG NO. 47. Market Attractiveness Analysis, By Region 103

FIG NO. 48. Incremental Revenue Growth Opportunity by Region, 2025 – 2033 104

FIG NO. 49. Smart Facility Management Market Revenue, By Region, 2020, 2024, 2029 & 2033 105

FIG NO. 50. North America Smart Facility Management Market Revenue, 2020 2033 (USD Million) 106

FIG NO. 51. Europe Smart Facility Management Market Revenue, 2020 2033 (USD Million) 119

FIG NO. 52. Asia Pacific Smart Facility Management Market Revenue, 2020 2033 (USD Million) 133

FIG NO. 53. Latin America Smart Facility Management Market Revenue, 2020 2033 (USD Million) 147

FIG NO. 54. Middle East Smart Facility Management Market Revenue, 2020 2033 (USD Million) 161

FIG NO. 55. Africa Smart Facility Management Market Revenue, 2020 2033 (USD Million) 175

List of Tables

TABLE NO. 1. : Global Smart Facility Management Market: Snapshot 33

TABLE NO. 2. : Drivers for the Smart Facility Management Market: Impact Analysis 39

TABLE NO. 3. : Restraints for the Smart Facility Management Market: Impact Analysis 42

TABLE NO. 4. : North America Smart Facility Management Market Revenue, By Country, 2020 – 2025 (USD Million) 108

TABLE NO. 5. : North America Smart Facility Management Market Revenue, By Country, 2026 – 2033 (USD Million) 108

TABLE NO. 6. : North America Smart Facility Management Market Revenue, By Component, 2020 – 2025 (USD Million) 109

TABLE NO. 7. : North America Smart Facility Management Market Revenue, By Component, 2026 – 2033 (USD Million) 109

TABLE NO. 8. : North America Smart Facility Management Market Revenue, By Deployment Mode, 2020 – 2025 (USD Million) 110

TABLE NO. 9. : North America Smart Facility Management Market Revenue, By Deployment Mode, 2026 – 2033 (USD Million) 110

TABLE NO. 10. : North America Smart Facility Management Market Revenue, By End-user, 2020 – 2025 (USD Million) 112

TABLE NO. 11. : North America Smart Facility Management Market Revenue, By End-user, 2026 – 2033 (USD Million) 112

TABLE NO. 12. : North America Smart Facility Management Market Revenue, By Functionality, 2020 – 2025 (USD Million) 114

TABLE NO. 13. : North America Smart Facility Management Market Revenue, By Functionality, 2026 – 2033 (USD Million) 114

TABLE NO. 14. : North America Smart Facility Management Market Revenue, By Sales Channel, 2020 – 2025 (USD Million) 116

TABLE NO. 15. : North America Smart Facility Management Market Revenue, By Sales Channel, 2026 – 2033 (USD Million) 116

TABLE NO. 16. : Europe Smart Facility Management Market Revenue, By Country, 2020 – 2025 (USD Million) 121

TABLE NO. 17. : Europe Smart Facility Management Market Revenue, By Country, 2026 – 2033 (USD Million) 122

TABLE NO. 18. : Europe Smart Facility Management Market Revenue, By Component, 2020 – 2025 (USD Million) 123

TABLE NO. 19. : Europe Smart Facility Management Market Revenue, By Component, 2026 – 2033 (USD Million) 123

TABLE NO. 20. : Europe Smart Facility Management Market Revenue, By Deployment Mode, 2020 – 2025 (USD Million) 124

TABLE NO. 21. : Europe Smart Facility Management Market Revenue, By Deployment Mode, 2026 – 2033 (USD Million) 124

TABLE NO. 22. : Europe Smart Facility Management Market Revenue, By End-user, 2020 – 2025 (USD Million) 126

TABLE NO. 23. : Europe Smart Facility Management Market Revenue, By End-user, 2026 – 2033 (USD Million) 126

TABLE NO. 24. : Europe Smart Facility Management Market Revenue, By Functionality, 2020 – 2025 (USD Million) 128

TABLE NO. 25. : Europe Smart Facility Management Market Revenue, By Functionality, 2026 – 2033 (USD Million) 128

TABLE NO. 26. : Europe Smart Facility Management Market Revenue, By Sales Channel, 2020 – 2025 (USD Million) 130

TABLE NO. 27. : Europe Smart Facility Management Market Revenue, By Sales Channel, 2026 – 2033 (USD Million) 130

TABLE NO. 28. : Asia Pacific Smart Facility Management Market Revenue, By Country, 2020 – 2025 (USD Million) 135

TABLE NO. 29. : Asia Pacific Smart Facility Management Market Revenue, By Country, 2026 – 2033 (USD Million) 136

TABLE NO. 30. : Asia Pacific Smart Facility Management Market Revenue, By Component, 2020 – 2025 (USD Million) 137

TABLE NO. 31. : Asia Pacific Smart Facility Management Market Revenue, By Component, 2026 – 2033 (USD Million) 137

TABLE NO. 32. : Asia Pacific Smart Facility Management Market Revenue, By Deployment Mode, 2020 – 2025 (USD Million) 138

TABLE NO. 33. : Asia Pacific Smart Facility Management Market Revenue, By Deployment Mode, 2026 – 2033 (USD Million) 138

TABLE NO. 34. : Asia Pacific Smart Facility Management Market Revenue, By End-user, 2020 – 2025 (USD Million) 140

TABLE NO. 35. : Asia Pacific Smart Facility Management Market Revenue, By End-user, 2026 – 2033 (USD Million) 140

TABLE NO. 36. : Asia Pacific Smart Facility Management Market Revenue, By Functionality, 2020 – 2025 (USD Million) 142

TABLE NO. 37. : Asia Pacific Smart Facility Management Market Revenue, By Functionality, 2026 – 2033 (USD Million) 142

TABLE NO. 38. : Asia Pacific Smart Facility Management Market Revenue, By Sales Channel, 2020 – 2025 (USD Million) 144

TABLE NO. 39. : Asia Pacific Smart Facility Management Market Revenue, By Sales Channel, 2026 – 2033 (USD Million) 144

TABLE NO. 40. : Latin America Smart Facility Management Market Revenue, By Country, 2020 – 2025 (USD Million) 149

TABLE NO. 41. : Latin America Smart Facility Management Market Revenue, By Country, 2026 – 2033 (USD Million) 150

TABLE NO. 42. : Latin America Smart Facility Management Market Revenue, By Component, 2020 – 2025 (USD Million) 151

TABLE NO. 43. : Latin America Smart Facility Management Market Revenue, By Component, 2026 – 2033 (USD Million) 151

TABLE NO. 44. : Latin America Smart Facility Management Market Revenue, By Deployment Mode, 2020 – 2025 (USD Million) 152

TABLE NO. 45. : Latin America Smart Facility Management Market Revenue, By Deployment Mode, 2026 – 2033 (USD Million) 152

TABLE NO. 46. : Latin America Smart Facility Management Market Revenue, By End-user, 2020 – 2025 (USD Million) 154

TABLE NO. 47. : Latin America Smart Facility Management Market Revenue, By End-user, 2026 – 2033 (USD Million) 154

TABLE NO. 48. : Latin America Smart Facility Management Market Revenue, By Functionality, 2020 – 2025 (USD Million) 156

TABLE NO. 49. : Latin America Smart Facility Management Market Revenue, By Functionality, 2026 – 2033 (USD Million) 156

TABLE NO. 50. : Latin America Smart Facility Management Market Revenue, By Sales Channel, 2020 – 2025 (USD Million) 158

TABLE NO. 51. : Latin America Smart Facility Management Market Revenue, By Sales Channel, 2026 – 2033 (USD Million) 158

TABLE NO. 52. : Middle East Smart Facility Management Market Revenue, By Country, 2020 – 2025 (USD Million) 163

TABLE NO. 53. : Middle East Smart Facility Management Market Revenue, By Country, 2026 – 2033 (USD Million) 164

TABLE NO. 54. : Middle East Smart Facility Management Market Revenue, By Component, 2020 – 2025 (USD Million) 165

TABLE NO. 55. : Middle East Smart Facility Management Market Revenue, By Component, 2026 – 2033 (USD Million) 165

TABLE NO. 56. : Middle East Smart Facility Management Market Revenue, By Deployment Mode, 2020 – 2025 (USD Million) 166

TABLE NO. 57. : Middle East Smart Facility Management Market Revenue, By Deployment Mode, 2026 – 2033 (USD Million) 166

TABLE NO. 58. : Middle East Smart Facility Management Market Revenue, By End-user, 2020 – 2025 (USD Million) 168

TABLE NO. 59. : Middle East Smart Facility Management Market Revenue, By End-user, 2026 – 2033 (USD Million) 168

TABLE NO. 60. : Middle East Smart Facility Management Market Revenue, By Functionality, 2020 – 2025 (USD Million) 170

TABLE NO. 61. : Middle East Smart Facility Management Market Revenue, By Functionality, 2026 – 2033 (USD Million) 170

TABLE NO. 62. : Middle East Smart Facility Management Market Revenue, By Sales Channel, 2020 – 2025 (USD Million) 172

TABLE NO. 63. : Middle East Smart Facility Management Market Revenue, By Sales Channel, 2026 – 2033 (USD Million) 172

TABLE NO. 64. : Africa Smart Facility Management Market Revenue, By Country, 2020 – 2025 (USD Million) 177

TABLE NO. 65. : Africa Smart Facility Management Market Revenue, By Country, 2026 – 2033 (USD Million) 177

TABLE NO. 66. : Africa Smart Facility Management Market Revenue, By Component, 2020 – 2025 (USD Million) 179

TABLE NO. 67. : Africa Smart Facility Management Market Revenue, By Component, 2026 – 2033 (USD Million) 179

TABLE NO. 68. : Africa Smart Facility Management Market Revenue, By Deployment Mode, 2020 – 2025 (USD Million) 180

TABLE NO. 69. : Africa Smart Facility Management Market Revenue, By Deployment Mode, 2026 – 2033 (USD Million) 180

TABLE NO. 70. : Africa Smart Facility Management Market Revenue, By End-user, 2020 – 2025 (USD Million) 182

TABLE NO. 71. : Africa Smart Facility Management Market Revenue, By End-user, 2026 – 2033 (USD Million) 182

TABLE NO. 72. : Africa Smart Facility Management Market Revenue, By Functionality, 2020 – 2025 (USD Million) 184

TABLE NO. 73. : Africa Smart Facility Management Market Revenue, By Functionality, 2026 – 2033 (USD Million) 184

TABLE NO. 74. : Africa Smart Facility Management Market Revenue, By Sales Channel, 2020 – 2025 (USD Million) 186


TABLE NO. 75. : Africa Smart Facility Management Market Revenue, By Sales Channel, 2026 – 2033 (USD Million) 186

Request Free Sample

We prioritize the confidentiality and security of your data. Our promise: your information remains private.

Ready to Transform Data into Decisions?

Request Your Sample Report and Start Your Journey of Informed Choices


Providing the strategic compass for industry titans.

cr-clients-logos

Frequently Asked Questions

What is the current market size for the Global Smart Facility Management Market, and what is its projected size in 2032?

The Global Smart Facility Management Market recorded strong growth driven by higher adoption of digital building tools. The market expanded steadily across commercial, industrial, and public infrastructure. Future size projections indicate strong demand for predictive, cloud-enabled, and sustainability-focused platforms. Growth remains supported by investment across global regions.

At what Compound Annual Growth Rate is the Global Smart Facility Management Market projected to grow between 2025 and 2032?

The market is set to grow at a steady pace over the forecast timeline, supported by rising digital transformation activities. Strong adoption of AI, automation, and predictive systems drives expansion. Sustainability regulations also support consistent growth metrics across regions. Long-term adoption stays strong across enterprise buildings.

Which Global Smart Facility Management Market segment held the largest share in 2024?

The software segment held the leading share due to high use of analytics, automation, and integrated dashboards. Many enterprises rely on software tools to manage multi-site portfolios. Strong interest in cloud-based solutions further supports wider deployment. Adoption stays strong across corporate, healthcare, and industrial facilities.

What are the primary factors fueling the growth of the Global Smart Facility Management Market?

Key drivers include growing focus on operational efficiency, predictive maintenance, and energy optimization. Many enterprises use digital tools to streamline workflows and reduce downtime. Rising sustainability goals support faster adoption across global buildings. Strong investment in security and workplace systems further accelerates growth.

Who are the leading companies in the Global Smart Facility Management Market?

Major companies include Siemens, Honeywell, Johnson Controls, Schneider Electric, and ABB. These firms offer advanced platforms that integrate automation, monitoring, and analytics. Strong global networks support wide deployment across sectors. Their investments in AI and cloud platforms enhance long-term competitiveness.

About Author

Sushant Phapale

Sushant Phapale

ICT & Automation Expert

Sushant is an expert in ICT, automation, and electronics with a passion for innovation and market trends.

View Profile

Related Reports

Penetration Testing As A Service (PTaaS) Market

Penetration Testing As A Service PTaaS Market size was valued USD 128.5 million in 2024 and is anticipated to reach USD 458.05 million by 2032, at a CAGR of 17.22% during the forecast period.

Agentic AI Market

Agentic AI Market was valued at USD 5.74 billion in 2024 and is projected to reach USD 92.22 billion by 2032, growing at a CAGR of 41.51% during the forecast period.

Food NFT Market

Food NFT Market size was valued at USD 475.8 Million in 2024 and is anticipated to reach USD 1474.83 Million by 2032, at a CAGR of 15.19% during the forecast period.

Stuttering Devices Market

The Stuttering devices market is projected to grow from USD 911.81 million in 2024 to an estimated USD 1,650.55 million by 2032, with a compound annual growth rate (CAGR) of 7.7% from 2024 to 2032.

Disposable Camera Market

The Disposable camera market is projected to grow from USD 973.73 million in 2024 to an estimated USD 1532.18 million by 2032, with a CAGR of 5.83% from 2024 to 2032.

AI Aware Storage Market

AI-aware storage market size was valued USD 28,338 million in 2024 and is anticipated to reach USD 153,357.4 million by 2032, at a CAGR of 23.5% during the forecast period.

Egypt E-Commerce Market

The Egypt E-Commerce Market size was valued at USD 6,800.00 million in 2018, reached USD 10,378.21 million in 2024, and is anticipated to reach USD 29,052.43 million by 2032, at a CAGR of 13.88% during the forecast period.

Italy Optical Transport Services Market

The Italy Optical Transport Services Market was valued at USD 1,013.04 million in 2018, and is expected to reach USD 1,641.3 million by 2024. The market is projected to grow significantly, reaching USD 3,671.3 million by 2032, at a compound annual growth rate (CAGR) of 12.89% during the forecast period.

Space Situational Awareness Market

The Space Situational Awareness Market size was valued at USD 1,730.88 Million in 2024 and is anticipated to reach USD 2,480.39 Million by 2032, at a CAGR of 4.6% during the forecast period.

Oil and Gas Accounting Software Market

The Oil And Gas Accounting Software Market size was valued USD  1,980.5  Million in 2024 and is anticipated to reach USD  3,327.29  Million by 2032, at a CAGR of 6.7 % during the forecast period.

North America Grid Modernization Market

The North America Grid Modernization Market size was valued at USD 9,658.6 Billion in 2018, and is projected to reach USD 15,225.5 Billion in 2024, growing at a Compound Annual Growth Rate (CAGR) of 9.89% during the forecast period. The market is expected to further expand to USD 32,020.2 Billion by 2032.

Quantum Computing-As-A-Service (QCaaS) Market

The Quantum Computing-As-A-Service (QCaaS) Market size was valued at USD 640.00 million in 2018, reaching USD 1,817.96 million in 2024 and is anticipated to reach USD 18,598.33 million by 2032, at a CAGR of 33.88% during the forecast period.

Licence Option

The report comes as a view-only PDF document, optimized for individual clients. This version is recommended for personal digital use and does not allow printing. Use restricted to one purchaser only.
$4999

To meet the needs of modern corporate teams, our report comes in two formats: a printable PDF and a data-rich Excel sheet. This package is optimized for internal analysis. Unlimited users allowed within one corporate location (e.g., regional office).
$6999

The report will be delivered in printable PDF format along with the report’s data Excel sheet. This license offers 100 Free Analyst hours where the client can utilize Credence Research Inc. research team. Permitted for unlimited global use by all users within the purchasing corporation, such as all employees of a single company.
$12999

Report delivery within 24 to 48 hours

Credence Staff 3

WILLIAM, North America

Support Staff at Credence Research

KEITH PHILLIPS, Europe

Lee - CR Sales Staff

LEE VALLANCE, Asia Pacific

Kieran Jameson

KIERAN JAMESON, Australia

Smallform of Sample request
User Review

Thank you for the data! The numbers are exactly what we asked for and what we need to build our business case.

Materials Scientist
(privacy requested)

User Review

The report was an excellent overview of the Industrial Burners market. This report does a great job of breaking everything down into manageable chunks.

Imre Hof
Management Assistant, Bekaert

cr-clients-logos

Request Sample