
Market Overview:
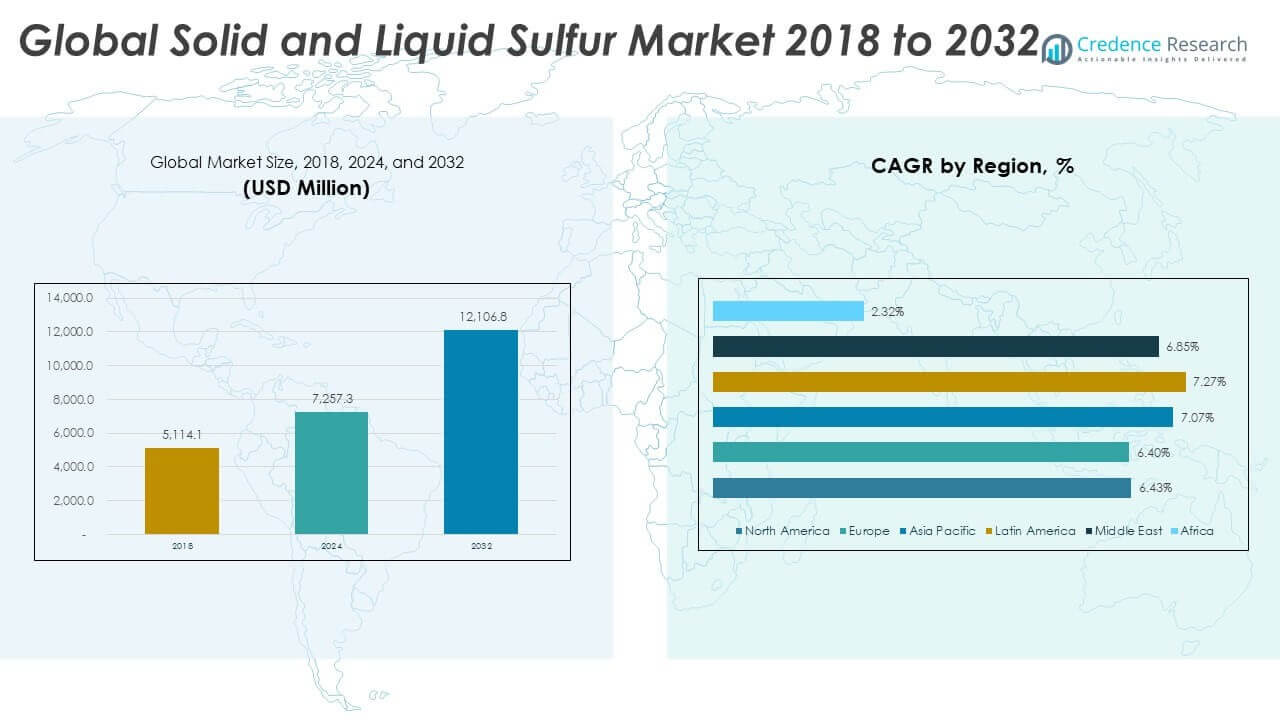
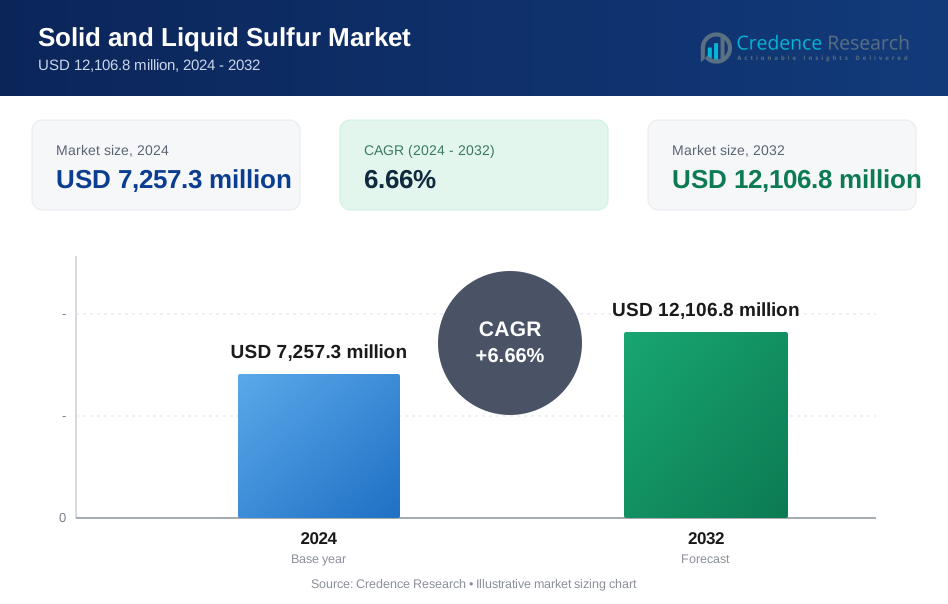
The Global Solid and Liquid Sulfur Market size was valued at USD 5,114.1 million in 2018 to USD 7,257.3 million in 2024 and is anticipated to reach USD 12,106.8 million by 2032, at a CAGR of 6.66% during the forecast period.
| REPORT ATTRIBUTE | DETAILS |
|---|---|
| Historical Period | 2020-2023 |
| Base Year | 2024 |
| Forecast Period | 2025-2032 |
| Solid and Liquid Sulfur Market Size 2024 | USD 7,257.3 million |
| Solid and Liquid Sulfur Market, CAGR | 6.66% |
| Solid and Liquid Sulfur Market Size 2032 | USD 12,106.8 million |
The market is primarily driven by high demand for sulfur in fertilizer manufacturing, especially for sulfuric acid production in phosphate-based fertilizers. Expanding agricultural activity across Asia Pacific and Latin America increases fertilizer use. Petroleum refining also contributes to sulfur demand through hydrodesulfurization processes. Sulfur’s role in industrial chemicals, mining, and water treatment supports broader market stability. The integration of sulfur recovery in refineries ensures consistent supply. Environmental regulations and clean fuel mandates enhance sulfur capture and distribution. It further strengthens the role of sulfur in global commodity flows.
Asia Pacific leads the market due to strong fertilizer demand from countries like China and India, supported by domestic agriculture and chemical sectors. North America and Europe show stable consumption through refining and industrial use. The Middle East stands out as a major exporter with integrated recovery systems tied to energy production. Latin America continues to emerge as a high-growth region, supported by agriculture and imports. Africa remains an early-stage market, gradually expanding through trade and infrastructure improvements. It reflects a balanced global distribution with clear growth corridors.
Market Insights:
- The Global Solid and Liquid Sulfur Market was valued at USD 5,114.1 million in 2018, reached USD 7,257.3 million in 2024, and is projected to hit USD 12,106.8 million by 2032, expanding at a CAGR of 6.66% during the forecast period.
- Asia Pacific led the market in 2024 with about 33.4% share, driven by strong fertilizer demand in China and India, followed by Europe at nearly 26.6% due to a mature chemical sector, and North America at around 23.4% supported by large refining capacity.
- Latin America is the fastest-growing region, holding about 9.1% share in 2024, supported by rising agricultural fertilizer use, expanding phosphate production, and increasing reliance on sulfur imports.
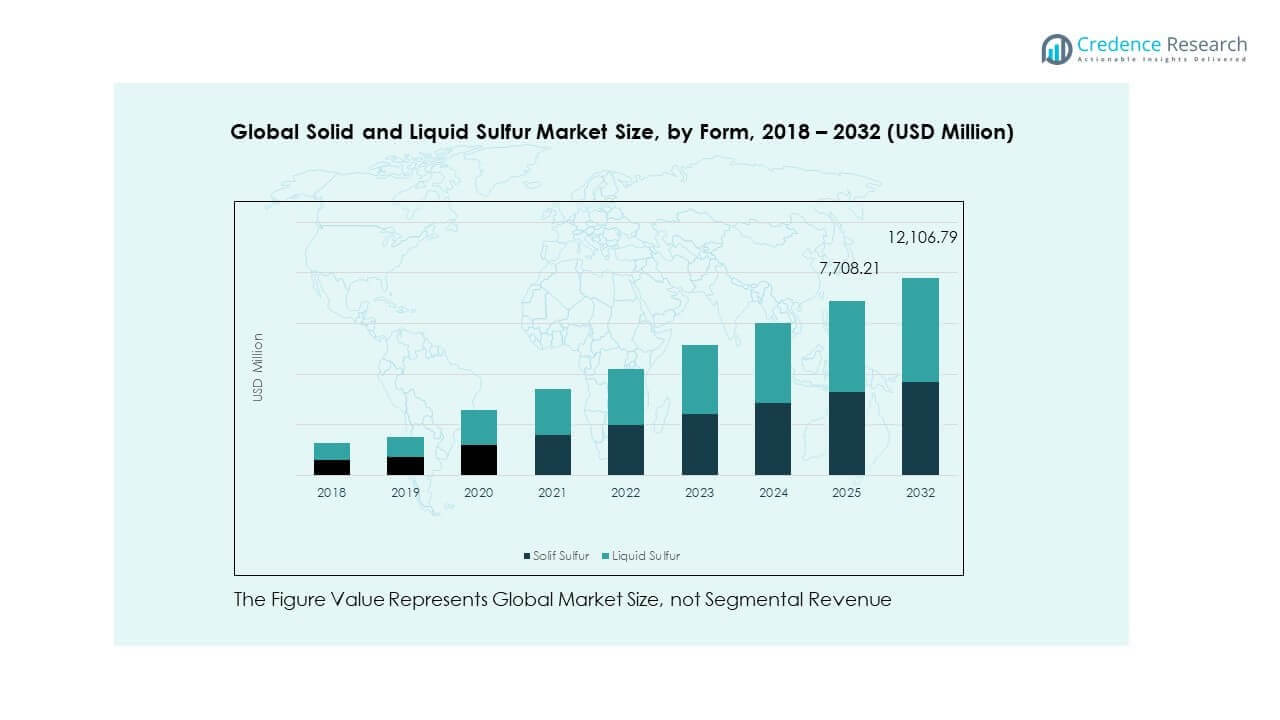
- By form, liquid sulfur accounted for roughly 63.6% share in 2032, reflecting higher use in refining and chemical processing that favors continuous and molten feedstock.
- Solid sulfur represented about 36.4% share in 2032, with strong demand for granular and powdered forms in fertilizer blending, storage efficiency, and bulk agricultural distribution.
Market Drivers
Rising Demand for Sulfur in Fertilizer Manufacturing Across Major Agricultural Economies
Fertilizer producers drive the Global Solid and Liquid Sulfur Market due to increasing use of sulfur in phosphate-based fertilizers. Sulfuric acid plays a crucial role in phosphate fertilizer production and crop nutrient formulation. Expanding agriculture output in countries like India and China boosts sulfur demand. Growing population pressure and food security programs increase fertilizer application across Asia-Pacific and Africa. Government initiatives promoting high-efficiency fertilizers also strengthen sulfur use. The market benefits from rising awareness about micronutrient deficiencies in soil. Higher crop yields depend on sulfur-enriched formulations. It strengthens fertilizer supply chains and supports long-term growth.
Increased Sulfur Use in Oil Refining Due to Regulatory Fuel Specifications
Stringent fuel quality regulations drive sulfur recovery from oil refineries. Refineries use hydrodesulfurization processes to remove sulfur from diesel and gasoline. The Global Solid and Liquid Sulfur Market benefits as low-sulfur fuel mandates expand globally. U.S. and European markets have implemented strict sulfur limits, creating steady demand. Asia-Pacific nations are also upgrading refining capacities to meet global benchmarks. Sulfur is captured from sour crude during refining and marketed to downstream consumers. Recovery systems have become more efficient, yielding high-purity sulfur. It supports circular refinery economics and ensures stable market supply.
- For instance, Saudi Aramco’s refineries recover several million tons of elemental sulfur each year through Claus technology. It supports circular refinery economics and stable sulfur supply.
Growing Demand from Chemical Manufacturing and Industrial Applications
Sulfur is widely used across multiple chemical production lines. Manufacturers rely on sulfur for sulfuric acid, carbon disulfide, and other key industrial chemicals. The Global Solid and Liquid Sulfur Market benefits from demand in rubber, mining, detergent, and textile sectors. It plays a central role in ore leaching and flotation in metal mining. Industrial zones in North America, Europe, and East Asia create stable downstream consumption. Infrastructure growth and rising metal demand boost mining chemicals. These segments create a diversified and stable market base. Sulfur’s versatility continues to support its industrial value.
- For instance, BASF operates multiple sulfuric acid plants integrated with chemical complexes exceeding one million tons capacity. Sulfur versatility reinforces long-term industrial relevance.
Expanding Applications in Pharmaceuticals, Pesticides, and Water Treatment
Rising health awareness and environmental safety regulations promote sulfur use in niche applications. The pharmaceutical industry uses sulfur-based compounds for certain antibiotics and dermatology treatments. The Global Solid and Liquid Sulfur Market also supports pesticide production, essential for crop protection. Urbanization has spurred demand for clean water, where sulfur-based coagulants help in treatment. These sectors contribute to a stable non-agricultural demand pool. Increasing global health expenditure and food security concerns support market expansion. Emerging countries improve water infrastructure using sulfur-treated solutions. It maintains momentum across diversified application areas.
Market Trends
Shift Toward Sulfur Recovery from Natural Gas and Alternative Sources
Natural gas processing plants have become key sulfur producers, supplementing refinery output. The Global Solid and Liquid Sulfur Market is witnessing a trend of increasing sulfur recovery from sour gas reserves. Countries like Qatar and Saudi Arabia lead gas-based sulfur exports. Recovery from oil sands and LNG projects expands sulfur availability. Technological upgrades improve yield and sulfur purity. This shift stabilizes global supply and reduces dependence on refineries alone. Sulfur sourced from gas often meets fertilizer-grade standards. It broadens the sourcing landscape and improves trade dynamics.
Integration of Logistics and Storage Infrastructure Across Major Exporting Regions
Countries with surplus sulfur production invest in bulk storage and port handling capacity. The Global Solid and Liquid Sulfur Market benefits from improved export efficiency and reduced handling costs. Middle Eastern producers deploy automated storage domes and enclosed conveyor systems. Canada and Russia also enhance rail and sea transport networks. Integrated logistics reduce weather exposure and contamination risks. High-purity sulfur reaches end-users more reliably. Infrastructure expansion supports long-term trade partnerships. It ensures consistent supply to high-demand regions in Asia and Africa.
- For instance, ADNOC’s Ruwais terminal includes a 40,000-ton sulfur storage dome and ship-loading conveyors with dust suppression systems.
Growing Focus on Granular Sulfur and Specialized Packaging Formats
Refiners and processors now convert liquid sulfur to solid granules for better handling. The Global Solid and Liquid Sulfur Market reflects this shift toward dust-free and low-moisture products. Granular sulfur offers better storage stability and is easier to apply in fertilizers. Demand rises from dry bulk traders and integrated fertilizer companies. Specialized bags and sealed containers prevent spillage and quality loss. Buyers prefer these formats for long-haul shipments. It improves product usability across transportation and application chains. Packaging innovation aligns with evolving end-user expectations.
- For instance, Saudi Aramco’s granulation facilities in Jubail produce over 5 million tons annually for export via bulk carriers. Granules reduce dust and caking during shipping, supporting direct application by end users.
Digital Tracking and Trade Monitoring in Sulfur Export-Import Activities
Global traders adopt digital tools to manage sulfur inventory and customs documentation. The Global Solid and Liquid Sulfur Market embraces traceability platforms for real-time shipment visibility. Blockchain and IoT-based systems track cargo quality and delivery schedules. Exporters use satellite-linked platforms for weather and route planning. Large buyers optimize procurement with real-time price benchmarking. These tools reduce risk, delays, and disputes. Digital systems improve transparency in cross-border transactions. It enhances supply chain performance and builds trust in sulfur trading.
Market Challenges Analysis
Volatility in Crude Oil Production and Refinery Operations Impacting Sulfur Availability
The Global Solid and Liquid Sulfur Market remains exposed to fluctuations in oil and gas supply. Refineries produce sulfur as a byproduct, so production varies with fuel processing activity. Geopolitical tensions or supply cuts disrupt sulfur output. The COVID-19 pandemic caused refinery slowdowns, which reduced sulfur volumes. OPEC decisions and shale output trends influence sulfur pricing. Market players face challenges in planning inventory due to uncertain availability. Import-dependent regions struggle to maintain steady supply. It creates price fluctuations and procurement uncertainty.
Environmental Regulations and Handling Constraints in Transportation and Storage
Sulfur transport and storage present environmental risks due to its reactive nature. The Global Solid and Liquid Sulfur Market faces regulatory pressure to follow safe handling norms. Leaching, corrosion, and emission hazards must be managed. Liquid sulfur requires heated tanks and insulated pipelines. Spills during transfer can contaminate soil and water bodies. Governments enforce strict safety and emissions compliance in storage terminals. Complying with these rules raises capital costs for logistics players. It creates entry barriers for smaller firms and limits flexibility.
Market Opportunities
Surging Fertilizer Demand Across Emerging Economies with Agricultural Expansion
Emerging markets across Africa, South Asia, and Southeast Asia are expanding crop production. The Global Solid and Liquid Sulfur Market sees strong opportunity in these regions due to soil deficiencies. Fertilizer producers seek cost-effective sulfur sources to boost productivity. Governments promote balanced fertilization to raise yields. Local blending facilities increase sulfur import demand. It supports long-term consumption growth in rural economies.
Industrial Investments in Mining, Rubber, and Water Treatment Driving Non-Agricultural Growth Infrastructure growth in metal extraction, textile, and water sectors creates demand beyond fertilizers. The Global Solid and Liquid Sulfur Market gains traction as more firms seek sulfur-based compounds. Water utilities and chemical plants invest in large-scale treatment systems. It supports sulfur demand stability across value chains. Exporters can diversify into emerging sectors for higher margins.
Market Segmentation Analysis:
By Form
The Global Solid and Liquid Sulfur Market is segmented into solid and liquid forms. Solid sulfur leads due to its ease of handling and longer storage life. Granular or powdered sulfur is favored in fertilizer manufacturing for uniform blending. Pellets and crushed lumps serve in rubber and industrial chemical applications. Sulfur blocks are used for bulk transport in export-heavy markets. Liquid sulfur, primarily in molten or slurry form, is used in continuous industrial operations. It is preferred in refining and chemical sectors with integrated infrastructure. Liquid form ensures better flow control and minimal dust hazards.
By Production Source
Petroleum and gas refining is the dominant production source segment. It contributes the largest sulfur volumes through hydrodesulfurization in crude processing. The Global Solid and Liquid Sulfur Market benefits from the expansion of refineries in Asia and the Middle East. Metallurgical and mining sulfur provides stable supply from copper, zinc, and nickel refining. This stream supports localized consumption in mining zones. Secondary and by-product industrial recovery is gaining relevance. It enables sulfur extraction from emissions control systems and waste-processing facilities. This source supports sustainability and resource circularity.
- For instance, Gazprom’s Astrakhan gas processing plant in Russia recovers over 1 million tons of sulfur annually from sour natural gas, reinforcing gas-based sulfur sourcing outside traditional refining.
By End User
Chemical and agrochemical manufacturers form the largest end-user segment. They consume sulfur in large volumes for sulfuric acid and fertilizers. Oil and gas operators use it in internal refining and desulfurization operations. Mining companies adopt sulfur for leaching and mineral extraction. Industrial utilities employ sulfur-based products in water and effluent treatment plants. The "others" category includes paper, textile, and pharmaceutical industries. It reflects the broad industrial integration of sulfur products. Demand remains stable across these verticals, supporting long-term market balance.
- For instance, Mosaic Company uses over 2.5 million tons of sulfur annually across its phosphate operations in North America for sulfuric acid production, supporting both fertilizer and industrial demand.
By Application
Chemical and fertilizer manufacturing is the top application segment. Sulfur is vital in phosphoric acid and compound fertilizer production. Water treatment facilities use sulfur compounds for purification and sludge control. The energy storage segment is expanding due to demand for sulfur-based battery technologies. It supports energy transition goals in developing markets. Petroleum refining maintains demand through process-level sulfur recovery and reuse. The "others" segment includes rubber processing and pharmaceuticals. It shows sulfur’s cross-sector relevance and utility. The market benefits from steady application diversity across global industries.
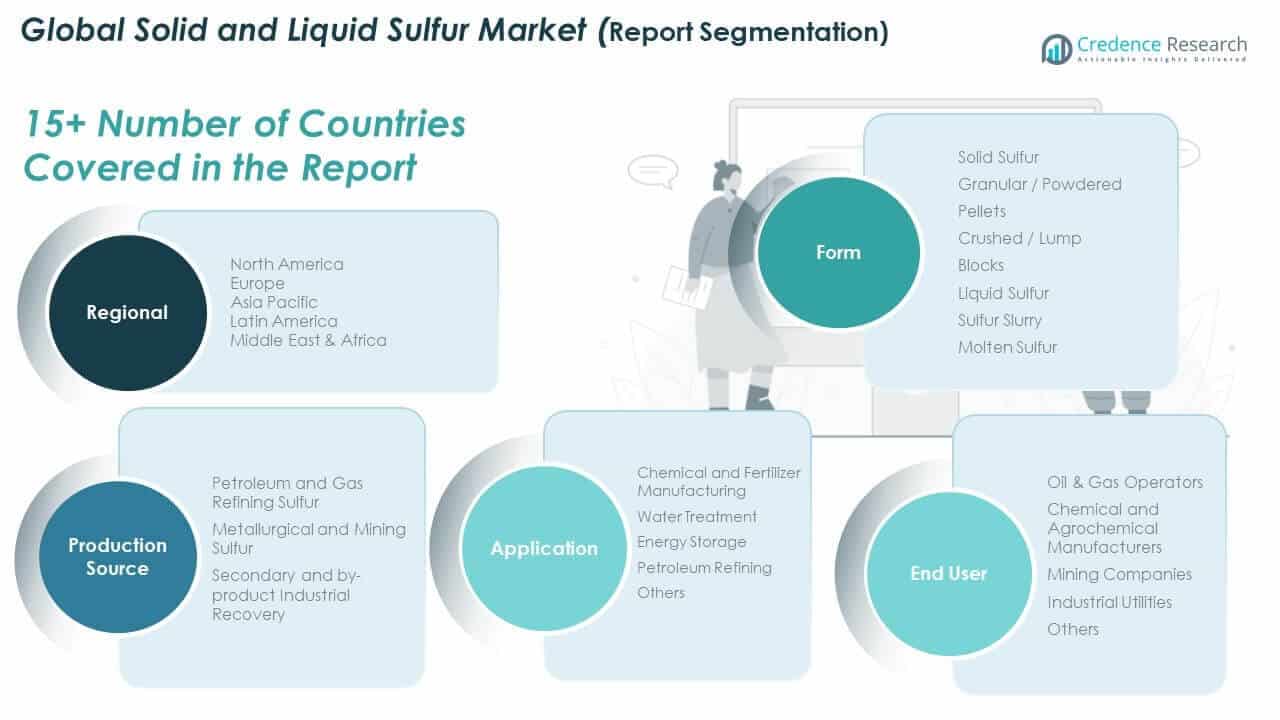
Segmentation:
By Form
- Solid Sulfur
- Granular / Powdered
- Pellets
- Crushed / Lump
- Blocks
- Liquid Sulfur
- Sulfur Slurry
- Molten Sulfur
By Production Source
- Petroleum and Gas Refining Sulfur
- Metallurgical and Mining Sulfur
- Secondary and By-product Industrial Recovery
By End User
- Oil & Gas Operators
- Chemical and Agrochemical Manufacturers
- Mining Companies
- Industrial Utilities
- Others
By Application
- Chemical and Fertilizer Manufacturing
- Water Treatment
- Energy Storage
- Petroleum Refining
- Others
By Region
- North America: U.S., Canada, Mexico
- Europe: UK, France, Germany, Italy, Spain, Russia, Rest of Europe
- Asia Pacific: China, Japan, South Korea, India, Australia, Southeast Asia, Rest of Asia Pacific
- Latin America: Brazil, Argentina, Rest of Latin America
- Middle East: GCC Countries, Israel, Turkey, Rest of Middle East
- Africa: South Africa, Egypt, Rest of Africa
Regional Analysis:
North America
The North America Global Solid and Liquid Sulfur Market size was valued at USD 1,233.01 million in 2018 to USD 1,727.35 million in 2024 and is anticipated to reach USD 2,831.78 million by 2032, at a CAGR of 6.43% during the forecast period. North America accounts for nearly 23.4% of the global market share in 2024. The region benefits from advanced refining capacity across the U.S. and Canada, which supports steady sulfur recovery. Fertilizer demand from the Midwest and agrochemical manufacturers further boosts consumption. The U.S. leads in production due to strong refining integration and petrochemical output. Demand from mining and water treatment sectors also supports market stability. Cross-border sulfur trade with Latin America strengthens regional flow. Investments in sulfur-based battery technologies may open new application areas. The market remains well-balanced across form and end-user segments.
Europe
The Europe Global Solid and Liquid Sulfur Market size was valued at USD 1,380.81 million in 2018 to USD 1,931.49 million in 2024 and is anticipated to reach USD 3,159.87 million by 2032, at a CAGR of 6.40% during the forecast period. Europe holds about 26.6% of the global market share in 2024. The region’s market is driven by extensive fertilizer manufacturing and strong regulatory compliance in refining. Germany, France, and Russia contribute significantly through sulfur recovery in both petroleum and metallurgical processes. European fertilizer companies emphasize clean sulfur inputs, raising demand for high-purity grades. The region also consumes sulfur in water treatment, rubber, and pulp industries. Sustainability regulations encourage recovery from industrial by-products. Europe’s chemical sector remains a key end-user for liquid sulfur. Solid sulfur in granular form continues to dominate fertilizer distribution networks.
Asia Pacific
The Asia Pacific Global Solid and Liquid Sulfur Market size was valued at USD 1,670.78 million in 2018 to USD 2,428.20 million in 2024 and is anticipated to reach USD 4,178.05 million by 2032, at a CAGR of 7.07% during the forecast period. Asia Pacific leads the global market with a 33.4% share in 2024. Fertilizer consumption in China and India drives large-scale sulfur demand. Both countries rely heavily on imported solid sulfur for phosphatic fertilizer production. Regional refining expansions across China, South Korea, and Singapore boost sulfur supply. Chemical manufacturing and mining sectors widen industrial usage. Southeast Asian nations show rising demand due to agricultural modernization. The market sees strong adoption of granular and powdered forms. Governments focus on yield improvements, pushing sulfuric acid applications. Energy storage markets in Japan and China may support future demand for high-purity sulfur.
Latin America
The Latin America Global Solid and Liquid Sulfur Market size was valued at USD 447.99 million in 2018 to USD 658.76 million in 2024 and is anticipated to reach USD 1,150.15 million by 2032, at a CAGR of 7.27% during the forecast period. Latin America holds around 9.1% of the global market share in 2024. The region sees growing sulfur usage in agriculture, particularly in Brazil and Argentina. Domestic production remains limited, increasing reliance on imports from North America and the Middle East. Fertilizer blending operations continue expanding, especially for phosphate-based products. Chemical industries in Brazil and Chile add to the demand. Sulfur use in mining operations is also rising, especially in copper and lithium refining. Transport infrastructure improvements help in storage and distribution. Demand is focused on solid sulfur due to ease of handling in rural areas. The region presents strong potential for long-term growth.
Middle East
The Middle East Global Solid and Liquid Sulfur Market size was valued at USD 244.45 million in 2018 to USD 350.63 million in 2024 and is anticipated to reach USD 593.23 million by 2032, at a CAGR of 6.85% during the forecast period. The Middle East contributes about 4.8% to the global market share in 2024. It serves primarily as a major sulfur exporter, with large volumes recovered from gas and crude refining. Saudi Arabia, Qatar, and the UAE dominate production due to integrated petrochemical operations. Local fertilizer demand remains moderate but steady. High-purity molten sulfur is exported to Asia and North Africa. Investments in storage terminals and dedicated export ports support efficient logistics. Liquid sulfur dominates due to refining proximity and ease of transfer. Regional consumption is expected to rise with downstream industrial development. Cross-border trade strengthens the region's role in global supply chains.
Africa
The Africa Global Solid and Liquid Sulfur Market size was valued at USD 137.06 million in 2018 to USD 160.91 million in 2024 and is anticipated to reach USD 193.71 million by 2032, at a CAGR of 2.32% during the forecast period. Africa represents just 2.2% of the global market share in 2024. The market remains in early development, with limited domestic sulfur production. Demand arises mainly from agriculture, supported by regional fertilizer subsidy programs. Key importers include Nigeria, Egypt, and South Africa. Solid sulfur, especially in granular form, is preferred for agricultural blending. Infrastructure gaps in storage and transport limit growth pace. Mining and water treatment sectors show gradual sulfur uptake. Long-term prospects depend on refining expansion and improved logistics. The market remains import-dependent, with future gains tied to economic and industrial development.
Key Player Analysis:
- Pemex
- Valero Energy
- Saudi Aramco Americas
- ExxonMobil Chemical
- Chevron Phillips Chemical
- Shell plc
- TotalEnergies
- Suncor Energy Inc.
- ADNOC
- Gazprom
- Other Key Players
Competitive Analysis:
The Global Solid and Liquid Sulfur Market features a competitive landscape shaped by vertically integrated energy and chemical companies. Key players include Pemex, Saudi Aramco, ExxonMobil, Chevron Phillips Chemical, and Shell plc. These companies operate large refining assets, ensuring consistent sulfur recovery and supply. Market leadership depends on refining capacity, geographic reach, and logistics infrastructure. Producers in the Middle East and North America dominate exports, while Asia Pacific and Latin America lead in imports. Strategic moves such as capacity expansion, supply agreements, and technology upgrades define the competition. Players invest in sulfur granulation and liquid handling facilities to meet end-user preferences. New entrants face barriers due to capital intensity and regulatory compliance. The Global Solid and Liquid Sulfur Market continues to consolidate around a few high-volume suppliers. Competitive advantage relies on cost efficiency, product purity, and delivery reliability. It remains sensitive to global energy cycles and fertilizer industry dynamics.
Recent Developments:
- In January 2026, ADNOC significantly increased its official selling price for sulfur to $520 per metric ton FOB Ruwais. This pricing update reflects a tightening global supply-demand balance as the market enters 2026, driven by rising demand from the new energy sector and traditional fertilizer production.
- In November 2025, Saudi Aramco signed 17 Memorandums of Understanding (MoUs) with U.S. companies, potentially exceeding $30 billion in value, covering LNG development, advanced materials, and technical services that support sulfur-related downstream operations.
- In November 2024, QatarEnergy entered into a landmark 10-year sulfur supply agreement with OCP Nutricrops. This strategic partnership secures a long-term offtake relationship to support OCP Nutricrops' expansion in soil nutrition and phosphate-based fertilizer markets by ensuring a reliable sulfur supply through 2034.
Report Coverage:
The research report offers an in-depth analysis based on Form, Production Source, End User, and Application. It details leading market players, providing an overview of their business, product offerings, investments, revenue streams, and key applications. Additionally, the report includes insights into the competitive environment, SWOT analysis, current market trends, as well as the primary drivers and constraints. Furthermore, it discusses various factors that have driven market expansion in recent years. The report also explores market dynamics, regulatory scenarios, and technological advancements that are shaping the industry. It assesses the impact of external factors and global economic changes on market growth. Lastly, it provides strategic recommendations for new entrants and established companies to navigate the complexities of the market.
Future Outlook:
- Rising demand for sulfur-based fertilizers will drive consistent consumption across agriculture-dependent economies.
- Upgrading of refining infrastructure will increase sulfur recovery efficiency, supporting stable industrial supply.
- Trade flows are expected to grow between the Middle East and Asia due to strong import needs in developing countries.
- Investment in sulfur granulation and handling facilities will improve product quality and distribution control.
- Chemical and agrochemical manufacturers will remain the dominant end users, expanding sulfur application breadth.
- Growth in sulfur-based battery technology may open new high-purity sulfur demand in energy storage systems.
- Environmental regulations will promote recovery from secondary sources, improving sustainability performance.
- Demand from water treatment and mining industries will support non-agricultural market diversification.
- Integrated supply chain strategies will become key to reducing logistics costs and improving trade margins.
- Emerging markets in Southeast Asia and Latin America will gain share due to rising fertilizer consumption and import reliance.
Request a Free Sample
Fill in your details and we'll send you a free sample report.
- Sample data tables & charts
- Research methodology
Need a Custom Version of This Report?
Tailor the scope, geography, or segments to your exact requirements.
- Custom geography or segment scope
- Direct access to our analyst team
Frequently Asked Questions
What is the current market size for Global Solid and Liquid Sulfur Market, and what is its projected size in 2032?
At what Compound Annual Growth Rate is the Global Solid and Liquid Sulfur Market projected to grow between 2024 and 2032?
Which Global Solid and Liquid Sulfur Market segment held the largest share in 2024?
What are the primary factors fueling the growth of the Global Solid and Liquid Sulfur Market?
Who are the leading companies in the Global Solid and Liquid Sulfur Market?
Which region commanded the largest share of the Global Solid and Liquid Sulfur Market in 2024?
Table of Content
Chapter 1. Report Introduction
- 1.1 Report Description & Purpose
- 1.1.1 Report Title & Market Definition
- 1.1.2 Unique Selling Propositions (USP) & Key Differentiators
- 1.1.3 Value Proposition for Stakeholders
- 1.2 Research Objectives
- 1.2.1 Market Sizing Objectives (Volume & Revenue)
- 1.2.2 Segmentation Objectives
- 1.2.3 Competitive Intelligence Objectives
- 1.2.4 Forecast & Scenario Objectives
- 1.3 Report Scope
- 1.3.1 Solid and Liquid Sulfur Scope – Types & Subtypes Covered
- 1.3.2 Geographic Scope – Regions & Countries Covered
- 1.3.3 Historical Period, Base Year & Forecast Period (2024; forecast to 2032)
- 1.3.4 Inclusions & Exclusions
- 1.4 HS Code & Classification Framework
- 1.5 Currency, Units & Pricing Basis
- 1.6 Target Stakeholders
- 1.7 Limitations & Assumptions
Chapter 2. Executive Summary
- 2.1 Global Solid and Liquid Sulfur Market Snapshot
- 2.1.1 Market Size – Historical (2024) & Forecast (2024-2032) (2024: USD 7,257.3 million → 2032: USD 12,106.8 million)
- 2.1.2 Volume & Revenue – Global Totals
- 2.1.3 Key Market Highlights – Top Five Facts
- 2.2 Solid and Liquid Sulfur Market Segmentation Snapshot
- 2.2.1 Market Split by Region – 2024 vs. 2032
- 2.3 Competitive Snapshot
- 2.3.1 Top 10 Players by Revenue Share – 2024
- 2.3.2 Top 10 Players by Volume Share – 2024
- 2.3.3 Recent Strategic Developments (18-Month Summary)
- 2.4 Key Investment Highlights & Strategic Conclusions
Chapter 3. Solid and Liquid Sulfur Market Dynamics & Industry Analysis
- 3.1 Market Overview & Context
- 3.1.1 Solid and Liquid Sulfur Market Position in the Broader Automotive Value Chain
- 3.1.2 OEM vs. Replacement Market Dynamics
- 3.1.3 Market Maturity & Development Stage by Region
- 3.2 Solid and Liquid Sulfur Market Drivers
- 3.3 Solid and Liquid Sulfur Market Restraints & Challenges
- 3.4 Solid and Liquid Sulfur Market Opportunities
- 3.5 Porter's Five Forces Analysis
- 3.5.1 Threat of New Entrants
- 3.5.2 Bargaining Power of Suppliers
- 3.5.3 Bargaining Power of Buyers
- 3.5.4 Threat of Substitutes
- 3.5.5 Competitive Rivalry – Intensity Assessment
- 3.6 Solid and Liquid Sulfur Value Chain Analysis
- 3.6.1 Upstream – Raw Material/Input Suppliers
- 3.6.1.1 Raw Material/Input 1
- 3.6.1.2 Raw Material/Input 2
- 3.6.1.3 Raw Material/Input 3
- 3.6.2 Midstream – Production/Manufacturing/Service Delivery
- 3.6.2.1 Production/Process Overview
- 3.6.2.2 Key Facility Locations & Capacity by Manufacturer
- 3.6.3 Downstream – Distribution & End Consumer
- 3.6.3.1 Primary Channel – B2B/OEM
- 3.6.3.2 Secondary Channels – Dealer, Retail, Online, Direct
- 3.6.4 Value Chain Profitability Analysis
- 3.6.1 Upstream – Raw Material/Input Suppliers
- 3.7 PESTEL Analysis
- 3.7.1 Political Factors
- 3.7.2 Economic Factors
- 3.7.3 Social Factors
- 3.7.4 Technological Factors
- 3.7.5 Environmental Factors
- 3.7.6 Legal Factors
- 3.8 Solid and Liquid Sulfur Supply Chain Analysis
- 3.8.1 Raw Material/Input Supply Risk Assessment
- 3.8.2 Manufacturing Concentration Risk (Geographic Exposure)
- 3.8.3 Trade Disruption Impact Analysis
- 3.9 Regulatory & Policy Landscape
Note: The regulatory and policy landscape section covers regulations based on their applicability to the market, Solid and Liquid Sulfur category, geography, and scope of the study. Only regulatory frameworks with a material impact on operations, compliance, trade, sustainability, or market access are analyzed in detail.
Chapter 4. Key Investment Pockets & Opportunity Analysis
- 4.1 Solid and Liquid Sulfur Market Attractiveness Analysis
- 4.1.1 By Region – Investment Attractiveness Matrix (Volume × CAGR)
- 4.2 Absolute Revenue Growth Opportunity
- 4.2.1 By Region – Absolute USD Growth Through 2032
- 4.3 Incremental Volume Opportunity
- 4.3.1 By Region – Incremental Volume Through 2032
- 4.3.2 Segment – Incremental Volume
- 4.4 Emerging Submarket Opportunity Deep Dive (Subject to Applicability)
- 4.5 Emerging Market Opportunity Scorecards
- 4.5.1 United States
- 4.5.2 Europe
- 4.5.3 Asia
- 4.5.4 Middle East & Africa
Note: Emerging Market Opportunity Scorecards will be included based on relevance and strategic importance. Regions listed are indicative and may vary depending on data availability and market dynamics.
Chapter 5. Solid and Liquid Sulfur Import-Export Analysis & Trade Flows
- 5.1 Global Trade Overview
- 5.1.1 Global Export Value by Country (2024)
- 5.1.2 Global Export Volume by Country (2024)
- 5.1.3 Global Import Value by Country (2024)
- 5.1.4 Global Import Volume by Country (2024)
- 5.1.5 Net Trade Balance by Country (2024)
- 5.2 Export Analysis – Segment
- 5.2.1 Type 1 (HS Code)
- 5.2.2 Type 2 (HS Code)
- 5.2.3 Type 3 (HS Code)
- 5.2.4 Type 4 (HS Code)
- 5.2.5 Type 5 (HS Code)
- 5.3 Import Analysis – Segment
- 5.3.1 Type 1 (HS Code)
- 5.3.2 Type 2 (HS Code)
- 5.3.3 Type 3 (HS Code)
- 5.3.4 Type 4 (HS Code)
- 5.3.5 Type 5 (HS Code)
- 5.4 Average Unit Trade Prices
- 5.4.1 Average Export Price – Segment & Country
- 5.4.2 Average Import Price – Segment & Source Country
- 5.4.3 Price Trends (2024)
- 5.5 Key Trade Route Analysis
- 5.5.1 Trade Route 1
- 5.5.2 Trade Route 2
- 5.5.3 Trade Route 3
- 5.5.4 Trade Route 4
- 5.5.5 Trade Route 5
- 5.6 Trade Policy Impact Assessment
- 5.6.1 US Anti-Dumping & Section 301 Tariffs
- 5.6.2 EU Customs Union Impact
- 5.6.3 Major Free Trade Agreements
- 5.6.4 USMCA Rules of Origin
Note: Trade policy analysis will be included only where relevant to the Solid and Liquid Sulfur market.
Chapter 6. Competitive Landscape & Company Benchmarking
- 6.1 Solid and Liquid Sulfur Market Concentration & Structure
- 6.1.1 Herfindahl-Hirschman Index (HHI) – vs. 2024
- 6.1.2 Tier 1, Tier 2 & Tier 3 Market Structure
- 6.1.3 Global, Regional & Local Player Dynamics
- 6.2 Solid and Liquid Sulfur Market Share Analysis – 2024
- 6.2.1 Global Revenue Share by Company
- 6.2.2 Global Volume Share by Company
- 6.2.3 Regional Revenue Share
- 6.2.4 Market Share Evolution ( vs. 2024)
- 6.2.5 OEM Segment Share by Company
- 6.2.6 Replacement Segment Share by Company
- 6.3 Production/Delivery Capacity & Facility Analysis
- 6.3.1 Global Installed Capacity
- 6.3.2 Capacity Utilization Rates
- 6.3.3 Production/Output Volume
- 6.3.4 Facility Locations & Capacity Map
- 6.3.5 Planned Capacity Additions
- 6.4 Solid and Liquid Sulfur Competitive Benchmarking Matrix
- 6.4.1 Revenue, Volume, CAGR & Profitability Comparison
- 6.4.2 Channel Revenue Mix
- 6.4.3 Geographic Revenue Exposure
- 6.4.4 R&D Intensity
- 6.4.5 Sustainability Maturity
- 6.5 Strategic Developments in Solid and Liquid Sulfur (Last 24 Months)
- 6.5.1 Mergers, Acquisitions & Divestments
- 6.5.2 New Solid and Liquid Sulfur Launches
- 6.5.3 Facility Expansions
- 6.5.4 Strategic Alliances, Joint Ventures & Partnerships
- 6.5.5 Distribution Expansion & Market Entry
- 6.5.6 Sustainability & ESG Initiatives
- 6.6 Competitive Strategy Mapping
- 6.6.1 Leader, Challenger, Follower & Niche Classification
- 6.6.2 Pricing Strategy Comparison
- 6.6.3 Channel Strategy Matrix
Note: Strategic developments are included based on their materiality and the availability of reliable information.
Chapter 7. Global Solid and Liquid Sulfur Market – By Distribution Channel
- 7.1 Segment Overview
- 7.1.1 Volume & Revenue Split by Channel (2024 & 2032)
- 7.1.2 Channel Mix Evolution (2024-2032)
Chapter 8. Regional Market Analysis – Global Overview
- 8.1 Global Regional Overview
- 8.1.1 Regional Volume Share
- 8.1.2 Regional Revenue Share
- 8.1.3 Regional Volume by Region
- 8.1.4 Regional Revenue by Region
- 8.1.5 Regional Forecast Through 2032
- 8.2 Cross-Regional Segment Analysis
- 8.2.1 By Distribution Channel
- 8.2.2 By Brand/Price Tier
Chapter 9. North America Solid and Liquid Sulfur Market
- 9.1 United States
- 9.2 Canada
- 9.3 Mexico
Chapter 10. Europe Solid and Liquid Sulfur Market
- 10.1 Germany
- 10.2 France
- 10.3 Italy
- 10.4 United Kingdom
- 10.5 Spain
- 10.6 Poland
- 10.7 Russia
- 10.8 Netherlands
- 10.9 Belgium
- 10.10 Sweden
- 10.11 Denmark
- 10.12 Norway
- 10.13 Rest of Europe
Chapter 11. Asia Pacific Solid and Liquid Sulfur Market
- 11.1 China
- 11.2 India
- 11.3 Japan
- 11.4 South Korea
- 11.5 Thailand
- 11.6 Indonesia
- 11.7 Vietnam
- 11.8 Malaysia
- 11.9 Australia
- 11.10 Rest of Asia Pacific
Chapter 12. Latin America Solid and Liquid Sulfur Market
- 12.1 Brazil
- 12.2 Argentina
- 12.3 Colombia
- 12.4 Chile
- 12.5 Rest of Latin America
Chapter 13. Middle East Solid and Liquid Sulfur Market
- 13.1 Saudi Arabia
- 13.2 United Arab Emirates
- 13.3 Turkey
- 13.4 Israel
- 13.5 Iran
- 13.6 Rest of the Middle East
Chapter 14. Africa Solid and Liquid Sulfur Market
- 14.1 South Africa
- 14.2 Egypt
- 14.3 Nigeria
- 14.4 Morocco
- 14.5 Rest of Africa
Chapter 15. Solid and Liquid Sulfur Company Profiles
- 15.1 [Company 01]
- 15.1.1 Company Overview
- 15.1.2 Key Management Personnel
- 15.1.3 Products & Services Portfolio
- 15.1.4 Financial Performance
- 15.1.5 Key Market Focus & Geographic Presence
- 15.1.6 Recent Developments & Strategic Initiatives
Note: The company profile list is preliminary and may change based on research findings, market developments, data availability, and client requirements.
Chapter 16. Appendices
- Appendix A – List of Abbreviations & Acronyms
- Appendix B – Industry Classification Code Reference – Full Series
- Appendix C – Production & Capacity Data Tables
- Appendix D – End-Use & Demand Base Tables
- Appendix E – Consumption & Replacement Rate Assumptions
- Appendix F – ASP Reference Tables
- Appendix G – Manufacturing & Facility Database
- Appendix H – Import-Export Data Tables
- Appendix I – Regulatory Summary Tables
- Appendix J – Primary Research Participant List (Anonymized)
- Appendix K – Primary Research Questionnaire Framework
- Appendix L – Data Sources & Bibliography
- Appendix M – Market Size Divergence & Source Comparison
Chapter 17. Research Methodology
- 17.1 Research Framework & Philosophy
- 17.2 Secondary Research – Sources, Hierarchy & Data Extraction
- 17.3 Data Modeling – Bottom-Up & Top-Down Market Sizing
- 17.4 Primary Research – Stakeholder Framework, LOI & Sample Sizes
- 17.5 Forecast Methodology – Regression, Scenario & Sensitivity Analysis
- 17.6 Quality Control – Four-Layer Validation Framework
- 17.7 Limitations & Standard Assumptions
- 17.8 Disclaimer
