Market Overview
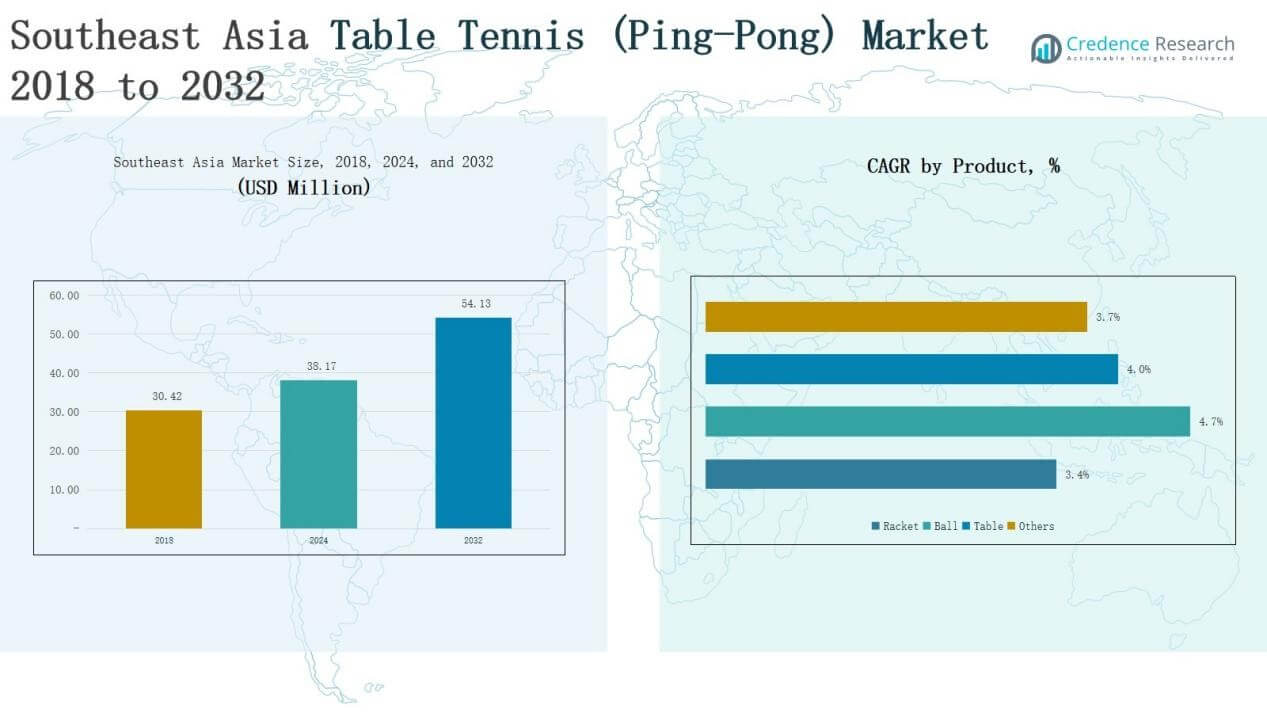
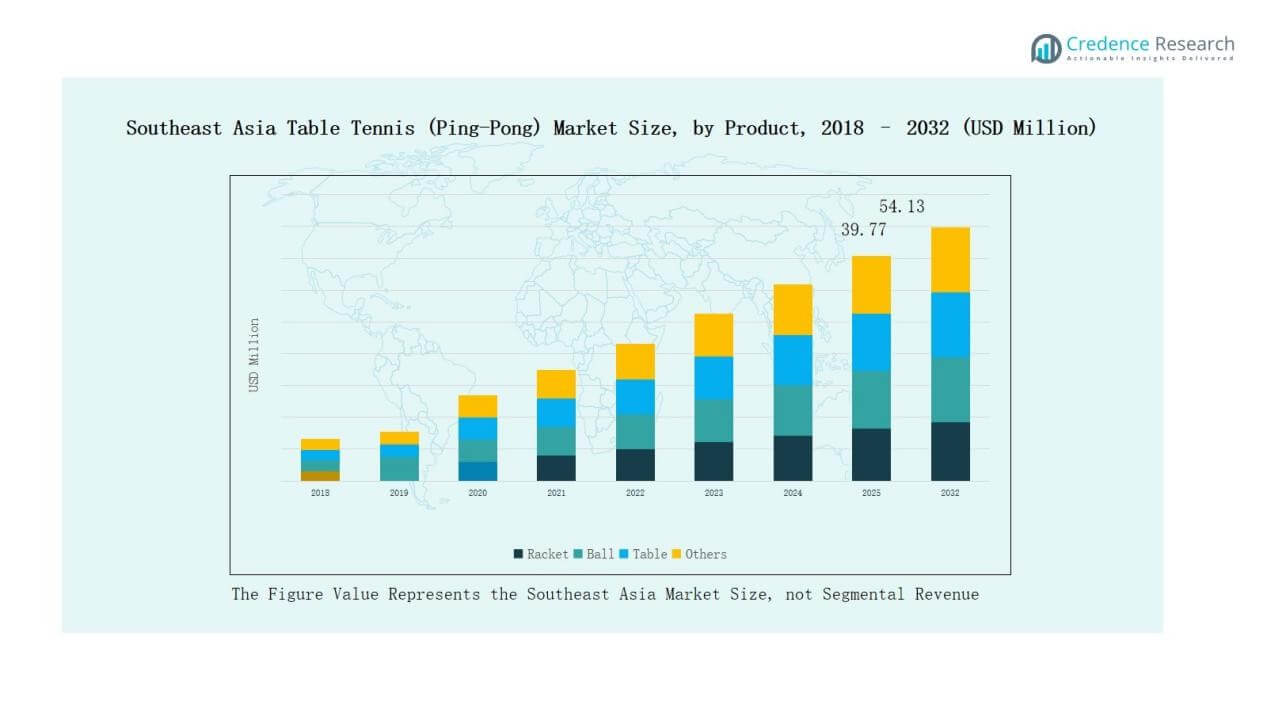
Southeast Asia Table Tennis (Ping-Pong) Market size was valued at USD 30.42 million in 2018 to USD 38.17 million in 2024 and is anticipated to reach USD 54.13 million by 2032, at a CAGR of 4.46% during the forecast period.
| REPORT ATTRIBUTE |
DETAILS |
| Historical Period |
2020-2023 |
| Base Year |
2024 |
| Forecast Period |
2025-2032 |
| Southeast Asia Table Tennis (Ping-Pong) Market Size 2024 |
USD 38.17 Million |
| Southeast Asia Table Tennis (Ping-Pong) Market, CAGR |
4.46% |
| Southeast Asia Table Tennis (Ping-Pong) Market Size 2032 |
USD 54.13 Million |
The Southeast Asia Table Tennis (Ping-Pong) Market is shaped by prominent players such as JOOLA, Butterfly, Nittaku, Double Happiness Co. Ltd., STIGA, DONIC, Nanjing Spark Shot Technology Co., Ltd., C&C, TELAMON, and Beijing Sanwei Sport Goods Co., Ltd. These companies strengthen their market presence through innovation in rackets, ITTF-approved balls, sponsorships, and expanding e-commerce distribution. They cater to both professional and recreational segments, balancing premium offerings with affordable options for price-sensitive consumers. Among regions, Indonesia led the market with 28% share in 2024, supported by strong recreational participation, school integration of table tennis, and rising youth engagement through clubs and tournaments.
Access crucial information at unmatched prices!
Request your sample report today & start making informed decisions powered by Credence Research Inc.!
Download Sample
Market Insights
- The Southeast Asia Table Tennis (Ping-Pong) Market grew from USD 30.42 million in 2018 to USD 38.17 million in 2024, projected at USD 54.13 million by 2032.
- Rackets led with 42% share in 2024, supported by material innovation, customization, and strong adoption by both professional and recreational players across the region.
- Recreational players dominated end user demand with 48% share in 2024, driven by affordability, indoor sports adoption, and government-backed fitness initiatives across Southeast Asian countries.
- Online stores captured 44% share in 2024, fueled by rapid e-commerce growth, competitive pricing, product variety, and increasing consumer preference for convenient shopping experiences.
- Indonesia led with 28% share in 2024, supported by strong recreational participation, school-level integration, expanding e-commerce platforms, and growing youth involvement in clubs and tournaments.
Market Segment Insights
By Product
Rackets held the dominant share of 42% in 2024, making them the leading product segment in Southeast Asia. Their strong demand is supported by continuous product innovation, lightweight carbon-based materials, and customization for professional and recreational use. Balls followed with a notable share, driven by the growing adoption of seamless and ITTF-approved variants for tournaments. Tables remain significant due to rising use in schools, sports clubs, and recreational centers, while others, including accessories, contribute to niche demand. The rising sports participation and presence of regional training facilities further enhance racket sales growth.
- For instance, Butterfly’s Timo Boll ALC racket uses Arylate-Carbon technology to improve control and stability, making it popular among competitive players.
By End User
Recreational players accounted for the largest share of 48% in 2024, reflecting the sport’s popularity as a leisure activity across Southeast Asia. Increasing affordability of entry-level products and rising urban adoption of indoor sports fuel this segment’s expansion. Professional players represent a steady share, driven by tournament participation and rising sponsorships. Educational institutions contribute significantly by integrating table tennis into school sports programs, while other segments cover clubs and community-level users. The recreational base continues to grow with government-backed fitness initiatives and rising disposable income.
- For instance, in 2023, Butterfly extended its sponsorship of the ITTF World Table Tennis Championships, further strengthening professional-level engagement.
By Distribution Channel
Online stores captured the dominant share of 44% in 2024, supported by the rapid expansion of e-commerce platforms and preference for home delivery. Consumers increasingly choose online platforms for product variety, competitive pricing, and easy availability of international brands. Specialty sports stores retained a strong position with a loyal base of professional and amateur players seeking expert guidance and quality assurance. Supermarkets and hypermarkets contribute to sales of affordable products targeting casual users, while others, including local retail shops, serve niche demand. The convenience of digital shopping and promotional discounts continues to drive online sales leadership.
Market Overview
Key Growth Drivers
Rising Popularity of Recreational Sports
The growing emphasis on health, fitness, and indoor recreational activities drives demand for table tennis across Southeast Asia. Recreational players, who accounted for the largest market share, continue to expand as urban populations seek affordable and engaging sports. The accessibility of entry-level rackets and tables, combined with limited space requirements, supports adoption in households, clubs, and community centers. Governments and private organizations further promote the sport through awareness campaigns, contributing to sustained recreational demand and strengthening the regional market’s foundation.
- For instance, Singapore’s structured development programs nurture young talent and regularly host international tournaments, boosting local engagement and competition levels.
Government and Institutional Support
Government initiatives to promote sports participation in schools and universities significantly contribute to the market’s growth. Educational institutions incorporate table tennis into physical education programs due to its affordability, health benefits, and suitability for limited playing areas. Investments in school-level infrastructure and training facilities foster early engagement among students, driving long-term adoption. National-level sports bodies also support talent development by hosting tournaments and coaching camps, which elevate visibility and inspire wider participation. These institutional efforts create a steady and expanding customer base for table tennis products.
- For instance, USA Table Tennis (USATT) provides resources to schools to help them start table tennis programs. The NCTTA, a USATT affiliate, partners with hundreds of colleges and universities across the U.S. and Canada.
Product Innovation and Brand Expansion
Continuous innovation in racket materials, such as carbon fiber composites, and the availability of ITTF-approved balls boost the sport’s appeal to both professionals and enthusiasts. Leading brands expand their portfolios with customizable rackets, portable tables, and accessories tailored to regional preferences. E-commerce platforms accelerate market penetration by offering wider brand visibility and distribution. Sponsorship deals, endorsements by professional athletes, and strategic partnerships further strengthen market positioning. Product differentiation and enhanced consumer experience drive loyalty, ensuring table tennis products remain competitive in the dynamic Southeast Asian sports equipment market.
Key Trends & Opportunities
Digital Platforms and E-Commerce Growth
The rapid expansion of digital retail platforms is reshaping sales channels for table tennis products. Online stores dominate the distribution landscape, providing access to both international and regional brands. Rising smartphone penetration, secure payment systems, and promotional campaigns encourage consumers to purchase equipment online. This trend offers opportunities for companies to directly engage with recreational and professional players, offering personalized bundles, discounts, and loyalty programs. The convenience of online shopping is expected to sustain e-commerce as the leading channel, creating room for further expansion.
- For instance, Butterfly, a globally recognized brand, supports major table tennis tournaments and offers a wide range of professional rackets, tables, and accessories through its online store, directly engaging players worldwide.
Rising Professionalization and Tournament Sponsorships
The market benefits from the growing professionalization of sports across Southeast Asia, with table tennis gaining visibility through regional and international tournaments. Sponsorships by brands and government-backed associations provide momentum for competitive events. Professional leagues, coaching academies, and cross-border competitions enhance product demand, particularly for high-quality rackets and balls. This trend not only supports brand recognition but also inspires young players to pursue the sport competitively. Increased investment in professional-level infrastructure represents a long-term opportunity for sustained growth across both professional and recreational segments.
- For instance, the International Table Tennis Federation (ITTF) partnered with Seamaster in 2017 to sponsor the ITTF World Tour, which included stops in Singapore and the Philippines, boosting regional exposure.
Key Challenges
High Competition from Alternative Sports
Table tennis faces stiff competition from other popular sports such as badminton, basketball, and football, which dominate Southeast Asia’s recreational and professional landscape. These sports benefit from larger fan bases, wider sponsorships, and greater media coverage, often limiting the visibility of table tennis. Younger audiences, influenced by team sports culture, may prioritize alternatives, reducing potential market expansion. Overcoming this challenge requires greater promotional campaigns, grassroots initiatives, and investments in branding to position table tennis as a complementary and accessible indoor sport.
Price Sensitivity and Limited Affordability
The market is highly price-sensitive, particularly in developing Southeast Asian countries where disposable incomes remain constrained. Consumers often opt for low-cost or unbranded equipment, which limits revenue potential for premium international brands. Affordability concerns also restrict adoption in schools or institutions with limited budgets for sports infrastructure. While e-commerce platforms offer some relief through discounts and bundles, long-term profitability depends on balancing affordability with quality. Manufacturers must adopt region-specific pricing strategies to capture wider demand without compromising on product standards.
Lack of Standardized Infrastructure
A significant challenge lies in the limited availability of standardized playing facilities across Southeast Asia. Many recreational centers, schools, and clubs lack proper tables, flooring, and professional-grade equipment required for consistent gameplay. This infrastructure gap hampers player development and discourages broader participation, especially at competitive levels. Investments in quality infrastructure remain low compared to other mainstream sports, slowing the sport’s growth potential. Addressing this issue requires collaboration between governments, associations, and private stakeholders to develop accessible, standardized venues that support both training and recreational use.
Regional Analysis
Indonesia
Indonesia accounted for 28% share in 2024, making it the largest market in Southeast Asia. The country benefits from a strong recreational base supported by community clubs and growing youth participation. Table tennis is widely integrated into schools and local sports programs, boosting demand for rackets and balls. Rising e-commerce platforms expand access to international brands and affordable domestic products. It continues to grow as professional players gain visibility through regional tournaments. The market shows steady expansion supported by government-led fitness initiatives and rising urban sports adoption.
Malaysia
Malaysia held a 20% share in 2024, supported by steady adoption of table tennis in schools and recreational centers. The market benefits from strong government involvement in promoting sports activities among youth. Online platforms dominate sales channels, offering both premium and mid-range equipment to consumers. Professional players create visibility through local tournaments and brand sponsorships. It is further supported by strong urban demand and increasing awareness of indoor sports. The market maintains balanced growth across professional, educational, and recreational user groups.
Philippines
The Philippines contributed 18% share in 2024, reflecting the sport’s popularity as a recreational activity across urban and rural areas. Table tennis is promoted through school programs and community-based initiatives, creating a strong foundation for adoption. E-commerce growth accelerates equipment sales, with rackets and balls leading demand. Professional leagues remain small, yet they enhance visibility for international brands. It shows strong growth potential with rising health awareness and support for affordable indoor sports. The country continues to balance recreational demand with emerging professional participation.
Singapore
Singapore represented 15% share in 2024, supported by advanced infrastructure and high disposable incomes. The country’s emphasis on fitness and wellness contributes to strong adoption in schools, clubs, and residential areas. Professional coaching centers and tournaments further elevate the profile of table tennis. It benefits from the availability of high-quality international brands through specialty sports stores and online channels. The market demonstrates resilience, with recreational and professional players driving sustained equipment demand. Government support for sports culture ensures long-term stability in growth.
Rest of Southeast Asia
The Rest of Southeast Asia accounted for 19% share in 2024, covering emerging markets such as Vietnam, Thailand, and Myanmar. These countries experience rising demand supported by grassroots initiatives and growing urban adoption. E-commerce penetration improves accessibility to affordable and mid-range products, strengthening the recreational base. It faces infrastructure limitations, yet schools and clubs are gradually integrating table tennis into physical activities. Regional tournaments promote awareness and encourage interest among young players. The market holds strong future potential as disposable incomes and sports participation rise.
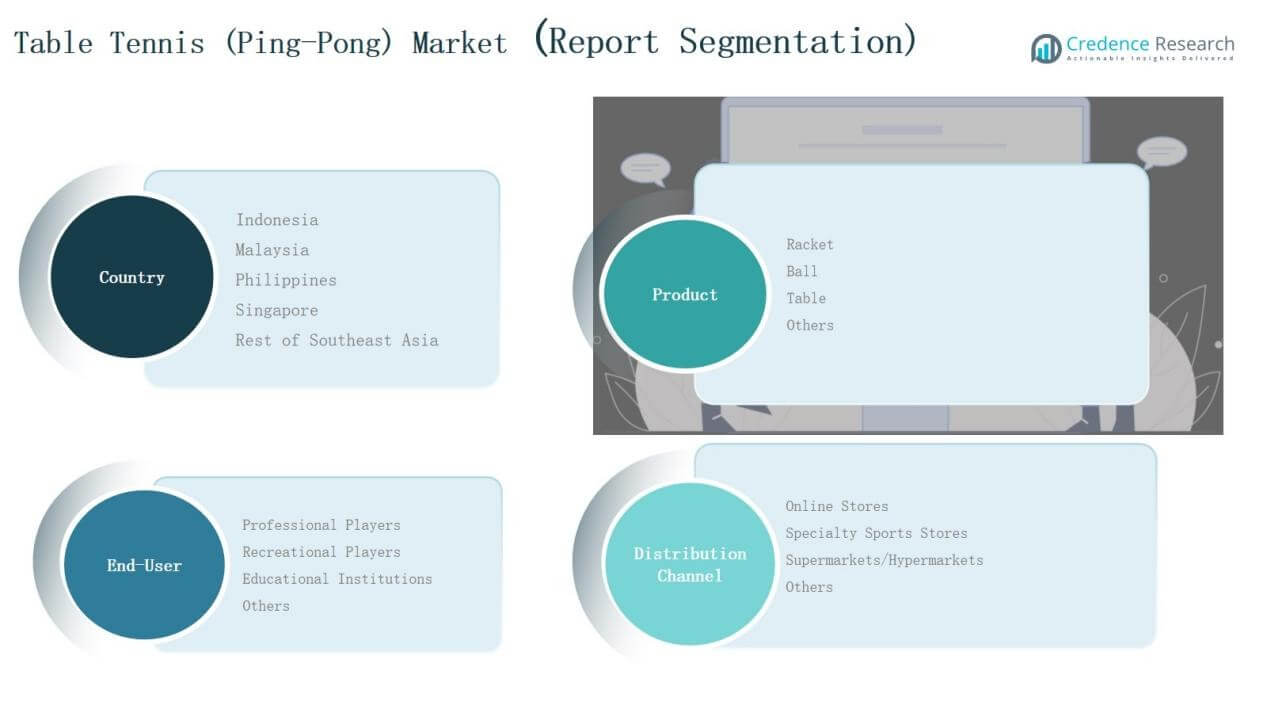
Market Segmentations:
By Product
- Rackets
- Balls
- Tables
- Others
By End User
- Professional Players
- Recreational Players
- Educational Institutions
- Others
By Distribution Channel
- Online Stores
- Specialty Sports Stores
- Supermarkets/Hypermarkets
- Others
By Region
- Indonesia
- Malaysia
- Philippines
- Singapore
- Rest of Southeast Asia
Competitive Landscape
The Southeast Asia Table Tennis (Ping-Pong) Market is moderately fragmented, with both global and regional players competing for market share. Leading companies such as JOOLA, Butterfly, Nittaku, Double Happiness Co. Ltd., STIGA, and DONIC maintain strong visibility through extensive product portfolios, international certifications, and tournament sponsorships. These brands dominate the professional segment with premium rackets, balls, and ITTF-approved equipment. Regional players and local manufacturers compete in the recreational and entry-level segments by offering affordable products tailored to price-sensitive consumers. The rapid growth of e-commerce has provided opportunities for both global and local brands to expand reach and capture diverse customer bases across Indonesia, Malaysia, the Philippines, and Singapore. Strategic partnerships with sports associations, coaching academies, and retailers further strengthen positioning. Companies increasingly invest in product innovation, customization, and distribution efficiency to differentiate in a market where recreational players account for the largest demand share.
Shape Your Report to Specific Countries or Regions & Enjoy 30% Off!
Key Players
- JOOLA
- Butterfly
- Nanjing Spark Shot Technology Co., Ltd.
- Nittaku
- Double Happiness Co. Ltd.
- DONIC
- STIGA
- C&C
- TELAMON
- Beijing Sanwei Sport Goods Co., Ltd.
- Others
Recent Developments
- In June 2025, World Table Tennis (WTT) launched WTT Event Management Pvt. Ltd. in India to strengthen event frequency, ranking opportunities, and the broader table tennis ecosystem across South Asia.
- On April 26, 2025, the International Table Tennis Federation (ITTF) renewed its partnership with Double Happiness Shanghai (DHS). DHS is now the Official Table Partner for the ITTF World Championships Finals from 2025 through 2028.
- In June 2025, Butterfly presented a crafting kit for miniature rackets, made from surplus materials, as eco‑friendly gifts at the ITTF/WTT Summit. The items symbolized environmental commitment and featured designs tied to the Qatar Championships.
- In June 2025, JOOLA became the official equipment partner for PPA Tour Asia. Their premium balls, nets, and flooring are featured at every event. The Panas Malaysia Open (July 3–6, 2025) marked the debut of JOOLA’s new HC-40 ball for hard-court play.
Report Coverage
The research report offers an in-depth analysis based on Product, End User, Distribution Channel and Region. It details leading market players, providing an overview of their business, product offerings, investments, revenue streams, and key applications. Additionally, the report includes insights into the competitive environment, SWOT analysis, current market trends, as well as the primary drivers and constraints. Furthermore, it discusses various factors that have driven market expansion in recent years. The report also explores market dynamics, regulatory scenarios, and technological advancements that are shaping the industry. It assesses the impact of external factors and global economic changes on market growth. Lastly, it provides strategic recommendations for new entrants and established companies to navigate the complexities of the market.
Future Outlook
- Recreational players will continue to drive the largest share of product demand.
- Online platforms will strengthen their role as the leading distribution channel.
- Professional tournaments will expand visibility and stimulate demand for premium products.
- Schools and universities will remain important contributors through structured sports programs.
- Product innovation in lightweight rackets and seamless balls will support brand differentiation.
- Sponsorships and endorsements will boost consumer engagement and market growth.
- Local manufacturers will target affordability to capture price-sensitive consumer groups.
- Specialty sports stores will retain importance for professional and serious amateur players.
- Investments in training infrastructure will encourage higher participation and skill development.
- Rising health awareness will sustain table tennis as a preferred indoor recreational sport.


