
Market Overview
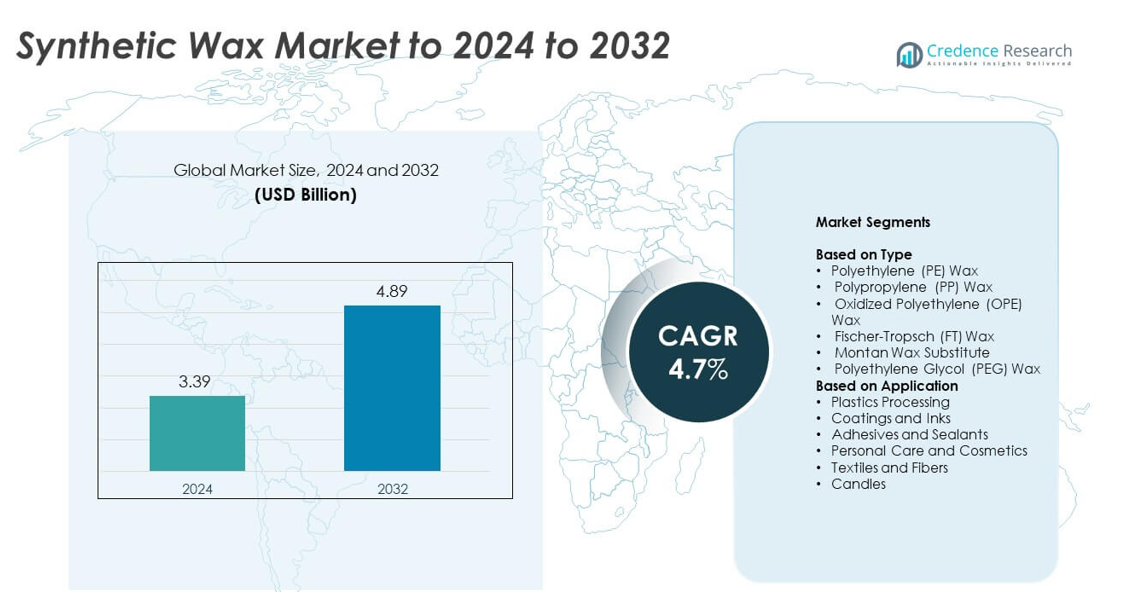
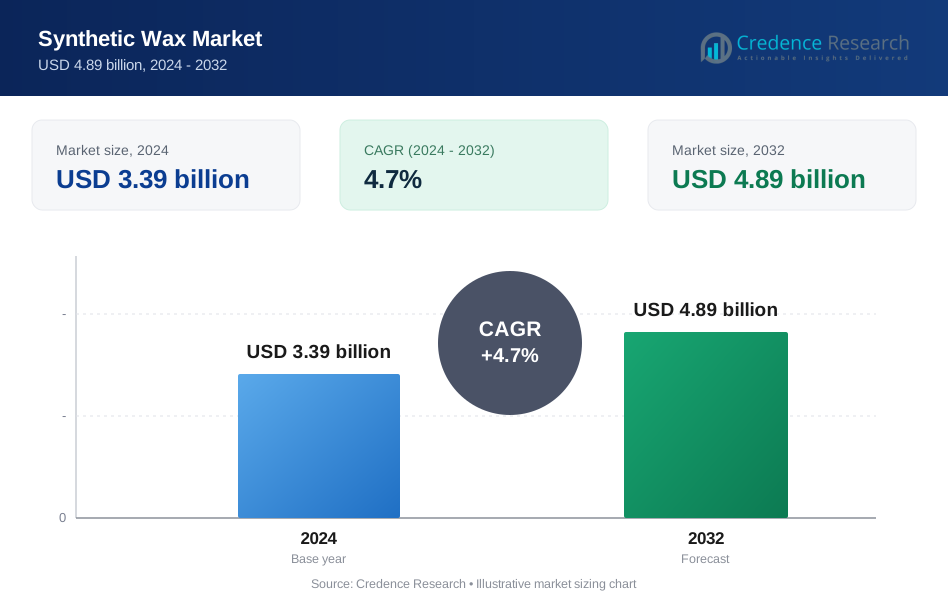
Synthetic Wax Market size was valued at USD 3.39 billion in 2024 and is anticipated to reach USD 4.89 billion by 2032, at a CAGR of 4.7% during the forecast period.
| REPORT ATTRIBUTE | DETAILS |
|---|---|
| Historical Period | 2020-2023 |
| Base Year | 2024 |
| Forecast Period | 2025-2032 |
| Synthetic Wax Market Size 2024 | USD 3.39 billion |
| Synthetic Wax Market, CAGR | 4.7% |
| Synthetic Wax Market Size 2032 | USD 4.89 billion |
The Synthetic Wax Market is driven by major players including Honeywell International Inc, Mitsui Chemicals Inc, BASF SE, Evonik Industries AG, Westlake Chemical Corporation, The Lubrizol Corporation, Sasol, Dow, The International Group Inc, and Clariant AG. These companies compete by offering high-purity polyethylene, polypropylene, and Fischer-Tropsch wax grades that support plastics, coatings, inks, adhesives, and personal care applications. Asia Pacific led the market in 2024 with about 31% share due to strong industrial output and rising plastics consumption, followed by North America with nearly 33% share driven by mature manufacturing demand, while Europe accounted for roughly 28% share supported by advanced coatings and packaging industries.
Market Insights
- The Synthetic Wax Market was valued at USD 3.39 billion in 2024 and is projected to reach USD 4.89 billion by 2032, growing at a CAGR of 4.7%.
- Growth is driven by strong use in plastics processing, where the segment held about 41% share in 2024 due to rising demand for improved melt flow, lubrication, and dispersion performance.
- Trends include expanding adoption in coatings and inks as industries shift toward low-emission, high-purity wax grades that enhance gloss, surface quality, and stability in industrial formulations.
- Competition intensifies as leading players focus on high-performance Fischer-Tropsch and polyethylene wax grades, product customization, and expansion of production capacity to improve supply reliability.
- Regionally, North America held around 33% share in 2024, Europe accounted for nearly 28%, and Asia Pacific led with about 31%, supported by strong plastics output and rapid growth in packaging, adhesives, and personal care applications.
Market Segmentation Analysis:
By Type
Polyethylene (PE) wax dominated the type segment in 2024 with about 34% share of the Synthetic Wax Market. Demand stayed strong because PE wax offers high hardness, thermal stability, and excellent lubrication, which supports large use in plastics, coatings, and masterbatches. Industries preferred this wax due to consistent performance in high-volume extrusion and injection molding. Fischer-Tropsch wax also expanded as manufacturers sought cleaner and high-purity wax grades for packaging, inks, and rubber processing.
- For instance, Sasol’s Fischer-Tropsch Wax Expansion Project in Sasolburg was expected to add about 116,000 tons of hard wax production in 2018 after Phase 2 reached beneficial operation in 2018.
By Application
Plastics processing led the application segment in 2024 with nearly 41% share of the Synthetic Wax Market. Growth came from steady consumption in PVC pipes, masterbatches, and engineering plastics, where synthetic wax improves flow, reduces friction, and enhances surface quality. Producers favored these waxes due to their controlled melt properties and superior dispersion. Coatings and inks also advanced as demand grew for gloss improvement, anti-blocking features, and smooth film formation across industrial and consumer applications.
- For instance, LyondellBasell’s Knapsack site in Germany became the world’s largest polypropylene compounding facility in 2019, with total annual capacity above 200,000 metric tons after a new line adding 25,000 metric tons per year.
Key Growth Drivers
Rising Demand in Plastics and Masterbatches
Growth accelerated as plastics and masterbatch producers used synthetic wax to improve melt flow, boost dispersion, and enhance surface finish. The material supported higher output in extrusion and injection molding, which helped meet rising consumption in packaging, automotive parts, and construction products. Manufacturers preferred synthetic wax because the product delivers stable performance at various processing temperatures. Expanding PVC pipe production and demand for lightweight materials strengthened this driver across major economies.
- For instance, ExxonMobil’s performance polyethylene plant at Mont Belvieu in Texas reached more than 2.5 million tons of annual polyethylene capacity in 2017, supplying high-performance packaging and film grades worldwide.
Expansion of Coatings, Inks, and Adhesives
The coatings and inks sector increased its use of synthetic wax due to strong need for scratch resistance, anti-blocking behavior, and gloss control. Demand grew in industrial wood coatings, printing inks, and metal packaging as producers shifted toward high-performance formulations. Adhesive makers also adopted synthetic wax to improve bond strength and reduce viscosity variations in hot-melt systems. Rising investments in construction, furniture, and flexible packaging reinforced this driver in both developed and emerging regions.
- For instance, PPG’s expansion of its Weingarten automotive coatings site in Germany added a 10,000-square-foot building designed to produce over 5,000 metric tons of waterborne basecoats per year for OEM customers.
Shift Toward High-Purity and Customizable Wax Grades
Producers invested in advanced Fischer-Tropsch and polyethylene-based grades to supply industries needing consistent purity, narrow molecular weights, and better thermal stability. Buyers in personal care, rubber processing, and technical textiles chose customized wax to meet specific performance needs. This focus increased adoption in high-value applications and supported long-term contracts with large manufacturers. The shift toward cleaner and low-emission additives encouraged further use of synthetic wax across regulated markets.
Key Trends and Opportunities
Growth of Sustainable and Low-Emission Formulations
A major trend emerged as companies moved toward low-VOC, low-odor, and eco-friendly wax solutions. Demand increased in coatings, inks, and personal care applications where buyers preferred safer and cleaner ingredients. Synthetic wax offered predictable performance while supporting sustainable product lines. Investments in bio-based synthetic wax and advanced catalytic processes opened new opportunities for suppliers targeting premium and regulatory-sensitive markets.
- For instance, BASF reported purchasing around 1 million metric tons of renewable raw materials in 2023 to use in detergents, cleaners, and cosmetic ingredients as substitutes for fossil feedstocks.
Rising Use in High-Performance Industrial Applications
Industries adopted synthetic wax to improve durability, friction control, and heat resistance in products such as automotive parts, wires, cables, and technical films. Opportunities expanded because end users sought consistent properties that natural waxes could not provide. Synthetic wax enabled better surface finish, improved lubrication, and stable processing in challenging manufacturing environments. Growth accelerated in sectors focusing on advanced materials and precision manufacturing.
- For instance, INERATEC’s power-to-liquids plant using Clariant catalysts is designed to produce up to 2,500 tons of synthetic fuels and waxes per year, making it one of the largest such operations.
Expansion in Personal Care and Cosmetic Formulations
Personal care brands used synthetic wax for thickening, structure building, and sensory enhancement in creams, balms, and color cosmetics. Demand rose as companies shifted toward stable, non-crystalline waxes that provide smooth texture and better compatibility with oils and polymers. Opportunities increased due to rising cosmetic consumption in Asia Pacific, along with strong interest in premium and long-lasting formulations supported by synthetic wax.
Key Challenges
Fluctuating Raw Material Availability and Costs
Producers faced challenges linked to changing supply and pricing of feedstocks such as ethylene, propylene, and natural gas. Volatility affected production planning and long-term contracts, especially for polyethylene and polypropylene wax makers. Manufacturers needed strategic sourcing and flexible pricing models to manage unpredictable cost cycles. These fluctuations sometimes reduced margins and delayed expansion plans for smaller suppliers.
Competition from Natural and Bio-Based Alternatives
The market faced stronger competition from natural waxes such as carnauba, beeswax, and emerging bio-based options promoted by sustainability-focused industries. Some buyers shifted to plant-derived waxes to meet eco-label requirements, which created pressure on synthetic wax in select applications. Producers had to innovate through cleaner processes, specialty grades, and enhanced performance to maintain market share. This challenge pushed suppliers to differentiate more clearly on quality and functionality.
Regional Analysis
North America
North America held about 33% share of the Synthetic Wax Market in 2024. Demand grew as plastics, coatings, adhesives, and packaging manufacturers increased their use of high-performance waxes to improve processing stability and product quality. The region benefited from strong PVC pipe production, rising demand for masterbatches, and steady growth in printing inks. Expansion in personal care and cosmetic formulations also supported consumption. Well-developed manufacturing infrastructure and strict quality standards drove the adoption of high-purity wax grades across the United States and Canada.
Europe
Europe accounted for nearly 28% share of the Synthetic Wax Market in 2024. Growth was supported by strong activity in packaging, automotive components, engineered plastics, and industrial coatings. Regulatory pressure to reduce emissions increased the use of synthetic wax in low-VOC formulations, especially in Germany, France, and the United Kingdom. Demand for Fischer-Tropsch and polyethylene wax rose due to their consistent performance and clean-burning properties. The region also saw steady adoption in adhesives, wood coatings, and technical textiles as manufacturers shifted toward more stable and high-purity additives.
Asia Pacific
Asia Pacific led with about 31% share of the Synthetic Wax Market in 2024. Strong consumption in China, India, Japan, and Southeast Asia came from expansion in plastics processing, packaging, textiles, and printing inks. Rapid industrial growth and rising production of PVC pipes, masterbatches, and molded components sharply increased demand. Synthetic wax adoption grew as manufacturers sought better lubrication, improved surface finish, and stable melt behavior for high-volume operations. The region’s fast-growing cosmetics and personal care industries further supported usage, driven by rising disposable income and premium product demand.
Latin America
Latin America captured nearly 5% share of the Synthetic Wax Market in 2024. Growth remained steady due to expanding plastics, construction, packaging, and automotive sectors in Brazil, Mexico, and Argentina. Demand for synthetic wax increased as industries adopted higher-quality additives to enhance melt flow and product durability. The region also saw rising interest in coatings, adhesives, and printing inks as manufacturing output improved. Local producers focused on cost-effective solutions, but reliance on imports for specialty wax grades influenced overall market performance across key industries.
Middle East and Africa
Middle East and Africa held around 3% share of the Synthetic Wax Market in 2024. Consumption rose gradually as industrial development expanded in construction materials, packaging, textiles, and plastics processing. Gulf countries increased use of synthetic wax in coatings and polymer applications linked to infrastructure and manufacturing projects. Africa experienced demand from adhesives, candles, and low-cost plastics production. Limited regional production of specialty wax led to higher import dependence, but long-term opportunities grew with rising investments in industrial processing and downstream petrochemical capacity.
Market Segmentations:
By Type
- Polyethylene (PE) Wax
- Polypropylene (PP) Wax
- Oxidized Polyethylene (OPE) Wax
- Fischer-Tropsch (FT) Wax
- Montan Wax Substitute
- Polyethylene Glycol (PEG) Wax
By Application
- Plastics Processing
- Coatings and Inks
- Adhesives and Sealants
- Personal Care and Cosmetics
- Textiles and Fibers
- Candles
By Geography
- North America
- U.S.
- Canada
- Mexico
- Europe
- Germany
- France
- U.K.
- Italy
- Spain
- Rest of Europe
- Asia Pacific
- China
- Japan
- India
- South Korea
- South-east Asia
- Rest of Asia Pacific
- Latin America
- Brazil
- Argentina
- Rest of Latin America
- Middle East & Africa
- GCC Countries
- South Africa
- Rest of the Middle East and Africa
Competitive Landscape
The Synthetic Wax Market is shaped by leading companies such as Honeywell International Inc, Mitsui Chemicals Inc, BASF SE, Evonik Industries AG, Westlake Chemical Corporation, The Lubrizol Corporation, Sasol, Dow, The International Group Inc, and Clariant AG. Competition focuses on advancing high-purity wax grades, improving process efficiency, and meeting performance needs in plastics, coatings, adhesives, and personal care applications. Producers invest in R&D to develop cleaner, low-emission formulations that support regulatory compliance and premium product lines. Many companies expand production capacity to serve fast-growing regions and strengthen supply reliability. Strategic partnerships and technology upgrades help suppliers deliver consistent melt properties, better lubrication, and enhanced surface quality across applications. Competitors also emphasize product customization to secure long-term contracts with converters and formulators seeking tailored wax solutions. Market rivalry continues to intensify as manufacturers push toward high-performance, sustainable, and application-specific synthetic wax grades.
Key Player Analysis
- Honeywell International Inc
- Mitsui Chemicals Inc
- BASF SE
- Evonik Industries AG
- Westlake Chemical Corporation
- The Lubrizol Corporation
- Sasol
- Dow
- The International Group Inc
- Clariant AG
Recent Developments
- In 2025, Clariant AG launched Ceridust™ 1310, a micronized rice bran wax compound aimed at providing a reliable, bio-based alternative to carnauba wax.
- In February 2025, Sasol Chemicals launched two new micronized wax products: SASOLWAX LC Spray 30 G and LC Spray 30 G-EF.
- In 2025, Evonik Industries AG announced the strategic merger of its Silica and Silanes business lines into a new entity called Smart Effects.
Report Coverage
The research report offers an in-depth analysis based on Type, Application and Geography. It details leading market players, providing an overview of their business, product offerings, investments, revenue streams, and key applications. Additionally, the report includes insights into the competitive environment, SWOT analysis, current market trends, as well as the primary drivers and constraints. Furthermore, it discusses various factors that have driven market expansion in recent years. The report also explores market dynamics, regulatory scenarios, and technological advancements that are shaping the industry. It assesses the impact of external factors and global economic changes on market growth. Lastly, it provides strategic recommendations for new entrants and established companies to navigate the complexities of the market.
Future Outlook
- The market will expand as plastics and masterbatch production increases across major regions.
- Demand for high-purity Fischer-Tropsch wax will rise due to cleaner processing needs.
- Growth in coatings and inks will support wider adoption of synthetic wax for surface enhancement.
- Personal care companies will use more synthetic wax to improve texture and stability in formulations.
- Adhesives and sealants will adopt advanced wax grades to enhance bonding efficiency and melt control.
- Bio-based and low-emission wax options will gain traction in sustainability-focused industries.
- Manufacturers will invest in customized wax grades tailored for specific industrial applications.
- Asia Pacific will strengthen its lead as industrial output and packaging demand continue to rise.
- Automation in plastics processing will increase reliance on waxes that offer consistent melt behavior.
- Competition from natural waxes will encourage innovation in performance-driven synthetic wax solutions.
Request a Free Sample
Fill in your details and we'll send you a free sample report.
- Sample data tables & charts
- Research methodology
Need a Custom Version of This Report?
Tailor the scope, geography, or segments to your exact requirements.
- Custom geography or segment scope
- Direct access to our analyst team
Frequently Asked Questions
What is the current market size for Synthetic Wax Market, and what is its projected size in 2032?
At what Compound Annual Growth Rate is the Synthetic Wax Market projected to grow between 2025 and 2032?
Who are the main players in the global synthetic wax market?
What are the major market drivers of the synthetic wax industry?
What are the major market restraints of the synthetic wax industry?
What are the major market opportunities of the synthetic wax industry?
Who are the leading companies in the Synthetic Wax Market?
Table of Content
Chapter 1. Report Introduction
- 1.1 Report Description & Purpose
- 1.1.1 Report Title & Market Definition
- 1.1.2 Unique Selling Propositions (USP) & Key Differentiators
- 1.1.3 Value Proposition for Stakeholders
- 1.2 Research Objectives
- 1.2.1 Market Sizing Objectives (Volume & Revenue) (Volume Where Applicable)
- 1.2.2 Segmentation Objectives
- 1.2.3 Competitive Intelligence Objectives
- 1.2.4 Forecast & Scenario Objectives
- 1.3 Report Scope
- 1.3.1 Synthetic Wax Scope – Segments & Subsegments Covered
- 1.3.2 Geographic Scope – Regions & Countries Covered
- 1.3.3 Historical Period, Base Year & Forecast Period (2024; forecast to 2032)
- 1.3.4 Inclusions & Exclusions
- 1.4 Industry Classification & Applicable Codes
- 1.5 Currency, Measurement Units & Valuation Basis
- 1.6 Target Stakeholders
- 1.7 Limitations & Assumptions
Chapter 2. Executive Summary
- 2.1 Global Synthetic Wax Market Snapshot
- 2.1.1 Market Size – Historical (2024) & Forecast (2024-2032) (2024: USD 3.39 billion → 2032: USD 4.89 billion)
- 2.1.2 Volume & Revenue – Global Totals (Volume Where Applicable)
- 2.1.3 Key Market Highlights – Top Five Facts
- 2.2 Synthetic Wax Market Segmentation Snapshot
- 2.2.1 Market Split by Region – 2024 vs. 2032
- 2.3 Competitive Snapshot
- 2.3.1 Top 10 Players by Revenue Share – 2024
- 2.3.2 Top 10 Players by Volume Share – 2024 (Volume Where Applicable)
- 2.3.3 Recent Strategic Developments (18-Month Summary)
- 2.4 Key Investment Highlights & Strategic Conclusions
Chapter 3. Synthetic Wax Market Dynamics & Industry Analysis
- 3.1 Market Overview & Context
- 3.1.1 Synthetic Wax Market Position in the Broader Industry Value Chain
- 3.1.2 Demand Structure & Purchasing Dynamics
- 3.1.3 Market Maturity & Development Stage by Region
- 3.2 Synthetic Wax Market Drivers
- 3.3 Synthetic Wax Market Restraints & Challenges
- 3.4 Synthetic Wax Market Opportunities
- 3.5 Porter's Five Forces Analysis
- 3.5.1 Threat of New Entrants
- 3.5.2 Bargaining Power of Suppliers
- 3.5.3 Bargaining Power of Buyers
- 3.5.4 Threat of Substitutes
- 3.5.5 Competitive Rivalry – Intensity Assessment
- 3.6 Synthetic Wax Value Chain Analysis
- 3.6.1 Upstream – Key Inputs, Resources & Suppliers
- 3.6.1.1 Key Input/Resource 1
- 3.6.1.2 Key Input/Resource 2
- 3.6.1.3 Key Input/Resource 3
- 3.6.2 Midstream – Core Operations & Value Creation
- 3.6.2.1 Operating Model & Process Overview
- 3.6.2.2 Key Operating Locations & Capabilities by Company
- 3.6.3 Downstream – Market Channels & End Users
- 3.6.3.1 Direct Sales & Customer Engagement Channels
- 3.6.3.2 Indirect Sales, Intermediaries & Partner Channels
- 3.6.4 Value Chain Profitability Analysis
- 3.6.1 Upstream – Key Inputs, Resources & Suppliers
- 3.7 PESTEL Analysis
- 3.7.1 Political Factors
- 3.7.2 Economic Factors
- 3.7.3 Social Factors
- 3.7.4 Technological Factors
- 3.7.5 Environmental Factors
- 3.7.6 Legal Factors
- 3.8 Synthetic Wax Supply Chain Analysis
- 3.8.1 Critical Input & Resource Availability Risk Assessment
- 3.8.2 Supplier & Operational Concentration Risk (Geographic Exposure)
- 3.8.3 Supply & Service Disruption Impact Analysis
- 3.9 Regulatory & Policy Landscape
Note: The regulatory and policy landscape section covers regulations based on their applicability to the market, Synthetic Wax category, geography, and scope of the study. Only regulatory frameworks with a material impact on operations, compliance, trade, sustainability, or market access are analyzed in detail.
Chapter 4. Key Investment Pockets & Opportunity Analysis
- 4.1 Synthetic Wax Market Attractiveness Analysis
- 4.1.1 By Region – Investment Attractiveness Matrix (Market Size × CAGR)
- 4.2 Absolute Revenue Growth Opportunity
- 4.2.1 By Region – Absolute Revenue Growth Through 2032
- 4.3 Incremental Demand Opportunity
- 4.3.1 By Region – Incremental Demand Through 2032
- 4.3.2 Segment – Incremental Demand
- 4.4 Emerging Submarket Opportunity Deep Dive (Subject to Applicability)
- 4.5 Priority Market Opportunity Scorecards
- 4.5.1 United States
- 4.5.2 Europe
- 4.5.3 Asia
- 4.5.4 Middle East & Africa
Note: Priority market opportunity scorecards reflect the geographic scope and strategic relevance of the study. Listed markets are indicative and may be adapted to the industry.
Chapter 5. Synthetic Wax Cross-Border Trade & Market Access Analysis
- 5.1 International Trade & Cross-Border Activity Overview
- 5.1.1 Global Export Value by Country (2024)
- 5.1.2 Global Export Volume by Country (2024) (Volume Where Applicable)
- 5.1.3 Global Import Value by Country (2024)
- 5.1.4 Global Import Volume by Country (2024) (Volume Where Applicable)
- 5.1.5 Net Trade Balance by Country (2024)
- 5.2 Export Analysis – Segment
- 5.2.1 Category 1 (Applicable Classification Code)
- 5.2.2 Category 2 (Applicable Classification Code)
- 5.2.3 Category 3 (Applicable Classification Code)
- 5.2.4 Category 4 (Applicable Classification Code)
- 5.2.5 Category 5 (Applicable Classification Code)
- 5.3 Import Analysis – Segment
- 5.3.1 Category 1 (Applicable Classification Code)
- 5.3.2 Category 2 (Applicable Classification Code)
- 5.3.3 Category 3 (Applicable Classification Code)
- 5.3.4 Category 4 (Applicable Classification Code)
- 5.3.5 Category 5 (Applicable Classification Code)
- 5.4 Cross-Border Pricing & Transaction Benchmarks
- 5.4.1 Export Pricing – Segment & Country
- 5.4.2 Import Pricing – Segment & Source Country
- 5.4.3 Price Trends (2024)
- 5.5 Key Cross-Border Trade & Delivery Routes
- 5.5.1 Cross-Border Trade/Delivery Route 1
- 5.5.2 Cross-Border Trade/Delivery Route 2
- 5.5.3 Cross-Border Trade/Delivery Route 3
- 5.5.4 Cross-Border Trade/Delivery Route 4
- 5.5.5 Cross-Border Trade/Delivery Route 5
- 5.6 Trade Policy & Market Access Impact Assessment
- 5.6.1 Tariff & Non-Tariff Barriers
- 5.6.2 Regional Trade & Economic Integration Frameworks
- 5.6.3 Bilateral & Multilateral Trade Agreements
- 5.6.4 Cross-Border Operating, Licensing & Localization Requirements
Note: This chapter applies where cross-border trade or delivery is relevant to Synthetic Wax. Goods, services, and digital offerings are assessed using applicable classifications and transaction measures. Import-export volumes, trade balances, and route analyses are included only where meaningful to the market.
Chapter 6. Competitive Landscape & Company Benchmarking
- 6.1 Synthetic Wax Market Concentration & Structure
- 6.1.1 Herfindahl-Hirschman Index (HHI) – vs. 2024
- 6.1.2 Leading, Mid-Sized & Emerging Player Structure
- 6.1.3 Global, Regional & Local Player Dynamics
- 6.2 Synthetic Wax Market Share Analysis – 2024
- 6.2.1 Global Revenue Share by Company
- 6.2.2 Global Volume Share by Company (Volume Where Applicable)
- 6.2.3 Regional Revenue Share
- 6.2.4 Market Share Evolution ( vs. 2024)
- 6.2.5 Company Market Share by Key Segment
- 6.2.6 Company Market Share by Customer Group
- 6.3 Operating Scale, Capacity & Infrastructure Analysis
- 6.3.1 Global Operating Scale & Supply Capacity
- 6.3.2 Resource Utilization & Operating Efficiency
- 6.3.3 Output, Service Delivery & Activity Metrics
- 6.3.4 Operating Footprint & Infrastructure Map
- 6.3.5 Planned Operational & Capacity Expansion
- 6.4 Synthetic Wax Competitive Benchmarking Matrix
- 6.4.1 Revenue, Growth, Profitability & Operating Metric Comparison
- 6.4.2 Channel Revenue Mix
- 6.4.3 Geographic Revenue Exposure
- 6.4.4 R&D Intensity
- 6.4.5 Sustainability Maturity
- 6.5 Strategic Developments in Synthetic Wax (Last 24 Months)
- 6.5.1 Mergers, Acquisitions & Divestments
- 6.5.2 New Products, Services & Solutions in Synthetic Wax
- 6.5.3 Operational & Infrastructure Expansions
- 6.5.4 Strategic Alliances, Joint Ventures & Partnerships
- 6.5.5 Distribution Expansion & Market Entry
- 6.5.6 Sustainability & ESG Initiatives
- 6.6 Competitive Strategy Mapping
- 6.6.1 Leader, Challenger, Follower & Niche Classification
- 6.6.2 Pricing Strategy Comparison
- 6.6.3 Channel Strategy Matrix
Note: Strategic developments are included based on their materiality and the availability of reliable information.
Chapter 7. Global Synthetic Wax Market – By Sales & Delivery Channel
- 7.1 Segment Overview
- 7.1.1 Volume & Revenue Split by Channel (2024 & 2032) (Volume Where Applicable)
- 7.1.2 Channel Mix Evolution (2024-2032)
Chapter 8. Regional Market Analysis – Global Overview
- 8.1 Global Regional Overview
- 8.1.1 Regional Volume Share (Volume Where Applicable)
- 8.1.2 Regional Revenue Share
- 8.1.3 Regional Volume by Region (Volume Where Applicable)
- 8.1.4 Regional Revenue by Region
- 8.1.5 Regional Forecast Through 2032
- 8.2 Cross-Regional Segment Analysis
- 8.2.1 By Sales & Delivery Channel
- 8.2.2 By Competitive Positioning & Price Tier
Chapter 9. North America Synthetic Wax Market
- 9.1 United States
- 9.2 Canada
- 9.3 Mexico
Chapter 10. Europe Synthetic Wax Market
- 10.1 Germany
- 10.2 France
- 10.3 Italy
- 10.4 United Kingdom
- 10.5 Spain
- 10.6 Poland
- 10.7 Russia
- 10.8 Netherlands
- 10.9 Belgium
- 10.10 Sweden
- 10.11 Denmark
- 10.12 Norway
- 10.13 Rest of Europe
Chapter 11. Asia Pacific Synthetic Wax Market
- 11.1 China
- 11.2 India
- 11.3 Japan
- 11.4 South Korea
- 11.5 Thailand
- 11.6 Indonesia
- 11.7 Vietnam
- 11.8 Malaysia
- 11.9 Australia
- 11.10 Rest of Asia Pacific
Chapter 12. Latin America Synthetic Wax Market
- 12.1 Brazil
- 12.2 Argentina
- 12.3 Colombia
- 12.4 Chile
- 12.5 Rest of Latin America
Chapter 13. Middle East Synthetic Wax Market
- 13.1 Saudi Arabia
- 13.2 United Arab Emirates
- 13.3 Turkey
- 13.4 Israel
- 13.5 Iran
- 13.6 Rest of the Middle East
Chapter 14. Africa Synthetic Wax Market
- 14.1 South Africa
- 14.2 Egypt
- 14.3 Nigeria
- 14.4 Morocco
- 14.5 Rest of Africa
Chapter 15. Synthetic Wax Company Profiles
- 15.1 [Company 01]
- 15.1.1 Company Overview
- 15.1.2 Key Management Personnel
- 15.1.3 Products & Services Portfolio
- 15.1.4 Financial Performance
- 15.1.5 Key Market Focus & Geographic Presence
- 15.1.6 Recent Developments & Strategic Initiatives
Note: The company profile list is preliminary and may change based on research findings, market developments, data availability, and client requirements.
Chapter 16. Appendices
- Appendix A – List of Abbreviations & Acronyms
- Appendix B – Industry Classification Code Reference – Full Series
- Appendix C – Supply, Output & Operating Capacity Data Tables
- Appendix D – End-Use & Demand Base Tables
- Appendix E – Demand, Adoption & Usage Assumptions
- Appendix F – Pricing & Revenue Metric Reference Tables
- Appendix G – Company Operations & Infrastructure Database
- Appendix H – Cross-Border Trade & Activity Data Tables (Where Applicable)
- Appendix I – Regulatory Summary Tables
- Appendix J – Primary Research Participant List (Anonymized)
- Appendix K – Primary Research Questionnaire Framework
- Appendix L – Data Sources & Bibliography
- Appendix M – Market Size Divergence & Source Comparison
Chapter 17. Research Methodology
- 17.1 Research Framework & Philosophy
- 17.2 Secondary Research – Sources, Hierarchy & Data Extraction
- 17.3 Data Modeling – Bottom-Up & Top-Down Market Sizing
- 17.4 Primary Research – Stakeholder Framework, LOI & Sample Sizes
- 17.5 Forecast Methodology – Regression, Scenario & Sensitivity Analysis
- 17.6 Quality Control – Four-Layer Validation Framework
- 17.7 Limitations & Standard Assumptions
- 17.8 Disclaimer
