| REPORT ATTRIBUTE |
DETAILS |
| Historical Period |
2020-2023 |
| Base Year |
2024 |
| Forecast Period |
2025-2032 |
| Tactile Sensor Market Size 2024 |
USD 1,300.59 million |
| Tactile Sensor Market, CAGR |
15.40% |
| Tactile Sensor Market Size 2032 |
USD 4,071.97 million |
Market Overview
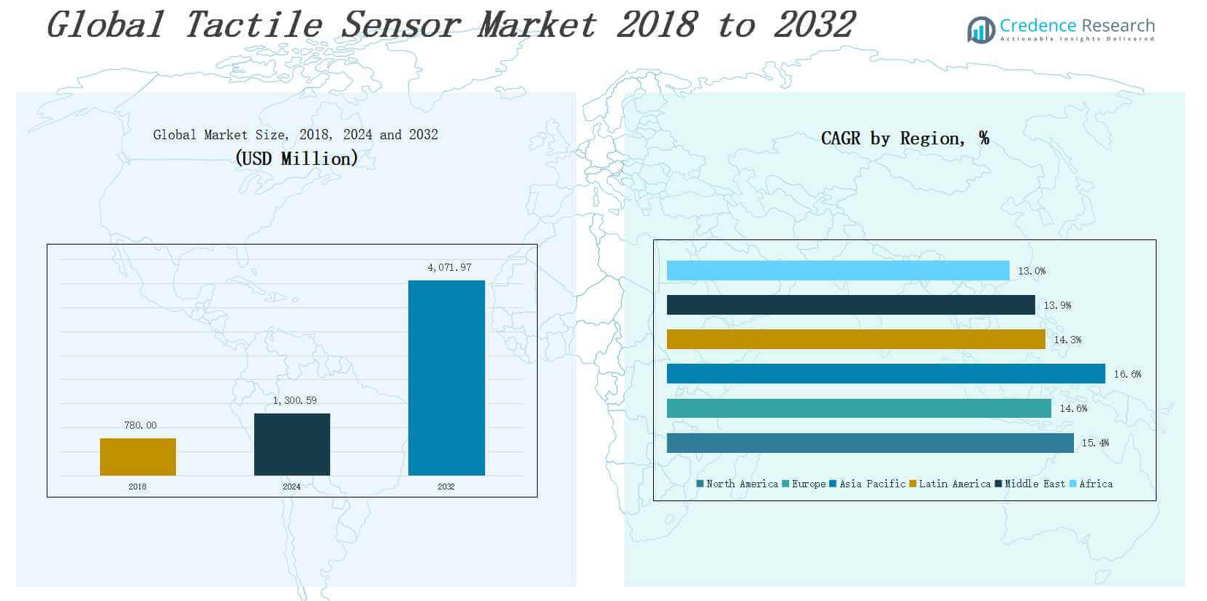
The Tactile Sensor Market size was valued at USD 780.00 million in 2018 to USD 1,300.59 million in 2024 and is anticipated to reach USD 4,071.97 million by 2032, at a CAGR of 15.40 % during the forecast period.
The Tactile Sensor Market is experiencing robust growth driven by increasing adoption of robotics and automation across industries such as healthcare, automotive, and manufacturing. Rising demand for human-machine interface (HMI) systems in consumer electronics and wearable technology is accelerating sensor integration. Advancements in artificial intelligence and machine learning are enhancing the functionality and precision of tactile sensing, enabling real-time response and adaptability in complex environments. In the automotive sector, tactile sensors are gaining traction in autonomous driving systems and in-cabin touch interfaces. Healthcare applications, including prosthetics and minimally invasive surgery, are benefiting from sensors that mimic human touch sensitivity. Trends indicate a shift toward flexible, stretchable, and miniaturized sensor designs, supporting integration into soft robotics and next-generation smart textiles. Demand for multi-functional sensors with high spatial resolution and pressure sensitivity continues to rise, especially in sectors requiring precision touch feedback. Strategic collaborations and R&D investments are further driving innovation and market competitiveness.
The Tactile Sensor Market demonstrates strong geographic diversity with significant growth across North America, Europe, Asia Pacific, Latin America, the Middle East, and Africa. North America leads due to technological innovation and early adoption in healthcare and robotics. Europe follows with robust industrial automation and automotive integration. Asia Pacific shows the fastest growth, driven by high-volume electronics manufacturing in China, Japan, South Korea, and India. Latin America is expanding through retail tech and smart healthcare, while the Middle East focuses on smart infrastructure and digital transformation. Africa shows emerging potential in education, diagnostics, and localized innovation. Key players in the market include Tekscan, SynTouch, Pressure Profile Systems, Tacterion GmbH, Sensor Products Inc., and Weiss Robotics. These companies are investing in R&D, flexible sensor technologies, and strategic partnerships to meet rising global demand across various end-use sectors and strengthen their international presence.
Market Insights
- The Tactile Sensor Market was valued at USD 780.00 million in 2018, reached USD 1,300.59 million in 2024, and is projected to hit USD 4,071.97 million by 2032, growing at a CAGR of 15.40%.
- High demand for robotics and automation across healthcare, automotive, and manufacturing sectors is driving market expansion globally.
- Rising adoption of human-machine interface (HMI) systems in consumer electronics and wearables is accelerating tactile sensor integration.
- Advancements in AI and machine learning are enhancing sensor precision, enabling real-time feedback in surgical tools, autonomous vehicles, and collaborative robots.
- North America leads the market with strong investment in R&D and early adoption, while Asia Pacific shows the fastest growth due to high electronics production.
- Complex sensor design, high manufacturing costs, and lack of standardization challenge market scalability and interoperability across diverse applications.
- Key players such as Tekscan, SynTouch, Tacterion GmbH, and Pressure Profile Systems are expanding globally with innovations in flexible, high-resolution tactile sensor technologies.
Access crucial information at unmatched prices!
Request your sample report today & start making informed decisions powered by Credence Research Inc.!
Download Sample
Market Drivers
Growing Demand for Human-Machine Interface (HMI) Solutions
The Tactile Sensor Market is driven by the rapid advancement of human-machine interface technologies across various industries. These sensors enable machines to detect touch, pressure, texture, and vibration, making them essential for interactive systems. The expansion of smartphones, tablets, and wearable electronics has created a strong demand for tactile feedback to enhance user experience. Manufacturers are integrating tactile sensors into displays and control panels to support intuitive interaction. It allows automation systems to operate with increased precision. Touch-based HMI applications are also finding growing relevance in industrial and consumer robotics. This trend continues to expand the market’s application base.
- For instance, Tekscan has developed high-resolution tactile sensor arrays that are widely used in medical robotics to provide surgeons with real-time touch feedback during minimally invasive procedures, improving precision and patient outcomes.
Rising Integration in Robotics and Automation
Tactile sensors play a crucial role in enabling robots to interact effectively with their environments. In the Tactile Sensor Market, demand is surging due to rising investments in robotic systems for manufacturing, healthcare, and logistics. These sensors allow robotic hands to detect and respond to external forces, improving grip and object manipulation. It enhances operational efficiency and safety in collaborative robotics (cobots). Medical robotics are also benefiting from precise tactile input, supporting delicate surgical procedures. With automation advancing globally, the need for real-time sensory feedback is becoming more critical, driving adoption across sectors.
- For instance, the Twendy-One humanoid robot from Waseda University employs 241 capacitive tactile sensors in each hand, enabling it to safely perform complex tasks such as in-hand manipulation and tactile object recognition, which are critical for collaborative and service robotics.
Technological Advancements in Flexible and Miniaturized Sensors
Recent innovations in materials and electronics have led to the development of flexible, stretchable, and miniaturized tactile sensors. These advancements are expanding the application scope of the Tactile Sensor Market in wearables, soft robotics, and prosthetics. It supports seamless integration into irregular or dynamic surfaces. These sensors now offer higher spatial resolution, better sensitivity, and improved durability. Emerging use cases include artificial skin for robots and pressure-sensitive garments. Continuous R&D is pushing the boundaries of tactile sensing, leading to highly adaptive and responsive technologies. This evolution is expected to support diverse future applications.
Expanding Use in Healthcare and Assistive Technologies
Healthcare applications are creating significant opportunities in the Tactile Sensor Market. Tactile sensors are being increasingly used in prosthetics, rehabilitation devices, and minimally invasive surgical tools. They offer enhanced feedback, which improves patient care and device accuracy. It enables doctors and technicians to perform sensitive procedures with improved control. Assistive technologies, such as haptic gloves for visually impaired users, are also integrating tactile feedback. The aging global population is further amplifying demand for such advanced medical tools. This growing reliance on smart healthcare systems strengthens the market outlook.
Market Trends
Adoption of Soft Robotics and Bio-Inspired Technologies
The Tactile Sensor Market is witnessing a growing trend toward soft robotics and biologically inspired systems. These technologies require sensors that can mimic the sensitivity and adaptability of human skin. Tactile sensors with stretchable and flexible properties are enabling robots to interact delicately with complex environments. It supports applications in healthcare, food processing, and human-assistive devices. Soft actuators paired with tactile sensors improve manipulation and dexterity. Researchers are developing artificial skins and muscle-like materials to enhance responsiveness. This convergence is reshaping robotic capabilities.
- For instance, the TacPalm SoftHand uses a high-density tactile sensor array to achieve over 90% accuracy in 3D surface reconstruction, enabling delicate object handling.
Emergence of AI-Driven Tactile Intelligence
Artificial intelligence is transforming how tactile sensors interpret and respond to environmental stimuli. In the Tactile Sensor Market, machine learning models are being applied to process sensor data in real time. It allows systems to distinguish between textures, predict slippage, or adjust grip dynamically. This smart sensing approach enhances the performance of autonomous systems in unpredictable settings. AI is also enabling self-calibrating tactile networks for adaptive feedback. This trend supports advanced robotics, prosthetics, and next-generation industrial automation. The synergy between AI and tactile technology is a critical enabler of future intelligent systems.
Miniaturization and Integration with IoT Ecosystems
Tactile sensors are becoming smaller, more efficient, and easier to integrate into connected devices. The Tactile Sensor Market is evolving to meet the needs of Internet of Things (IoT) applications across wearables, consumer electronics, and smart infrastructure. It facilitates real-time monitoring of pressure, touch, and strain in compact devices. Thin-film sensors and printed electronics are enabling this compactness without compromising performance. Manufacturers are embedding tactile sensors into surfaces, textiles, and curved structures. These developments support new use cases in remote diagnostics, human interaction, and smart packaging. The fusion of tactile and IoT technologies is expanding market possibilities.
- For instance, Elektra Wearables launched a T-shirt in January 2022 embedded with IoT sensors and data analytics, allowing users to monitor and analyze outdoor activities and exercise in real time, demonstrating the integration of tactile sensing in smart textiles for fitness and health monitoring.
Advancement in Multi-Modal and High-Resolution Sensing
Manufacturers are focusing on developing multi-modal tactile sensors that can simultaneously measure pressure, vibration, and temperature. The Tactile Sensor Market is aligning with demands for high-resolution and data-rich tactile inputs. It allows devices to replicate the nuanced perception of the human sense of touch. These sensors are becoming essential in surgical tools, robotic grippers, and virtual reality haptics. High-density sensor arrays are improving the spatial resolution required for precise feedback. Material innovations, including graphene and nanocomposites, are supporting these advancements. This trend is setting new standards for tactile performance in smart applications.
Market Challenges Analysis
Complexity in Sensor Design and Integration
The Tactile Sensor Market faces challenges related to the complexity of designing sensors that can replicate the sensitivity and adaptability of human touch. Achieving accurate detection of pressure, texture, and temperature across varied surfaces requires advanced materials and precise engineering. It becomes difficult to maintain consistency, durability, and responsiveness in miniaturized formats. Integration into curved or flexible surfaces, especially in wearables and soft robotics, adds further complications. Manufacturers must also address issues like signal interference, power consumption, and cross-sensitivity. These technical hurdles slow down large-scale adoption and increase development costs.
High Manufacturing Costs and Limited Standardization
Cost remains a significant barrier in the widespread deployment of tactile sensors across industries. The Tactile Sensor Market struggles with high expenses associated with materials, fabrication technologies, and specialized testing. It affects the scalability and affordability of tactile-enabled products, particularly in consumer electronics and prosthetics. A lack of standardization in design and calibration protocols also hampers interoperability between devices. Companies must invest in custom integration for specific use cases, extending development timelines. This fragmentation creates uncertainty in procurement and delays mass commercialization. Standardized platforms are needed to accelerate adoption across emerging applications.
Market Opportunities
Expansion of Wearable Technology and Smart Textiles
The Tactile Sensor Market presents strong opportunities in the growing segment of wearable devices and smart textiles. Tactile sensors embedded in clothing and accessories can monitor physical activity, posture, and pressure points, supporting health tracking and rehabilitation. It enables real-time feedback for users and healthcare providers. Sports, fitness, and eldercare sectors are showing rising interest in such applications. Advances in flexible electronics and conductive fabrics are making these integrations more practical and scalable. Companies exploring consumer-oriented wearable solutions can tap into expanding demand for comfort, interactivity, and biometric feedback.
Emergence of Haptic Interfaces in Virtual and Augmented Reality
The rising adoption of virtual reality (VR) and augmented reality (AR) is opening new frontiers for tactile sensing technologies. The Tactile Sensor Market is positioned to support the development of haptic gloves, suits, and controllers that deliver lifelike feedback. It enhances immersion and realism in gaming, simulation, and training environments. Enterprises in defense, aerospace, and medical training are investing in haptic-enabled platforms to improve skill acquisition and reduce physical risk. Tactile sensors play a critical role in bridging digital and physical experiences. The push toward multi-sensory digital interfaces will drive long-term market growth.
Market Segmentation Analysis:
By Type
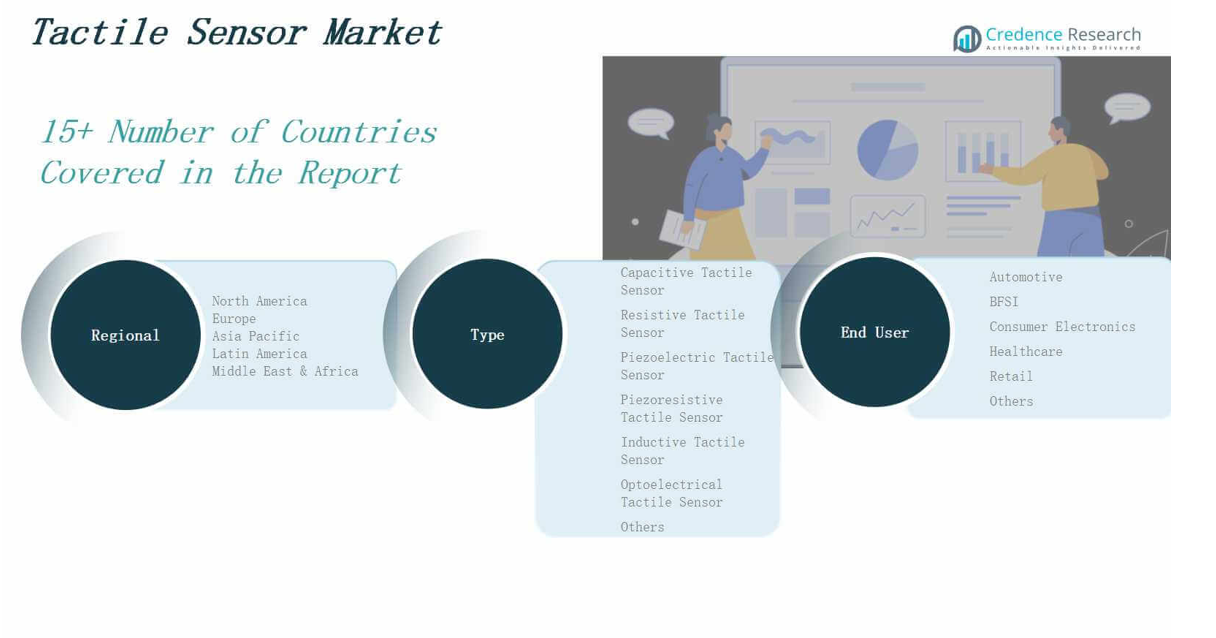
The Tactile Sensor Market is segmented into capacitive, resistive, piezoelectric, piezoresistive, inductive, optoelectrical, and others. Capacitive tactile sensors hold a significant share due to their high sensitivity, stability, and durability, particularly in consumer electronics and robotics. Resistive sensors remain popular for their simplicity and cost-effectiveness in medical and automotive applications. Piezoelectric and piezoresistive sensors are preferred in environments requiring dynamic pressure measurement and higher response accuracy. Inductive and optoelectrical sensors are gaining adoption in industrial automation and touchless systems. The others segment includes emerging technologies that support specialized applications in wearables and soft robotics. This diverse classification supports broad use across precision-critical industries.
For instance, Honeywell integrates piezoelectric tactile sensors in industrial robots to monitor and adjust grip force.
By End User
]The Tactile Sensor Market serves end users such as automotive, BFSI, consumer electronics, healthcare, retail, and others. Automotive leads due to growing use in touch interfaces, driver monitoring, and robotics within production lines. Consumer electronics follow closely with rising integration in smartphones, tablets, and gaming devices to enhance user interaction. Healthcare applications are growing rapidly with tactile sensors improving prosthetics, surgical instruments, and rehabilitation tools. The retail sector leverages these sensors for interactive kiosks and automated checkouts. BFSI adopts them for secure biometric-enabled ATMs and touch systems. The others category includes education, robotics R&D, and defense applications, contributing to overall market diversity.
- For instance, Continental AG has integrated advanced touch sensors with haptic feedback into automotive dashboards and center consoles, enhancing driver interaction and infotainment experiences in passenger vehicles.
Segments:
Based on Type
- Capacitive Tactile Sensor
- Resistive Tactile Sensor
- Piezoelectric Tactile Sensor
- Piezoresistive Tactile Sensor
- Inductive Tactile Sensor
- Optoelectrical Tactile Sensor
- Others
Based on End User
- Automotive
- BFSI
- Consumer Electronics
- Healthcare
- Retail
- Others
Based on Region
- North America
- Europe
- Germany
- France
- U.K.
- Italy
- Spain
- Rest of Europe
- Asia Pacific
- China
- Japan
- India
- South Korea
- South-east Asia
- Rest of Asia Pacific
- Latin America
- Brazil
- Argentina
- Rest of Latin America
- Middle East & Africa
- GCC Countries
- South Africa
- Rest of the Middle East and Africa
Regional Analysis
North America
The North America Tactile Sensor Market size was valued at USD 261.30 million in 2018 to USD 429.97 million in 2024 and is anticipated to reach USD 1,344.16 million by 2032, at a CAGR of 15.4% during the forecast period. North America leads the Tactile Sensor Market with the highest market share, supported by strong adoption in robotics, automotive safety systems, and medical devices. It benefits from well-established tech infrastructure, significant R&D investments, and early adoption of AI-powered haptic solutions. The United States remains the largest contributor, driven by innovation in smart wearables and autonomous vehicles. It also supports strong demand from healthcare and aerospace sectors. Canada and Mexico contribute to regional growth through expanding electronics manufacturing and automotive production. The region’s leadership is reinforced by strategic collaborations between industry players and research institutions.
Europe
The Europe Tactile Sensor Market size was valued at USD 196.64 million in 2018 to USD 314.58 million in 2024 and is anticipated to reach USD 927.81 million by 2032, at a CAGR of 14.6% during the forecast period.
Europe holds a considerable share in the Tactile Sensor Market, driven by advancements in industrial automation and automotive innovation. Germany, France, and the UK are the primary markets, focusing on integrating tactile sensing into robotics, medical tools, and consumer electronics. It shows growing adoption of tactile sensors in rehabilitation and elderly care applications. The region also benefits from government initiatives promoting Industry 4.0 and digital manufacturing. Sensor miniaturization and flexible electronics drive further application expansion. Europe’s commitment to precision technologies supports continued market growth.
Asia Pacific
The Asia Pacific Tactile Sensor Market size was valued at USD 225.42 million in 2018 to USD 389.98 million in 2024 and is anticipated to reach USD 1,328.69 million by 2032, at a CAGR of 16.6% during the forecast period.
Asia Pacific is the fastest-growing region in the Tactile Sensor Market, fueled by high demand in consumer electronics, robotics, and automotive manufacturing. China, Japan, South Korea, and India lead regional expansion through rapid industrialization and strong tech capabilities. It benefits from large-scale production and lower manufacturing costs. Government support for smart factories and IoT infrastructure enhances adoption rates. The region shows increasing integration of tactile sensors in wearable devices and mobile technologies. Strong export activity and local demand contribute to its global market impact.
Latin America
The Latin America Tactile Sensor Market size was valued at USD 48.59 million in 2018 to USD 80.23 million in 2024 and is anticipated to reach USD 232.79 million by 2032, at a CAGR of 14.3% during the forecast period.
Latin America demonstrates steady growth in the Tactile Sensor Market, led by Brazil and Mexico. It gains traction in healthcare technology, smart retail, and automotive systems. Consumer electronics adoption is expanding across urban centers, creating demand for touch-enabled devices. Growth in local manufacturing ecosystems is improving supply capabilities. It also supports medical device applications, particularly in diagnostics and rehabilitation tools. The region’s digital transformation efforts support long-term sensor integration.
Middle East
The Middle East Tactile Sensor Market size was valued at USD 29.64 million in 2018 to USD 46.29 million in 2024 and is anticipated to reach USD 130.73 million by 2032, at a CAGR of 13.9% during the forecast period.
The Middle East Tactile Sensor Market is expanding with rising investments in smart city infrastructure, healthcare innovation, and advanced retail systems. GCC countries, especially the UAE and Saudi Arabia, are early adopters of touch-based technologies in kiosks and smart wearables. It benefits from a focus on digital transformation and public-private tech partnerships. Healthcare facilities are incorporating tactile-enabled robotic tools for surgery and patient care. It also supports AI-based human-machine interfaces across industries. The region’s economic diversification is driving broader application of tactile sensing.
Africa
The Africa Tactile Sensor Market size was valued at USD 18.41 million in 2018 to USD 39.54 million in 2024 and is anticipated to reach USD 107.78 million by 2032, at a CAGR of 13.0% during the forecast period. Africa is emerging in the Tactile Sensor Market with growing interest in healthcare, education technology, and low-cost consumer devices. South Africa and Egypt are leading with investments in robotics labs, medical equipment, and electronic manufacturing. It supports increasing demand for affordable touch-enabled interfaces and diagnostic tools. Infrastructure limitations remain a challenge, but innovation hubs and international partnerships are fostering market activity. It benefits from localized solutions that integrate tactile technology into essential services. The region holds long-term potential for sensor-driven development.
Shape Your Report to Specific Countries or Regions & Enjoy 30% Off!
Key Player Analysis
- Tekscan, Inc.
- Pressure Profile Systems
- Sensor Products Inc.
- Weiss Robotics
- SynTouch Inc.
- Tacterion GmbH
Competitive Analysis
The Tactile Sensor Market features a competitive landscape shaped by innovation, product differentiation, and strategic partnerships. Leading companies focus on developing high-resolution, flexible, and multi-functional sensors to meet the growing demand across robotics, healthcare, and consumer electronics. It includes both established players and emerging startups that invest in AI integration, miniaturization, and material advancement. Companies such as Tekscan, SynTouch, and Tacterion GmbH compete on technology and application-specific customization. Strategic collaborations with OEMs and research institutions help accelerate product development and market reach. Firms are also expanding their presence in Asia Pacific to leverage cost-effective manufacturing and growing regional demand. The market remains fragmented, encouraging continuous innovation and specialization. Strong intellectual property portfolios, diversified sensor offerings, and integration with smart systems provide a competitive edge. Players also focus on meeting industry-specific regulatory standards, enhancing product reliability, and reducing sensor response time to secure long-term contracts with automotive, medical, and electronics manufacturers.
Recent Developments
- In February 2025, Tekscan announced a strategic partnership with FLEXOO to expand its capabilities in printed tactile sensors, aiming to support advanced applications across automotive, electronics, and industrial sectors.
- In June 2025, Brighter Signals B.V. launched a novel multi-modal tactile sensor platform made entirely of fabric, designed for integration into robotics, automotive systems, and healthcare devices.
- In May 2025, Daimon Robotics introduced its high-resolution vision-based tactile sensor DM‑Tac W and the DM‑Hand1 robotic hand with embedded tactile fingertips during ICRA 2025 in Atlanta.
- In June 2025, TransDigm Group announced the acquisition of Simmonds Precision Products for $765 million to strengthen its position in aerospace sensor technologies.
Market Concentration & Characteristics
The Tactile Sensor Market exhibits moderate concentration with a mix of established players and emerging innovators competing on technology, customization, and application breadth. It is characterized by rapid innovation cycles, driven by advancements in AI, flexible electronics, and materials science. Key players focus on high-resolution, low-profile, and multi-modal sensors to address diverse use cases in robotics, healthcare, automotive, and consumer electronics. The market supports a high degree of product differentiation, with companies tailoring solutions to meet specific industry demands. Strategic partnerships with OEMs, research institutions, and automation firms play a critical role in maintaining competitive advantage. It sees strong investment in R&D, particularly in flexible and stretchable sensor platforms for wearables and soft robotics. Barriers to entry include high development costs, complexity in integration, and the need for precise calibration and compliance. The Tactile Sensor Market is steadily moving toward standardization and platform-based solutions to support broader adoption across interconnected systems.
Report Coverage
The research report offers an in-depth analysis based on Type, End-User and Region. It details leading market players, providing an overview of their business, product offerings, investments, revenue streams, and key applications. Additionally, the report includes insights into the competitive environment, SWOT analysis, current market trends, as well as the primary drivers and constraints. Furthermore, it discusses various factors that have driven market expansion in recent years. The report also explores market dynamics, regulatory scenarios, and technological advancements that are shaping the industry. It assesses the impact of external factors and global economic changes on market growth. Lastly, it provides strategic recommendations for new entrants and established companies to navigate the complexities of the market.
Future Outlook
- Demand for tactile sensors will increase across robotics and automation to improve machine interaction and responsiveness.
- Flexible and stretchable sensor technologies will see wider adoption in wearables, soft robotics, and smart textiles.
- Healthcare applications will expand, especially in prosthetics, minimally invasive surgery, and rehabilitation devices.
- Consumer electronics will integrate more tactile sensing features to enhance user experience and device interactivity.
- Automotive systems will adopt tactile sensors for in-cabin controls and autonomous vehicle safety functions.
- Advancements in AI and machine learning will improve sensor functionality, accuracy, and adaptability.
- Manufacturers will invest in miniaturized, high-resolution sensors for precise feedback in compact devices.
- Regional growth will remain strong in Asia Pacific due to electronics manufacturing and industrial automation.
- Strategic collaborations between tech firms and OEMs will support faster product development and deployment.
- Standardization efforts will help improve sensor compatibility, reduce costs, and support mass adoption.


