
Market Overview
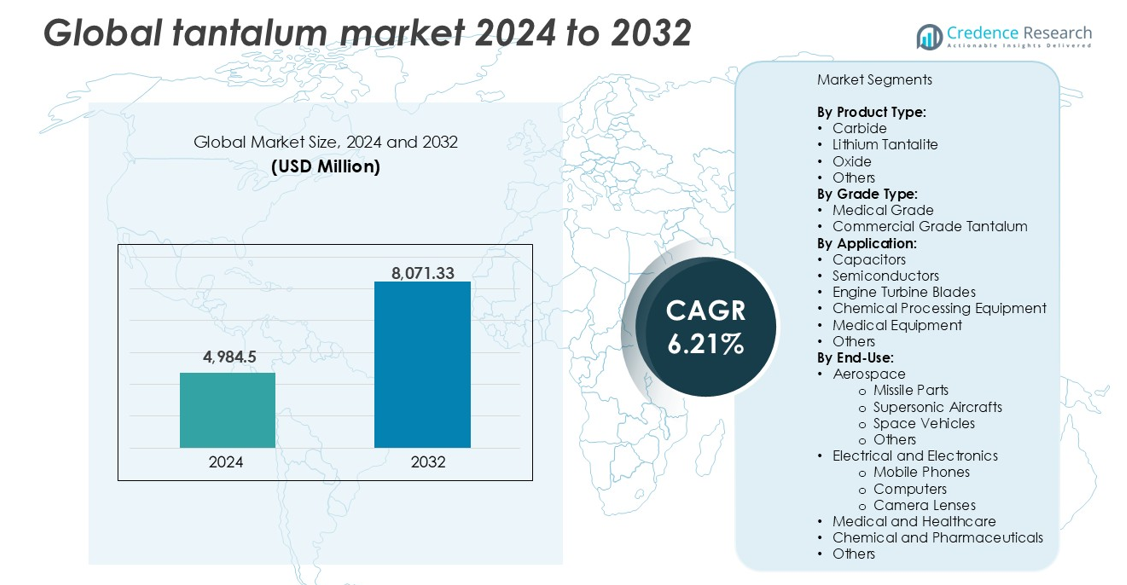
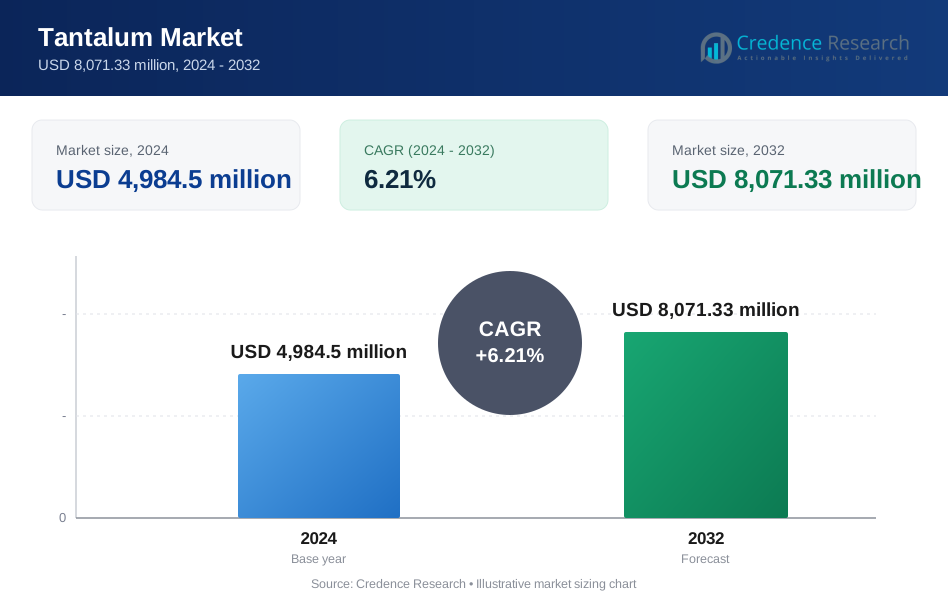
The global tantalum market size was valued at USD 4,984.5 million in 2024 and is anticipated to reach USD 8,071.33 million by 2032, at a CAGR of 6.21% during the forecast period.
| REPORT ATTRIBUTE | DETAILS |
|---|---|
| Historical Period | 2020-2023 |
| Base Year | 2024 |
| Forecast Period | 2025-2032 |
| Tantalum Market Size 2024 | USD 4,984.5 million |
| Tantalum Market, CAGR | 6.21% |
| Tantalum Market Size 2032 | USD 8,071.33 million |
The global tantalum market is led by key players such as Ningxia Orient Tantalum Industry Co. Ltd, Pilbara Minerals, Cabot Corp., China Minmetals Corporation, and Admat Inc. These companies dominate across mining, refining, and high-purity component manufacturing. Ningxia Orient and China Minmetals hold strong positions in Asia, while Pilbara Minerals anchors Australia's supply strength. Cabot Corp. and Admat Inc. lead downstream processing and alloy production in North America. Asia-Pacific emerged as the dominant regional market in 2024, accounting for 38% of global share, driven by electronics and semiconductor manufacturing in China, Japan, and South Korea. Strategic investments in recycling, ethical sourcing, and long-term contracts help top companies secure market stability and meet rising demand across end-use industries.
Market Insights
- The global tantalum market was valued at USD 4,984.5 million in 2024 and is projected to reach USD 8,071.33 million by 2032, growing at a CAGR of 6.21% during the forecast period.
- Rising demand from the electronics sector, especially for capacitors and semiconductors, is a key driver supporting long-term growth.
- A notable trend includes increased adoption of recycled tantalum and traceable sourcing to meet ESG goals and regulatory compliance.
- Asia-Pacific holds the largest regional share at 38%, followed by North America at 24% and Europe at 21%, while capacitors dominate the application segment with the highest market share.
- Supply instability from conflict regions and high processing costs continue to restrain market expansion despite growing end-user demand.
Market Segmentation Analysis:
By Product Type
Carbide dominates the global tantalum market by product type, accounting for the largest revenue share in 2024. Its widespread use in cutting tools, mining bits, and wear-resistant components drives strong demand. The metal's extreme hardness and thermal stability make carbide a preferred material in heavy industrial applications. Lithium tantalite follows due to its increasing use in lithium-tantalum ores for battery production. Oxide and other forms support chemical and alloy industries. Demand for durable materials in high-temperature environments continues to support growth across all product types.
- For instance, H.C. Starck Tungsten Powders (a Masan High-Tech Materials company) and TANIOBIS (formerly H.C. Starck Tantalum and Niobium) are leading global suppliers of refractory metal powders; while the former produces approximately 12,500 metric tons of tungsten products annually, they also provide specialized tantalum and niobium carbides used in concentrations of 2% to 8% to enhance the durability of cutting tools for aerospace and defense machining.
By Grade Type
Commercial grade tantalum held the dominant share in 2024 due to broad industrial usage across electronics, automotive, and aerospace. Its cost-effectiveness and adaptability in capacitors and structural parts support high-volume applications. Medical grade tantalum, while smaller in share, is growing steadily with rising adoption in implants, surgical tools, and prosthetics. Its excellent biocompatibility, non-reactivity, and corrosion resistance make it ideal for healthcare. Increased regulatory approval for tantalum-based medical devices also contributes to higher consumption of medical grade variants globally.
- For instance, KEMET (Yageo Group) manufactures over 1 billion tantalum capacitors annually for use in automotive ECUs, smartphones, and industrial power supplies.
By Application
Capacitors led the application segment with the highest market share in 2024, supported by demand from consumer electronics and defense industries. Tantalum capacitors offer superior performance, reliability, and miniaturization, making them critical in compact devices. Semiconductors and engine turbine blades follow closely, driven by aerospace and automotive sectors. Chemical processing equipment and medical equipment also contribute steadily due to the metal’s corrosion resistance. The growth of data centers, smartphones, and electric vehicles continues to reinforce demand for tantalum across applications.
Key Growth Drivers
Rising Demand from the Electronics Industry
Tantalum’s superior electrical conductivity, high capacitance, and reliability under extreme conditions make it essential for electronic components. Tantalum capacitors are widely used in smartphones, laptops, wearables, and automotive electronics. The rapid expansion of consumer electronics and rising production of compact, high-performance devices drive this demand. Tantalum-based components are favored for their stability in miniaturized circuits, supporting advanced hardware in 5G, AI, and IoT devices. Increasing investments in data centers, cloud infrastructure, and edge computing also support usage. The ongoing electrification of vehicles adds further pressure on tantalum supply chains. With growing consumer electronics output across Asia-Pacific and North America, this segment remains a significant contributor to the global tantalum market’s expansion.
- For instance, Samsung Electro-Mechanics specializes in conductive polymer tantalum capacitors for smartphones and network equipment, focusing on ultra-small form factors and high reliability.
Growth in Aerospace and Defense Applications
Tantalum’s high melting point, corrosion resistance, and strength-to-weight ratio support its use in advanced aerospace and defense systems. Jet engine turbine blades, missile parts, and supersonic aircraft often require tantalum-based alloys due to their thermal stability and durability under extreme stress. Rising defense budgets and space exploration projects across the U.S., China, India, and EU nations boost demand for high-performance materials. The global push for indigenizing defense manufacturing also strengthens the tantalum supply chain. As aircraft and spacecraft designs evolve toward lightweight, heat-resistant components, tantalum remains critical. Its role in electromagnetic shielding and radar systems further expands its defense relevance. These factors collectively reinforce aerospace and military sector adoption, making it a primary growth driver.
- For instance, ATI (Allegheny Technologies Inc.) supplies tantalum-based alloys for use in U.S. Department of Defense aerospace systems; while these alloys are critical for jet engine components operating at approximately 1,500°C, they are also utilized in specialized applications like missile nose cones and rocket nozzles where they can withstand environments exceeding 2,000°C.
Expanding Use in Medical Implants and Devices
Tantalum’s biocompatibility, non-toxic nature, and corrosion resistance support its adoption in medical implants such as bone plates, cranial repair meshes, dental fixtures, and prosthetics. Surgeons and device manufacturers value its ability to bond with human tissue without causing immune reactions. As orthopedic and cardiovascular surgeries increase globally, driven by aging populations and rising lifestyle diseases, the demand for durable and safe implant materials grows. Innovations in 3D printing of tantalum implants enhance custom patient care and surgical outcomes. The shift toward minimally invasive procedures and longer implant lifespans also supports tantalum’s use. Regulatory approvals in major healthcare markets further accelerate integration in medical devices. This medical-grade demand ensures a stable and expanding niche within the broader tantalum market.
Key Trends & Opportunities
Supply Chain Diversification and Ethical Sourcing
The tantalum market is seeing a shift toward more transparent and conflict-free sourcing. Traditional reliance on Central African mining regions has raised concerns around ethical practices and supply disruptions. Manufacturers now increasingly prioritize certified supply chains aligned with Responsible Minerals Initiatives. Australia, Brazil, and Canada are emerging as alternate producers with more stable and regulated mining operations. Recycled tantalum from used electronics is gaining traction as a sustainable source, supported by circular economy models. Companies are investing in traceability systems to meet ESG targets and regulatory mandates. This trend opens opportunities for responsible miners and recyclers to enter global supply chains and meet growing industrial demand while ensuring ethical compliance.
- For instance, Apple reported in 2023 that 100% of its tantalum suppliers were validated as conflict-free by third-party audits under the Responsible Minerals Assurance Process (RMAP).
Technological Advancements in Processing and Recycling
Innovations in tantalum refining and recovery techniques offer new growth avenues. Improved hydrometallurgical processes allow higher purity extraction from complex ores, reducing production costs and environmental risks. Advanced recycling technologies now enable recovery of tantalum from electronic waste with better efficiency. With rising e-waste volumes globally, especially from mobile devices and consumer electronics, urban mining becomes a viable supplement to primary mining. Companies investing in automated dismantling and chemical recovery systems gain a competitive edge. These advancements also help reduce dependence on geopolitically volatile sources. Over time, they are expected to stabilize supply, reduce raw material costs, and improve margins for component manufacturers.
Key Challenges
Supply Disruptions and Geopolitical Risk
The global tantalum supply chain is highly concentrated, with a significant share coming from politically unstable regions such as the Democratic Republic of the Congo (DRC) and Rwanda. These areas face periodic mining bans, civil conflicts, and international scrutiny over labor practices. Export disruptions or sanctions can severely impact downstream users reliant on steady tantalum inputs. Fluctuating ore availability and transport blockades also contribute to price volatility. With limited stockpiles and few large-scale alternatives, industries like electronics and defense remain vulnerable. Mitigating this challenge requires broader supplier diversification, increased recycling efforts, and long-term contracts with regulated producers to ensure consistent availability.
High Cost and Processing Complexity
Tantalum extraction and refinement involve complex, multi-stage chemical processes with high energy and infrastructure requirements. The metal’s occurrence in low concentrations and association with radioactive elements like uranium and thorium complicate safe processing. These factors lead to high production costs, often passed on to component manufacturers. Small-scale miners lack resources to adopt safer and more efficient technologies, limiting overall yield. The capital intensity of setting up processing plants discourages new entrants. This cost barrier is particularly significant for emerging economies and smaller electronics producers, limiting adoption. Unless more efficient and scalable technologies are developed, the high-cost structure will continue to restrict market growth.
Regional Analysis
North America
North America held a significant share of the global tantalum market in 2024, accounting for over 24% of global revenue. The region benefits from strong demand in aerospace, defense, and consumer electronics. The United States leads due to advanced manufacturing capabilities and high defense spending. Presence of key capacitor and semiconductor producers supports market growth. Regulatory push for conflict-free sourcing further strengthens ethical procurement channels. Canada contributes through stable tantalum mining and exploration activities. The increasing adoption of medical implants and next-generation electronics continues to drive steady regional demand.
Europe
Europe captured around 21% share of the global tantalum market in 2024. Germany, France, and the UK are key consumers, driven by automotive electronics, defense programs, and industrial applications. Aerospace-grade alloys and tantalum capacitors are in strong demand across aviation and telecom sectors. The EU’s strict regulations on conflict minerals accelerate regional adoption of traceable supply chains and recycled tantalum. Medical-grade tantalum use is also expanding in orthopedic and dental segments. Ongoing R&D and circular economy initiatives further support market growth across Western and Central Europe.
Asia-Pacific
Asia-Pacific dominated the global tantalum market with over 38% market share in 2024. China, Japan, South Korea, and Taiwan lead due to high electronics output and advanced semiconductor manufacturing. China remains a top processor and end-user of tantalum, while Japan drives demand for capacitors in automotive and consumer electronics. India’s growing aerospace and healthcare sectors also contribute to regional growth. The availability of low-cost manufacturing and rising investments in EVs and 5G infrastructure further boost tantalum demand. The region remains the core of global electronics production, ensuring long-term consumption.
Latin America
Latin America accounted for around 9% of the global tantalum market in 2024. Brazil plays a central role as a major tantalum ore producer, supplying global manufacturers. Regional demand is driven by emerging medical and electronics sectors, particularly in Mexico and Chile. Infrastructure development and increased investment in healthcare equipment support consumption. Export-oriented mining activities in Brazil and Colombia position the region as a key supplier in the global tantalum trade. Although local downstream usage remains limited, the region’s role in supply chain continuity is growing steadily.
Middle East & Africa (MEA)
MEA held approximately 8% market share in 2024, driven primarily by tantalum mining in Central Africa. Countries like Rwanda and the Democratic Republic of the Congo are major exporters, supplying raw ore to processors globally. However, political instability and ethical sourcing issues challenge long-term supply security. Demand within the Gulf states is rising due to investments in aerospace, defense, and healthcare. South Africa supports regional consumption through its electronics and mining equipment sectors. The region remains vital to the global tantalum supply chain despite regulatory and transparency concerns.
Market Segmentations:
By Product Type:
- Carbide
- Lithium Tantalite
- Oxide
- Others
By Grade Type:
- Medical Grade
- Commercial Grade Tantalum
By Application:
- Capacitors
- Semiconductors
- Engine Turbine Blades
- Chemical Processing Equipment
- Medical Equipment
- Others
By End-Use:
- Aerospace
- Missile Parts
- Supersonic Aircrafts
- Space Vehicles
- Others
- Electrical and Electronics
- Mobile Phones
- Computers
- Camera Lenses
- Medical and Healthcare
- Chemical and Pharmaceuticals
- Others
By Geography
- North America
- U.S.
- Canada
- Mexico
- Europe
- Germany
- France
- U.K.
- Italy
- Spain
- Rest of Europe
- Asia Pacific
- China
- Japan
- India
- South Korea
- South-east Asia
- Rest of Asia Pacific
- Latin America
- Brazil
- Argentina
- Rest of Latin America
- Middle East & Africa
- GCC Countries
- South Africa
- Rest of the Middle East and Africa
Competitive Landscape
The global tantalum market features a moderately consolidated competitive landscape, with a mix of mining firms, refiners, and component manufacturers operating across the value chain. Key players include Ningxia Orient Tantalum Industry Co. Ltd, Pilbara Minerals, Cabot Corp., and Admat Inc., each contributing to supply reliability and innovation. Companies focus on vertical integration, ethical sourcing, and advanced refining technologies to secure competitive advantage. With demand rising in electronics, aerospace, and medical sectors, market participants invest in capacity expansion and recycling capabilities. Chinese and Australian firms dominate upstream mining, while U.S.-based manufacturers lead in high-performance alloys and processed components. Strategic collaborations, long-term supply contracts, and compliance with conflict-free sourcing regulations are critical differentiators. Players such as China Minmetals Corporation and Tantalex Resources Corp. also emphasize geographic expansion and raw material security. Competitive pressure continues to grow as end-users demand consistent quality, traceability, and sustainability across applications ranging from semiconductors to medical implants.
Key Player Analysis
- Ningxia Orient Tantalum Industry Co. Ltd
- Pilbara Minerals
- Ultramet
- Cabot Corp.
- The USA Titanium Industry Inc.
- Tantalex Resources Corp.
- Mokawa Inc.
- Ultra Metal Minor Limited
- China Minmetals Corporation
- Talison Minerals Pvt. Ltd.
- High-Performance Alloys, Inc.
- Admat Inc.
- Teach Nuclear
- Advanced Materials Inc.
Recent Developments
- In January 2024, United States-based Tantalex Lithium Resources Corp. announced the successful production of the first batch of tin and tantalum concentrates from its TiTan alluvial plant. This initial batch includes 10 tons of high-grade, industrial, and fully traceable tin concentrates (SnO2), fully processed in Manono, ready for export. Additionally, 2.5 tons of tantalum concentrates (Ta2O5) have also been produced.
- In October 2023, United States-based Vishay Intertechnology, Inc. announced the launch of a new series of wet capacitors featuring hermetic glass-to-metal seals. Designed for avionics and aerospace applications, the STH electrolytic capacitors offer all the benefits of Vishay’s SuperTan® extended series, with enhanced reliability for improved military H-level shock and vibration capabilities, and increased thermal shock resistance up to 300 cycles.
Report Coverage
The research report offers an in-depth analysis based on Product Type, Grade Type, Application, End Use and Geography. It details leading market players, providing an overview of their business, product offerings, investments, revenue streams, and key applications. Additionally, the report includes insights into the competitive environment, SWOT analysis, current market trends, as well as the primary drivers and constraints. Furthermore, it discusses various factors that have driven market expansion in recent years. The report also explores market dynamics, regulatory scenarios, and technological advancements that are shaping the industry. It assesses the impact of external factors and global economic changes on market growth. Lastly, it provides strategic recommendations for new entrants and established companies to navigate the complexities of the market.
Future Outlook
- Demand for tantalum capacitors will rise with the growth of compact consumer electronics.
- Aerospace and defense applications will continue to drive high-performance alloy consumption.
- Medical implant use will expand due to aging populations and advanced surgical technologies.
- Recycling of tantalum from electronic waste will gain momentum to reduce raw material dependence.
- Supply chain diversification will improve as producers shift away from conflict-affected regions.
- Technological advances in refining will enhance purity levels and lower production costs.
- Asia-Pacific will remain the leading market due to strong electronics and semiconductor output.
- Regulatory focus on ethical sourcing will reshape global procurement strategies.
- Strategic partnerships and long-term contracts will grow between manufacturers and suppliers.
- Investment in new mining operations in stable regions will support long-term supply stability.
Request a Free Sample
Fill in your details and we'll send you a free sample report.
- Sample data tables & charts
- Research methodology
Need a Custom Version of This Report?
Tailor the scope, geography, or segments to your exact requirements.
- Custom geography or segment scope
- Direct access to our analyst team
Frequently Asked Questions
What is the current market size for Global Tantalum Market, and what is its projected size in 2032?
At what Compound Annual Growth Rate is the Global Tantalum Market projected to grow between 2024 and 2032?
What factors are driving the growth of the Global Tantalum Market?
What are the key segments within the Global Tantalum Market?
What are some challenges faced by the Global Tantalum Market?
Who are the major players in the Global Tantalum Market?
Which segment is leading the market share?
Table of Content
Chapter 1. Report Introduction
- 1.1 Report Description & Purpose
- 1.1.1 Report Title & Market Definition
- 1.1.2 Unique Selling Propositions (USP) & Key Differentiators
- 1.1.3 Value Proposition for Stakeholders
- 1.2 Research Objectives
- 1.2.1 Market Sizing Objectives (Volume & Revenue)
- 1.2.2 Segmentation Objectives
- 1.2.3 Competitive Intelligence Objectives
- 1.2.4 Forecast & Scenario Objectives
- 1.3 Report Scope
- 1.3.1 Tantalum Scope – Types & Subtypes Covered
- 1.3.2 Geographic Scope – Regions & Countries Covered
- 1.3.3 Historical Period, Base Year & Forecast Period (2024; forecast to 2032)
- 1.3.4 Inclusions & Exclusions
- 1.4 HS Code & Classification Framework
- 1.5 Currency, Units & Pricing Basis
- 1.6 Target Stakeholders
- 1.7 Limitations & Assumptions
Chapter 2. Executive Summary
- 2.1 Global Tantalum Market Snapshot
- 2.1.1 Market Size – Historical (2024) & Forecast (2024-2032) (2024: USD 4,984.5 million → 2032: USD 8,071.33 million)
- 2.1.2 Volume & Revenue – Global Totals
- 2.1.3 Key Market Highlights – Top Five Facts
- 2.2 Tantalum Market Segmentation Snapshot
- 2.2.1 Market Split by Region – 2024 vs. 2032
- 2.3 Competitive Snapshot
- 2.3.1 Top 10 Players by Revenue Share – 2024
- 2.3.2 Top 10 Players by Volume Share – 2024
- 2.3.3 Recent Strategic Developments (18-Month Summary)
- 2.4 Key Investment Highlights & Strategic Conclusions
Chapter 3. Tantalum Market Dynamics & Industry Analysis
- 3.1 Market Overview & Context
- 3.1.1 Tantalum Market Position in the Broader Automotive Value Chain
- 3.1.2 OEM vs. Replacement Market Dynamics
- 3.1.3 Market Maturity & Development Stage by Region
- 3.2 Tantalum Market Drivers
- 3.3 Tantalum Market Restraints & Challenges
- 3.4 Tantalum Market Opportunities
- 3.5 Porter's Five Forces Analysis
- 3.5.1 Threat of New Entrants
- 3.5.2 Bargaining Power of Suppliers
- 3.5.3 Bargaining Power of Buyers
- 3.5.4 Threat of Substitutes
- 3.5.5 Competitive Rivalry – Intensity Assessment
- 3.6 Tantalum Value Chain Analysis
- 3.6.1 Upstream – Raw Material/Input Suppliers
- 3.6.1.1 Raw Material/Input 1
- 3.6.1.2 Raw Material/Input 2
- 3.6.1.3 Raw Material/Input 3
- 3.6.2 Midstream – Production/Manufacturing/Service Delivery
- 3.6.2.1 Production/Process Overview
- 3.6.2.2 Key Facility Locations & Capacity by Manufacturer
- 3.6.3 Downstream – Distribution & End Consumer
- 3.6.3.1 Primary Channel – B2B/OEM
- 3.6.3.2 Secondary Channels – Dealer, Retail, Online, Direct
- 3.6.4 Value Chain Profitability Analysis
- 3.6.1 Upstream – Raw Material/Input Suppliers
- 3.7 PESTEL Analysis
- 3.7.1 Political Factors
- 3.7.2 Economic Factors
- 3.7.3 Social Factors
- 3.7.4 Technological Factors
- 3.7.5 Environmental Factors
- 3.7.6 Legal Factors
- 3.8 Tantalum Supply Chain Analysis
- 3.8.1 Raw Material/Input Supply Risk Assessment
- 3.8.2 Manufacturing Concentration Risk (Geographic Exposure)
- 3.8.3 Trade Disruption Impact Analysis
- 3.9 Regulatory & Policy Landscape
Note: The regulatory and policy landscape section covers regulations based on their applicability to the market, Tantalum category, geography, and scope of the study. Only regulatory frameworks with a material impact on operations, compliance, trade, sustainability, or market access are analyzed in detail.
Chapter 4. Key Investment Pockets & Opportunity Analysis
- 4.1 Tantalum Market Attractiveness Analysis
- 4.1.1 By Region – Investment Attractiveness Matrix (Volume × CAGR)
- 4.2 Absolute Revenue Growth Opportunity
- 4.2.1 By Region – Absolute USD Growth Through 2032
- 4.3 Incremental Volume Opportunity
- 4.3.1 By Region – Incremental Volume Through 2032
- 4.3.2 Segment – Incremental Volume
- 4.4 Emerging Submarket Opportunity Deep Dive (Subject to Applicability)
- 4.5 Emerging Market Opportunity Scorecards
- 4.5.1 United States
- 4.5.2 Europe
- 4.5.3 Asia
- 4.5.4 Middle East & Africa
Note: Emerging Market Opportunity Scorecards will be included based on relevance and strategic importance. Regions listed are indicative and may vary depending on data availability and market dynamics.
Chapter 5. Tantalum Import-Export Analysis & Trade Flows
- 5.1 Global Trade Overview
- 5.1.1 Global Export Value by Country (2024)
- 5.1.2 Global Export Volume by Country (2024)
- 5.1.3 Global Import Value by Country (2024)
- 5.1.4 Global Import Volume by Country (2024)
- 5.1.5 Net Trade Balance by Country (2024)
- 5.2 Export Analysis – Segment
- 5.2.1 Type 1 (HS Code)
- 5.2.2 Type 2 (HS Code)
- 5.2.3 Type 3 (HS Code)
- 5.2.4 Type 4 (HS Code)
- 5.2.5 Type 5 (HS Code)
- 5.3 Import Analysis – Segment
- 5.3.1 Type 1 (HS Code)
- 5.3.2 Type 2 (HS Code)
- 5.3.3 Type 3 (HS Code)
- 5.3.4 Type 4 (HS Code)
- 5.3.5 Type 5 (HS Code)
- 5.4 Average Unit Trade Prices
- 5.4.1 Average Export Price – Segment & Country
- 5.4.2 Average Import Price – Segment & Source Country
- 5.4.3 Price Trends (2024)
- 5.5 Key Trade Route Analysis
- 5.5.1 Trade Route 1
- 5.5.2 Trade Route 2
- 5.5.3 Trade Route 3
- 5.5.4 Trade Route 4
- 5.5.5 Trade Route 5
- 5.6 Trade Policy Impact Assessment
- 5.6.1 US Anti-Dumping & Section 301 Tariffs
- 5.6.2 EU Customs Union Impact
- 5.6.3 Major Free Trade Agreements
- 5.6.4 USMCA Rules of Origin
Note: Trade policy analysis will be included only where relevant to the Tantalum market.
Chapter 6. Competitive Landscape & Company Benchmarking
- 6.1 Tantalum Market Concentration & Structure
- 6.1.1 Herfindahl-Hirschman Index (HHI) – vs. 2024
- 6.1.2 Tier 1, Tier 2 & Tier 3 Market Structure
- 6.1.3 Global, Regional & Local Player Dynamics
- 6.2 Tantalum Market Share Analysis – 2024
- 6.2.1 Global Revenue Share by Company
- 6.2.2 Global Volume Share by Company
- 6.2.3 Regional Revenue Share
- 6.2.4 Market Share Evolution ( vs. 2024)
- 6.2.5 OEM Segment Share by Company
- 6.2.6 Replacement Segment Share by Company
- 6.3 Production/Delivery Capacity & Facility Analysis
- 6.3.1 Global Installed Capacity
- 6.3.2 Capacity Utilization Rates
- 6.3.3 Production/Output Volume
- 6.3.4 Facility Locations & Capacity Map
- 6.3.5 Planned Capacity Additions
- 6.4 Tantalum Competitive Benchmarking Matrix
- 6.4.1 Revenue, Volume, CAGR & Profitability Comparison
- 6.4.2 Channel Revenue Mix
- 6.4.3 Geographic Revenue Exposure
- 6.4.4 R&D Intensity
- 6.4.5 Sustainability Maturity
- 6.5 Strategic Developments in Tantalum (Last 24 Months)
- 6.5.1 Mergers, Acquisitions & Divestments
- 6.5.2 New Tantalum Launches
- 6.5.3 Facility Expansions
- 6.5.4 Strategic Alliances, Joint Ventures & Partnerships
- 6.5.5 Distribution Expansion & Market Entry
- 6.5.6 Sustainability & ESG Initiatives
- 6.6 Competitive Strategy Mapping
- 6.6.1 Leader, Challenger, Follower & Niche Classification
- 6.6.2 Pricing Strategy Comparison
- 6.6.3 Channel Strategy Matrix
Note: Strategic developments are included based on their materiality and the availability of reliable information.
Chapter 7. Global Tantalum Market – By Distribution Channel
- 7.1 Segment Overview
- 7.1.1 Volume & Revenue Split by Channel (2024 & 2032)
- 7.1.2 Channel Mix Evolution (2024-2032)
Chapter 8. Regional Market Analysis – Global Overview
- 8.1 Global Regional Overview
- 8.1.1 Regional Volume Share
- 8.1.2 Regional Revenue Share
- 8.1.3 Regional Volume by Region
- 8.1.4 Regional Revenue by Region
- 8.1.5 Regional Forecast Through 2032
- 8.2 Cross-Regional Segment Analysis
- 8.2.1 By Distribution Channel
- 8.2.2 By Brand/Price Tier
Chapter 9. North America Tantalum Market
- 9.1 United States
- 9.2 Canada
- 9.3 Mexico
Chapter 10. Europe Tantalum Market
- 10.1 Germany
- 10.2 France
- 10.3 Italy
- 10.4 United Kingdom
- 10.5 Spain
- 10.6 Poland
- 10.7 Russia
- 10.8 Netherlands
- 10.9 Belgium
- 10.10 Sweden
- 10.11 Denmark
- 10.12 Norway
- 10.13 Rest of Europe
Chapter 11. Asia Pacific Tantalum Market
- 11.1 China
- 11.2 India
- 11.3 Japan
- 11.4 South Korea
- 11.5 Thailand
- 11.6 Indonesia
- 11.7 Vietnam
- 11.8 Malaysia
- 11.9 Australia
- 11.10 Rest of Asia Pacific
Chapter 12. Latin America Tantalum Market
- 12.1 Brazil
- 12.2 Argentina
- 12.3 Colombia
- 12.4 Chile
- 12.5 Rest of Latin America
Chapter 13. Middle East Tantalum Market
- 13.1 Saudi Arabia
- 13.2 United Arab Emirates
- 13.3 Turkey
- 13.4 Israel
- 13.5 Iran
- 13.6 Rest of the Middle East
Chapter 14. Africa Tantalum Market
- 14.1 South Africa
- 14.2 Egypt
- 14.3 Nigeria
- 14.4 Morocco
- 14.5 Rest of Africa
Chapter 15. Tantalum Company Profiles
- 15.1 [Company 01]
- 15.1.1 Company Overview
- 15.1.2 Key Management Personnel
- 15.1.3 Products & Services Portfolio
- 15.1.4 Financial Performance
- 15.1.5 Key Market Focus & Geographic Presence
- 15.1.6 Recent Developments & Strategic Initiatives
Note: The company profile list is preliminary and may change based on research findings, market developments, data availability, and client requirements.
Chapter 16. Appendices
- Appendix A – List of Abbreviations & Acronyms
- Appendix B – Industry Classification Code Reference – Full Series
- Appendix C – Production & Capacity Data Tables
- Appendix D – End-Use & Demand Base Tables
- Appendix E – Consumption & Replacement Rate Assumptions
- Appendix F – ASP Reference Tables
- Appendix G – Manufacturing & Facility Database
- Appendix H – Import-Export Data Tables
- Appendix I – Regulatory Summary Tables
- Appendix J – Primary Research Participant List (Anonymized)
- Appendix K – Primary Research Questionnaire Framework
- Appendix L – Data Sources & Bibliography
- Appendix M – Market Size Divergence & Source Comparison
Chapter 17. Research Methodology
- 17.1 Research Framework & Philosophy
- 17.2 Secondary Research – Sources, Hierarchy & Data Extraction
- 17.3 Data Modeling – Bottom-Up & Top-Down Market Sizing
- 17.4 Primary Research – Stakeholder Framework, LOI & Sample Sizes
- 17.5 Forecast Methodology – Regression, Scenario & Sensitivity Analysis
- 17.6 Quality Control – Four-Layer Validation Framework
- 17.7 Limitations & Standard Assumptions
- 17.8 Disclaimer
