
Market Overview
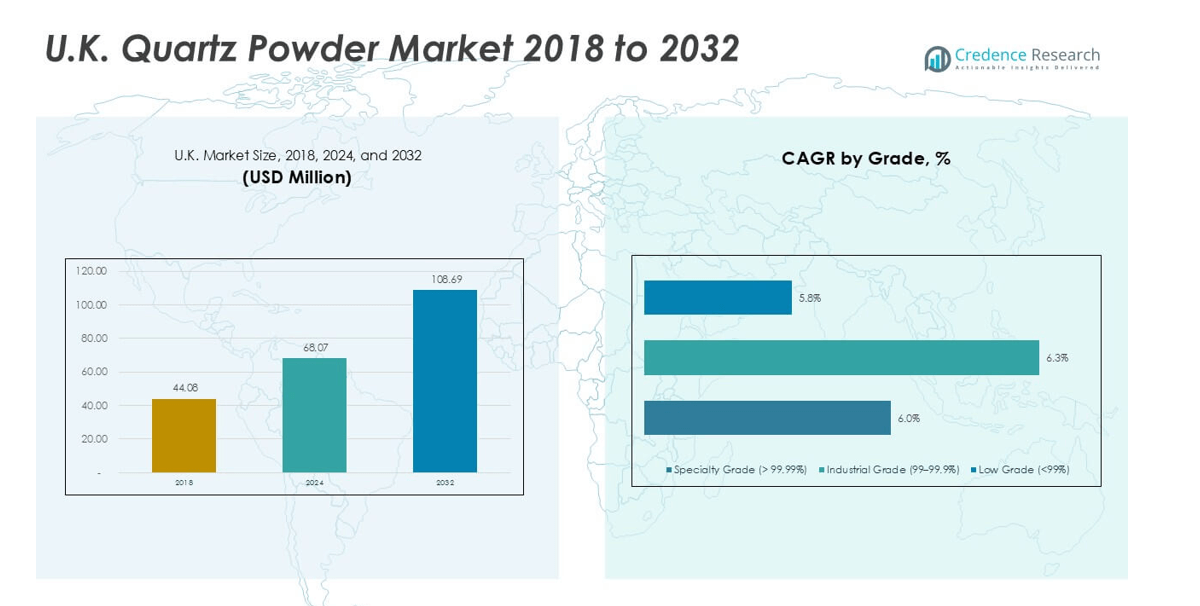
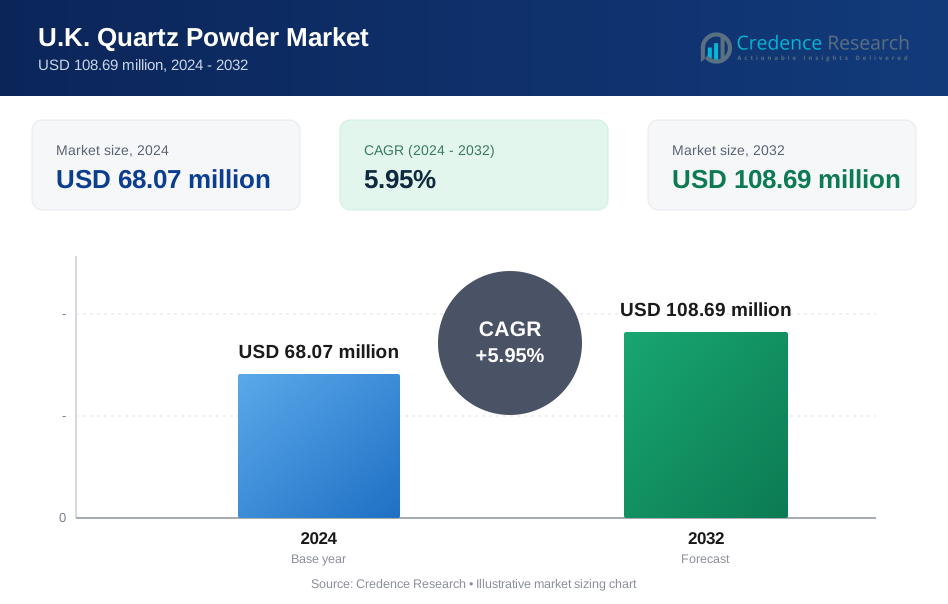
U.K. Quartz Powder market size was valued at USD 44.08 million in 2018, increased to USD 68.07 million in 2024, and is anticipated to reach USD 108.69 million by 2032, at a CAGR of 5.95% during the forecast period.
| REPORT ATTRIBUTE | DETAILS |
|---|---|
| Historical Period | 2020-2023 |
| Base Year | 2024 |
| Forecast Period | 2025-2032 |
| U.K. Quartz Powder Market Size 2024 | USD 68.07 million |
| U.K. Quartz Powder Market, CAGR | 5.95% |
| U.K. Quartz Powder Market Size 2032 | USD 108.69 million |
Leading players in the U.K. quartz powder market include Sibelco, Imerys, Quarzwerke Group, BritEx Enterprises, Advanced Ceramics, and Speciality Geochem, each competing through purity control, particle-size refinement, and strong supply networks. These firms serve electronics, glass, coatings, and construction users with specialty and industrial grades. England, including Greater London and the South East, stands as the dominant region with 55% market share due to its dense manufacturing base and strong semiconductor, glass, and coating industries. Scotland and Northern England follow, supported by ceramics, energy, and industrial applications. Established suppliers maintain their lead through capacity upgrades, quality improvements, and long-term customer contracts.
Market Insights
- The U.K. quartz powder market reached USD 68.07 million in 2024 and is set to hit USD 108.69 million by 2032, growing at a CAGR of 5.95% during the forecast period.
- Strong demand from electronics and semiconductor users drives high-purity grades, while construction, coatings, and ceramics sustain steady intake across industrial grades. Specialty grade holds the highest share at 52% due to strict purity needs.
- Trends include rising use of ultra-high-purity material, automation in processing, and expanded adoption in advanced optics, coatings, and composite materials.
- Competition involves Sibelco, Imerys, Quarzwerke Group, BritEx Enterprises, and regional processors that focus on purity control, stable supply, and refined particle sizing.
- England leads with 55% regional share, followed by Scotland & Northern England at 20%, Wales & West Midlands at 15%, and remaining regions holding 10%, reflecting varied industrial clusters and balanced demand across applications.
Market Segmentation Analysis:
By Grade
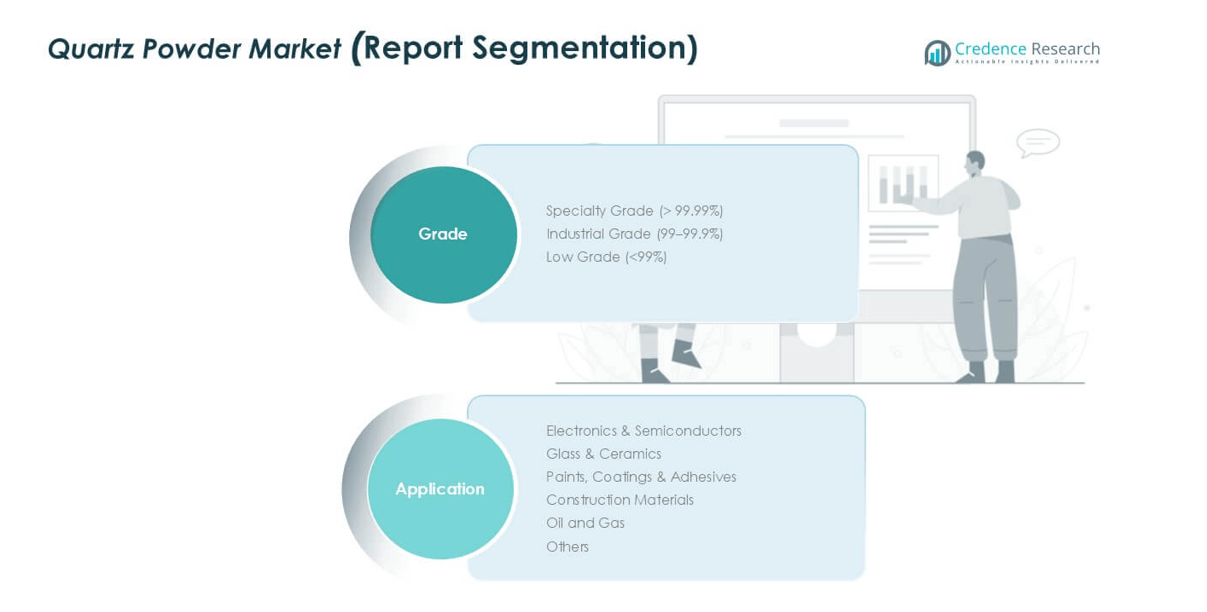
Specialty grade held the largest share with about 52% due to high-purity demand in electronics. Producers supply >99.99% purity material for quartzware, ensuring stable thermal behavior in advanced fabs. Industrial grade followed as a steady volume user across glass and ceramics operations. Low grade remained smaller because heavy impurities limit use in high-value chains. Growth strengthened as semiconductor lines expanded capacity and required strict impurity control. The specialty segment gained further traction as wafer makers increased ultra-pure quartz needs for diffusion tubes and crucibles.
- For instance, Heraeus Quarzglas supplies semiconductor-grade fused quartz with documented impurity levels below 1 ppm for metals such as Fe, Al, and Na, supporting diffusion tube and crucible production for 300 mm wafer fabrication
By Application
Electronics and semiconductors dominated the market with nearly 40% share due to strict purity needs. Fabricators used high-purity powder for wafers, lenses, and furnace parts supporting advanced node production. Glass and ceramics formed the next major area because manufacturers required consistent thermal stability. Paints and coatings adopted refined grades for improved surface strength. Construction materials used lower grades for fillers with cost advantages. Oil and gas applied quartz for drilling fluids and proppants. Demand climbed as chip producers raised process precision and purity thresholds.
- For instance, Momentive’s semiconductor-grade quartz materials used in 300 mm furnace systems have certified thermal expansion coefficients near 0.55×10⁻⁶/K, enabling stable operation in high-temperature LPCVD and oxidation steps
Key Growth Drivers
Rising Demand from Electronics and Semiconductor Production
Electronics growth drives strong use of high-purity quartz powder. Chip plants need stable and clean materials for wafer tools and lens parts. Quartz supports heat resistance during high-temperature steps. Producers in the U.K. see rising orders as design nodes shift to tighter rules. Many fabs increase intake to support new tools and cleaner chambers. Growth improves as device makers expand optical and sensor units. The semiconductor ecosystem depends on consistent purity, which pushes steady supply gains. This segment benefits from strong quality checks and tight control of trace metals. These needs keep demand on a long upward path.
- For instance, Heraeus Quarzglas supplies fused-quartz components for global fabs with documented metallic impurities below 1 ppm and hydroxyl (OH) concentrations under 10 ppm, enabling reliable use in diffusion tubes, oxidation chambers, and 300 mm wafer furnace assemblies.
Expansion in Glass, Ceramics, and Advanced Material Use
Glass makers use quartz powder to improve clarity, heat strength, and durability. Ceramics plants adopt refined grades to support clean sintering and stable shapes. These uses grow as firms push stronger and lighter designs. Advanced materials in optics and labware also rely on quartz purity. Builders of smart glass and heat-safe panels increase orders across U.K. supply lines. This broad use base makes demand resilient during sector swings. Many plants upgrade to higher grades due to better process results. These shifts support strong intake and widen long-term growth channels across major industries.
- For instance, SCHOTT manufactures high-purity quartz-based optical glasses such as its BOROFLOAT® substrates, which maintain thermal expansion around 3.25×10⁻⁶/K and withstand temperatures above 450 °C, supporting advanced labware and specialty glass production.
Rising Use in Paints, Coatings, Adhesives, and Construction
Paint and coating firms use quartz powder to boost hardness and wear strength. Adhesive makers add refined grades to improve bond life and surface grip. Construction plants use mid- and low-grade material as cost-effective filler for panels and mixes. Demand rises as building codes push stronger and more stable products. Many users shift to better grades to improve surface finish and longer service life. These gains help maintain steady growth during shifts in real estate cycles. Quartz also supports weather-safe coating lines. These factors reinforce broad intake in both industrial and commercial zones.
Key Trends & Opportunities
Growth of Ultra-High Purity Supply Chains
Ultra-pure quartz grades gain traction as fabs tighten impurity limits. U.K. suppliers invest in improved washing, sorting, and advanced screening lines. These upgrades help meet strict rules for metal and particle control. Strong demand from optics and high-end electronics creates clear room for capacity expansion. Many buyers want proven trace-level purity for new sensors and lens stacks. This shift opens space for premium pricing and long contracts. Firms with strong testing labs gain a key edge. The push for cleaner and smaller device parts makes this an active long-term opportunity.
- For instance, Sibelco’s high-purity quartz operations provide materials with documented Fe, Ti, and Al impurities each below 10 ppm and support advanced filtration and optical screening systems engineered to secure consistent contamination levels for semiconductor and specialty-glass producers.
Rising Role of Automation and Advanced Processing
Producers add automated sorting and fine-grinding units to raise yield and purity. These steps cut waste and improve batch consistency. Automation also helps track each lot and reduce human error. Many U.K. users want stable particle size for better flow and coating behavior. This demand encourages suppliers to buy new mills and optical sorters. The trend supports higher output with fewer defects. Advanced lines allow suppliers to reach higher grades and address key export needs. These gains also support entry into new areas like advanced optics and technical ceramics.
- For instance, TOMRA’s optical mineral-sorting platforms use high-resolution sensors operating at up to 5000 scans per second, enabling precise separation of quartz from unwanted fragments during automated processing for high-purity industrial material lines.
Expansion into High-Performance Industrial Uses
Oil and gas drilling and chemical plants seek quartz for strength and stability. These sites need strong filler materials that resist wear and heat. Quartz meets these needs and provides cost benefits. As complex wells grow, demand for stable proppant blends increases. Firms adopt refined grades to support fluid flow and better spacing. The sector creates new paths for higher-value products. Many users seek improved supply security and local support. These shifts open more space for U.K. suppliers to enter strong industrial networks.
Key Challenges
High Purity Requirements and Strict Quality Control Costs
Ultra-pure grades need tight control over trace elements and particle size. These steps raise production costs and slow scaling. Many suppliers must invest in new cleaning lines and advanced screens. These expenses limit quick expansion for smaller firms. End users also require long test cycles before approval. This slow pace creates entry barriers and delays supply to new sectors. Any batch error can lead to high loss due to strict acceptance rules. These factors restrict fast growth and pressure margins across the value chain.
Supply Instability and Raw Material Variability
Quartz deposits differ in impurity levels and crystal form. Firms must process each lot to meet tight grade rules. This adds strain on cost and yield. Weather shifts and mining rules also limit steady access. Many suppliers face delays when deposits change in quality. These swings make it hard to maintain constant purity. Firms need heavy testing and sorting to correct these gaps. End users prefer stable supply, so any variation can hurt contracts. This challenge affects scaling and long-term planning across the U.K. market.
Regional Analysis
England (Including Greater London & South East)
England held the largest share at about 55% due to strong industrial consumption. Electronics, glass, and coating plants in Greater London and the South East drove high-purity demand. Many semiconductor and optics users chose specialty grades for stable thermal behavior. Construction and paints firms added steady intake across wider regions. Supply chains benefited from strong port links and dense manufacturing clusters. Local producers expanded fine-grinding and screening lines to meet purity rules. Rising use in advanced materials kept the region in a clear lead. England maintained consistent growth through broad end-user diversity.
Scotland & Northern England
Scotland and Northern England captured nearly 20% of the market supported by glass, ceramics, and energy industries. Many users adopted industrial grades for kiln parts, refractory goods, and optical items. Electronics clusters in the north lifted demand for high-purity batches. The region gained strength from steady chemical and industrial coating projects. Oil and gas activity in Scotland added intake for drilling and support materials. Supply stability improved as processors upgraded particle control. This area showed balanced growth due to varied industrial bases. Manufacturing expansion kept demand on an upward trend.
Wales & West Midlands
Wales and the West Midlands held close to 15% market share driven by construction, coatings, and automotive materials. Many producers used mid-grade quartz to enhance strength in panels and mixes. Coating plants valued stable particle sizes for better finish and wear life. Local ceramics and components firms added further intake. Improved logistics links helped maintain consistent flow to factories. The region saw rising interest in refined grades due to process gains. Broader industrial upgrades supported continued demand. Growth stayed steady as users sought better performance and cost balance.
Northern Ireland, East Midlands & Other Regions
Northern Ireland, the East Midlands, and other areas together accounted for about 10% of the market. Demand came mainly from construction, paints, and industrial fillers. Smaller electronics and optical units used specialty batches for select tools and lenses. These regions relied on cost-effective grades with stable supply. Many firms improved operations by adopting controlled particle materials. Growth remained moderate but steady due to diverse small industries. Improved transport links supported broader distribution. Rising adoption in local composites and technical ceramics added new opportunities.
Market Segmentations:
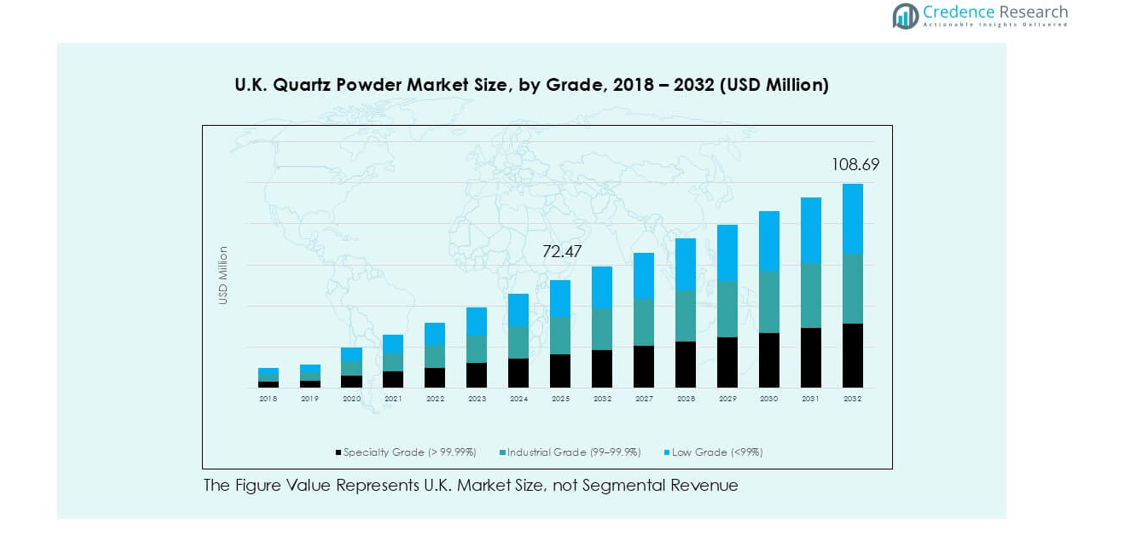
By Grade
- Specialty Grade (> 99.99%)
- Industrial Grade (99–99.9%)
- Low Grade (<99%)
By Application
- Electronics & Semiconductors
- Glass & Ceramics
- Paints, Coatings & Adhesives
- Construction Materials
- Oil and Gas
- Others
By Geography
- England (including Greater London & South East)
- Scotland & Northern England
- Wales & West Midlands
- Northern Ireland, East Midlands & Other Regions
Competitive Landscape
The U.K. quartz powder market features a mix of global mineral groups and regional processors that compete on purity levels, particle control, and supply stability. Leading firms such as Sibelco, Imerys, Quarzwerke Group, and BritEx Enterprises focus on specialty and industrial grades that meet strict requirements in electronics, glass, and coatings. Several domestic suppliers strengthen their edge through refined grinding, advanced screening, and impurity-control systems. Many players expand ties with semiconductor and optics users that demand consistent high-purity batches. Mid-sized companies support construction and paints segments with cost-effective grades. Competitive activity includes capacity upgrades, broader distribution links, and selective partnerships aimed at improving product quality and lead times. Firms also invest in cleaner processing lines to meet rising environmental expectations. The market remains moderately consolidated, with established players leveraging long-term contracts and diversified portfolios to maintain a strong position across major end-use sectors in the U.K.
Key Player Analysis
- BritEx Enterprises
- Eon Enterprises
- Advanced Ceramics
- Sibelco
- The Sharad Group
- Speciality Geochem
- Quarzwerke Group
- Imerys S.A.
- PAL Quartz
- HTMC Group
Recent Developments
- In 2024, Caesarstone introduced The Time Collection, which included ten new items, seven of which were new Porcelain colors and three Mineral Surfaces. These Mineral Surfaces represent a big step forward in surface design and are a testament to Caesarstone's latest innovation. Using its vast expertise and advanced technology, the company has developed surfaces that combine minerals like Feldspar and Quartz with recycled content to create surfaces that are better performing and better for the environment.
- In January 2023, Caesarstone Ltd. declared the launch of its line of multi-material surfaces, which includes porcelain and natural stone in addition to outdoor quartz.
- In December 2022, Kyocera Corporation announced its purpose to invest 1.3 trillion yen ($9.78 billion), or through March 2026, in novel chip component manufacturing and the evolution of other sectors of its capabilities.
Report Coverage
The research report offers an in-depth analysis based on Grade, Application and Geography. It details leading market players, providing an overview of their business, product offerings, investments, revenue streams, and key applications. Additionally, the report includes insights into the competitive environment, SWOT analysis, current market trends, as well as the primary drivers and constraints. Furthermore, it discusses various factors that have driven market expansion in recent years. The report also explores market dynamics, regulatory scenarios, and technological advancements that are shaping the industry. It assesses the impact of external factors and global economic changes on market growth. Lastly, it provides strategic recommendations for new entrants and established companies to navigate the complexities of the market.
Future Outlook
- Demand for high-purity quartz will rise as semiconductor and optics manufacturing expands.
- Producers will invest in advanced screening and purification systems to meet stricter purity limits.
- Automation in grinding and classification will improve batch stability and reduce waste.
- Adoption in advanced coatings and composite materials will grow across industrial sectors.
- Construction and infrastructure projects will continue to support steady use of mid-grade material.
- Supply chains will shift toward cleaner and energy-efficient processing methods.
- Regional players will strengthen partnerships with electronics and glass manufacturers.
- Imports and local sourcing will balance as users seek reliable long-term supply.
- Product customization will increase for optics, sensors, and high-performance ceramics.
- Competition will intensify as global mineral groups expand capacity and upgrade technology.
Request a Free Sample
Fill in your details and we'll send you a free sample report.
- Sample data tables & charts
- Research methodology
Need a Custom Version of This Report?
Tailor the scope, geography, or segments to your exact requirements.
- Custom geography or segment scope
- Direct access to our analyst team
Frequently Asked Questions
What is the current market size for the U.K. Quartz Powder market, and what is its projected size in 2032?
At what Compound Annual Growth Rate is the U.K. Quartz Powder market projected to grow between 2024 and 2032?
Which U.K. Quartz Powder market segment held the largest share in 2024?
What are the primary factors fueling the growth of the U.K. Quartz Powder market?
Who are the leading companies in the U.K. Quartz Powder market?
Table of Content
Chapter 1. Report Introduction
- 1.1 Report Description & Purpose
- 1.1.1 Report Title & Market Definition
- 1.1.2 Unique Selling Propositions (USP) & Key Differentiators
- 1.1.3 Value Proposition for Stakeholders
- 1.2 Research Objectives
- 1.2.1 Market Sizing Objectives (Volume & Revenue)
- 1.2.2 Segmentation Objectives
- 1.2.3 Competitive Intelligence Objectives
- 1.2.4 Forecast & Scenario Objectives
- 1.3 Report Scope
- 1.3.1 U.K. Quartz Powder Scope – Types & Subtypes Covered
- 1.3.2 Geographic Scope – Regions & Countries Covered
- 1.3.3 Historical Period, Base Year & Forecast Period (2024; forecast to 2032)
- 1.3.4 Inclusions & Exclusions
- 1.4 HS Code & Classification Framework
- 1.5 Currency, Units & Pricing Basis
- 1.6 Target Stakeholders
- 1.7 Limitations & Assumptions
Chapter 2. Executive Summary
- 2.1 Global U.K. Quartz Powder Market Snapshot
- 2.1.1 Market Size – Historical (2024) & Forecast (2024-2032) (2024: USD 68.07 million → 2032: USD 108.69 million)
- 2.1.2 Volume & Revenue – Global Totals
- 2.1.3 Key Market Highlights – Top Five Facts
- 2.2 U.K. Quartz Powder Market Segmentation Snapshot
- 2.2.1 Market Split by Region – 2024 vs. 2032
- 2.3 Competitive Snapshot
- 2.3.1 Top 10 Players by Revenue Share – 2024
- 2.3.2 Top 10 Players by Volume Share – 2024
- 2.3.3 Recent Strategic Developments (18-Month Summary)
- 2.4 Key Investment Highlights & Strategic Conclusions
Chapter 3. U.K. Quartz Powder Market Dynamics & Industry Analysis
- 3.1 Market Overview & Context
- 3.1.1 U.K. Quartz Powder Market Position in the Broader Automotive Value Chain
- 3.1.2 OEM vs. Replacement Market Dynamics
- 3.1.3 Market Maturity & Development Stage by Region
- 3.2 U.K. Quartz Powder Market Drivers
- 3.3 U.K. Quartz Powder Market Restraints & Challenges
- 3.4 U.K. Quartz Powder Market Opportunities
- 3.5 Porter's Five Forces Analysis
- 3.5.1 Threat of New Entrants
- 3.5.2 Bargaining Power of Suppliers
- 3.5.3 Bargaining Power of Buyers
- 3.5.4 Threat of Substitutes
- 3.5.5 Competitive Rivalry – Intensity Assessment
- 3.6 U.K. Quartz Powder Value Chain Analysis
- 3.6.1 Upstream – Raw Material/Input Suppliers
- 3.6.1.1 Raw Material/Input 1
- 3.6.1.2 Raw Material/Input 2
- 3.6.1.3 Raw Material/Input 3
- 3.6.2 Midstream – Production/Manufacturing/Service Delivery
- 3.6.2.1 Production/Process Overview
- 3.6.2.2 Key Facility Locations & Capacity by Manufacturer
- 3.6.3 Downstream – Distribution & End Consumer
- 3.6.3.1 Primary Channel – B2B/OEM
- 3.6.3.2 Secondary Channels – Dealer, Retail, Online, Direct
- 3.6.4 Value Chain Profitability Analysis
- 3.6.1 Upstream – Raw Material/Input Suppliers
- 3.7 PESTEL Analysis
- 3.7.1 Political Factors
- 3.7.2 Economic Factors
- 3.7.3 Social Factors
- 3.7.4 Technological Factors
- 3.7.5 Environmental Factors
- 3.7.6 Legal Factors
- 3.8 U.K. Quartz Powder Supply Chain Analysis
- 3.8.1 Raw Material/Input Supply Risk Assessment
- 3.8.2 Manufacturing Concentration Risk (Geographic Exposure)
- 3.8.3 Trade Disruption Impact Analysis
- 3.9 Regulatory & Policy Landscape
Note: The regulatory and policy landscape section covers regulations based on their applicability to the market, U.K. Quartz Powder category, geography, and scope of the study. Only regulatory frameworks with a material impact on operations, compliance, trade, sustainability, or market access are analyzed in detail.
Chapter 4. Key Investment Pockets & Opportunity Analysis
- 4.1 U.K. Quartz Powder Market Attractiveness Analysis
- 4.1.1 By Region – Investment Attractiveness Matrix (Volume × CAGR)
- 4.2 Absolute Revenue Growth Opportunity
- 4.2.1 By Region – Absolute USD Growth Through 2032
- 4.3 Incremental Volume Opportunity
- 4.3.1 By Region – Incremental Volume Through 2032
- 4.3.2 Segment – Incremental Volume
- 4.4 Emerging Submarket Opportunity Deep Dive (Subject to Applicability)
- 4.5 Emerging Market Opportunity Scorecards
- 4.5.1 United States
- 4.5.2 Europe
- 4.5.3 Asia
- 4.5.4 Middle East & Africa
Note: Emerging Market Opportunity Scorecards will be included based on relevance and strategic importance. Regions listed are indicative and may vary depending on data availability and market dynamics.
Chapter 5. U.K. Quartz Powder Import-Export Analysis & Trade Flows
- 5.1 Global Trade Overview
- 5.1.1 Global Export Value by Country (2024)
- 5.1.2 Global Export Volume by Country (2024)
- 5.1.3 Global Import Value by Country (2024)
- 5.1.4 Global Import Volume by Country (2024)
- 5.1.5 Net Trade Balance by Country (2024)
- 5.2 Export Analysis – Segment
- 5.2.1 Type 1 (HS Code)
- 5.2.2 Type 2 (HS Code)
- 5.2.3 Type 3 (HS Code)
- 5.2.4 Type 4 (HS Code)
- 5.2.5 Type 5 (HS Code)
- 5.3 Import Analysis – Segment
- 5.3.1 Type 1 (HS Code)
- 5.3.2 Type 2 (HS Code)
- 5.3.3 Type 3 (HS Code)
- 5.3.4 Type 4 (HS Code)
- 5.3.5 Type 5 (HS Code)
- 5.4 Average Unit Trade Prices
- 5.4.1 Average Export Price – Segment & Country
- 5.4.2 Average Import Price – Segment & Source Country
- 5.4.3 Price Trends (2024)
- 5.5 Key Trade Route Analysis
- 5.5.1 Trade Route 1
- 5.5.2 Trade Route 2
- 5.5.3 Trade Route 3
- 5.5.4 Trade Route 4
- 5.5.5 Trade Route 5
- 5.6 Trade Policy Impact Assessment
- 5.6.1 US Anti-Dumping & Section 301 Tariffs
- 5.6.2 EU Customs Union Impact
- 5.6.3 Major Free Trade Agreements
- 5.6.4 USMCA Rules of Origin
Note: Trade policy analysis will be included only where relevant to the U.K. Quartz Powder market.
Chapter 6. Competitive Landscape & Company Benchmarking
- 6.1 U.K. Quartz Powder Market Concentration & Structure
- 6.1.1 Herfindahl-Hirschman Index (HHI) – vs. 2024
- 6.1.2 Tier 1, Tier 2 & Tier 3 Market Structure
- 6.1.3 Global, Regional & Local Player Dynamics
- 6.2 U.K. Quartz Powder Market Share Analysis – 2024
- 6.2.1 Global Revenue Share by Company
- 6.2.2 Global Volume Share by Company
- 6.2.3 Regional Revenue Share
- 6.2.4 Market Share Evolution ( vs. 2024)
- 6.2.5 OEM Segment Share by Company
- 6.2.6 Replacement Segment Share by Company
- 6.3 Production/Delivery Capacity & Facility Analysis
- 6.3.1 Global Installed Capacity
- 6.3.2 Capacity Utilization Rates
- 6.3.3 Production/Output Volume
- 6.3.4 Facility Locations & Capacity Map
- 6.3.5 Planned Capacity Additions
- 6.4 U.K. Quartz Powder Competitive Benchmarking Matrix
- 6.4.1 Revenue, Volume, CAGR & Profitability Comparison
- 6.4.2 Channel Revenue Mix
- 6.4.3 Geographic Revenue Exposure
- 6.4.4 R&D Intensity
- 6.4.5 Sustainability Maturity
- 6.5 Strategic Developments in U.K. Quartz Powder (Last 24 Months)
- 6.5.1 Mergers, Acquisitions & Divestments
- 6.5.2 New U.K. Quartz Powder Launches
- 6.5.3 Facility Expansions
- 6.5.4 Strategic Alliances, Joint Ventures & Partnerships
- 6.5.5 Distribution Expansion & Market Entry
- 6.5.6 Sustainability & ESG Initiatives
- 6.6 Competitive Strategy Mapping
- 6.6.1 Leader, Challenger, Follower & Niche Classification
- 6.6.2 Pricing Strategy Comparison
- 6.6.3 Channel Strategy Matrix
Note: Strategic developments are included based on their materiality and the availability of reliable information.
Chapter 7. Global U.K. Quartz Powder Market – By Distribution Channel
- 7.1 Segment Overview
- 7.1.1 Volume & Revenue Split by Channel (2024 & 2032)
- 7.1.2 Channel Mix Evolution (2024-2032)
Chapter 8. Regional Market Analysis – Global Overview
- 8.1 Global Regional Overview
- 8.1.1 Regional Volume Share
- 8.1.2 Regional Revenue Share
- 8.1.3 Regional Volume by Region
- 8.1.4 Regional Revenue by Region
- 8.1.5 Regional Forecast Through 2032
- 8.2 Cross-Regional Segment Analysis
- 8.2.1 By Distribution Channel
- 8.2.2 By Brand/Price Tier
Chapter 9. North America U.K. Quartz Powder Market
- 9.1 United States
- 9.2 Canada
- 9.3 Mexico
Chapter 10. Europe U.K. Quartz Powder Market
- 10.1 Germany
- 10.2 France
- 10.3 Italy
- 10.4 United Kingdom
- 10.5 Spain
- 10.6 Poland
- 10.7 Russia
- 10.8 Netherlands
- 10.9 Belgium
- 10.10 Sweden
- 10.11 Denmark
- 10.12 Norway
- 10.13 Rest of Europe
Chapter 11. Asia Pacific U.K. Quartz Powder Market
- 11.1 China
- 11.2 India
- 11.3 Japan
- 11.4 South Korea
- 11.5 Thailand
- 11.6 Indonesia
- 11.7 Vietnam
- 11.8 Malaysia
- 11.9 Australia
- 11.10 Rest of Asia Pacific
Chapter 12. Latin America U.K. Quartz Powder Market
- 12.1 Brazil
- 12.2 Argentina
- 12.3 Colombia
- 12.4 Chile
- 12.5 Rest of Latin America
Chapter 13. Middle East U.K. Quartz Powder Market
- 13.1 Saudi Arabia
- 13.2 United Arab Emirates
- 13.3 Turkey
- 13.4 Israel
- 13.5 Iran
- 13.6 Rest of the Middle East
Chapter 14. Africa U.K. Quartz Powder Market
- 14.1 South Africa
- 14.2 Egypt
- 14.3 Nigeria
- 14.4 Morocco
- 14.5 Rest of Africa
Chapter 15. U.K. Quartz Powder Company Profiles
- 15.1 [Company 01]
- 15.1.1 Company Overview
- 15.1.2 Key Management Personnel
- 15.1.3 Products & Services Portfolio
- 15.1.4 Financial Performance
- 15.1.5 Key Market Focus & Geographic Presence
- 15.1.6 Recent Developments & Strategic Initiatives
Note: The company profile list is preliminary and may change based on research findings, market developments, data availability, and client requirements.
Chapter 16. Appendices
- Appendix A – List of Abbreviations & Acronyms
- Appendix B – Industry Classification Code Reference – Full Series
- Appendix C – Production & Capacity Data Tables
- Appendix D – End-Use & Demand Base Tables
- Appendix E – Consumption & Replacement Rate Assumptions
- Appendix F – ASP Reference Tables
- Appendix G – Manufacturing & Facility Database
- Appendix H – Import-Export Data Tables
- Appendix I – Regulatory Summary Tables
- Appendix J – Primary Research Participant List (Anonymized)
- Appendix K – Primary Research Questionnaire Framework
- Appendix L – Data Sources & Bibliography
- Appendix M – Market Size Divergence & Source Comparison
Chapter 17. Research Methodology
- 17.1 Research Framework & Philosophy
- 17.2 Secondary Research – Sources, Hierarchy & Data Extraction
- 17.3 Data Modeling – Bottom-Up & Top-Down Market Sizing
- 17.4 Primary Research – Stakeholder Framework, LOI & Sample Sizes
- 17.5 Forecast Methodology – Regression, Scenario & Sensitivity Analysis
- 17.6 Quality Control – Four-Layer Validation Framework
- 17.7 Limitations & Standard Assumptions
- 17.8 Disclaimer
