
Market Overview
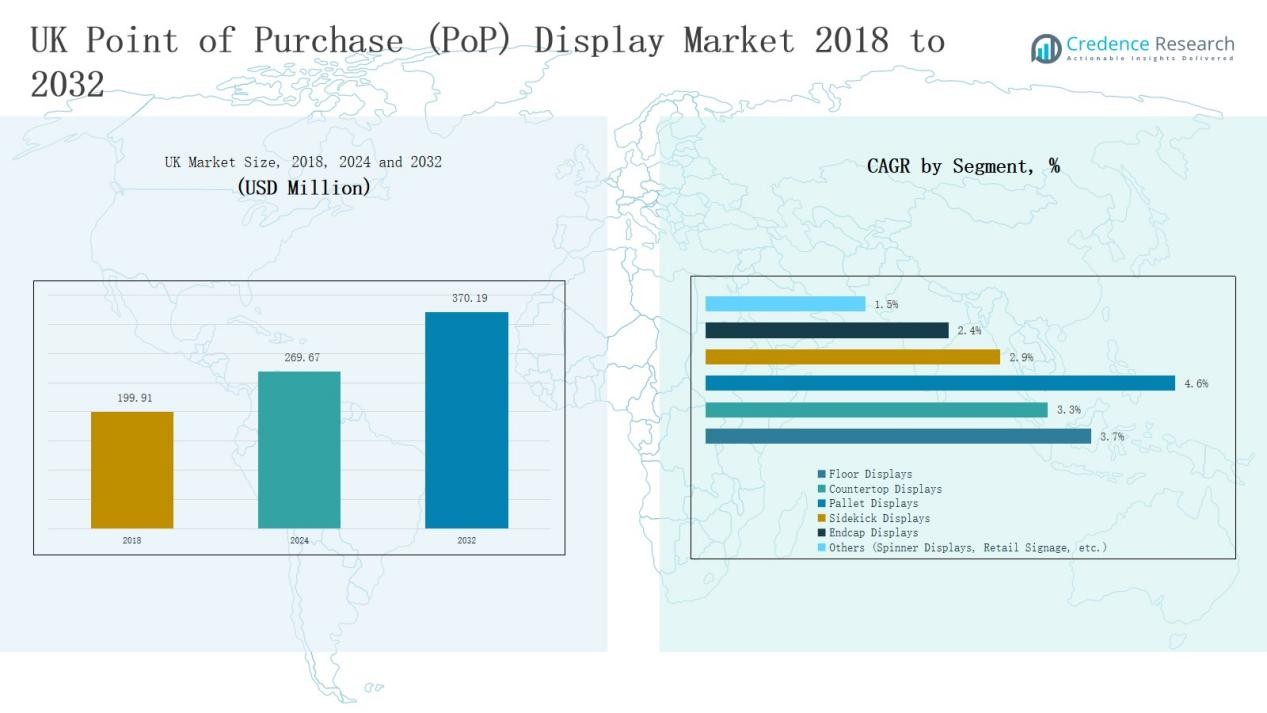
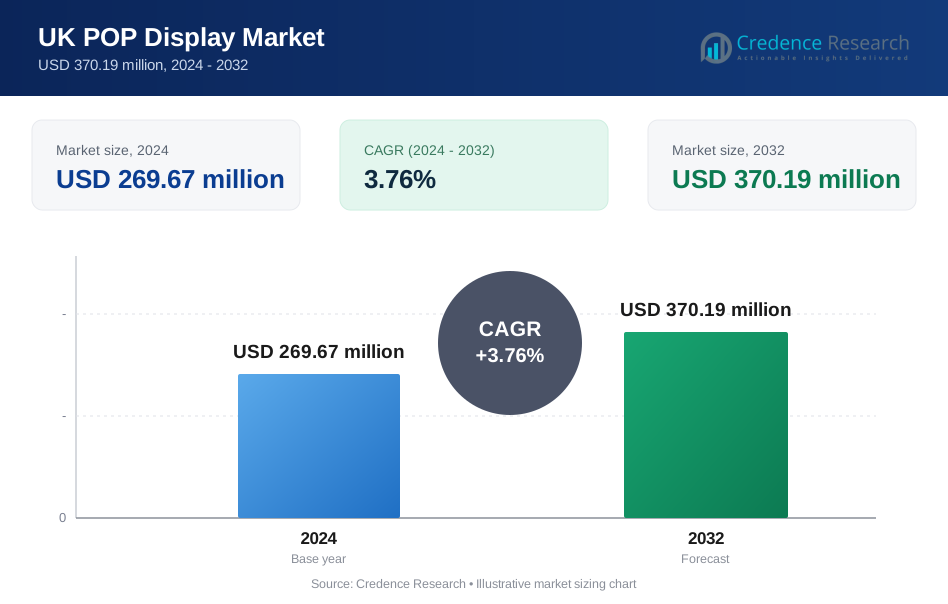
UK Point of Purchase (PoP) Display Market size was valued at USD 199.91 million in 2018 to USD 269.67 million in 2024 and is anticipated to reach USD 370.19 million by 2032, at a CAGR of 3.76% during the forecast period.
| REPORT ATTRIBUTE | DETAILS |
|---|---|
| Historical Period | 2020-2023 |
| Base Year | 2024 |
| Forecast Period | 2025-2032 |
| UK Point of Purchase (PoP) Display Market Size 2024 | USD 269.67 Million |
| UK Point of Purchase (PoP) Display Market, CAGR | 3.76% |
| UK Point of Purchase (PoP) Display Market Size 2032 | USD 370.19 Million |
The UK Point of Purchase (PoP) Display Market is driven by leading players such as POP Display UK Ltd, Service Graphics, shopPOPdisplays, Display Developments, UK POS, Mid-West Displays, T3 Systems, Image4, Unibox, and Display Wizard. These companies strengthen competitiveness through product innovation, sustainable material use, and tailored solutions across food, beverage, cosmetics, and electronics segments. Service Graphics and POP Display UK Ltd maintain strong national presence, while Unibox and Image4 focus on premium and modular systems for long-term retail partnerships. Regionally, England commanded the largest share at 58% in 2024, supported by its dense retail infrastructure, strong FMCG penetration, and higher consumer spending compared to Scotland, Wales, and Northern Ireland.
Market Insights
- The UK Point of Purchase (PoP) Display Market grew from USD 199.91 million in 2018 to USD 269.67 million in 2024 and is expected to reach USD 370.19 million by 2032, expanding at a CAGR of 3.76%.
- Floor displays led with 34% share in 2024, driven by supermarkets and hypermarkets, while countertop displays captured 22% share through impulse promotions near checkout zones.
- Food and beverage dominated with 38% share in 2024, supported by packaged food and beverage sales, followed by cosmetics and personal care at 21% and pharmaceuticals at 15%.
- Temporary displays held 61% share in 2024, favored for cost-effective seasonal promotions, while permanent displays retained 39% share through brand-focused investments in premium retail environments.
- England commanded 58% market share in 2024, followed by Scotland at 16%, Wales at 14%, and Northern Ireland at 12%, with strong demand led by food and FMCG products.
Market Segment Insights
By Type
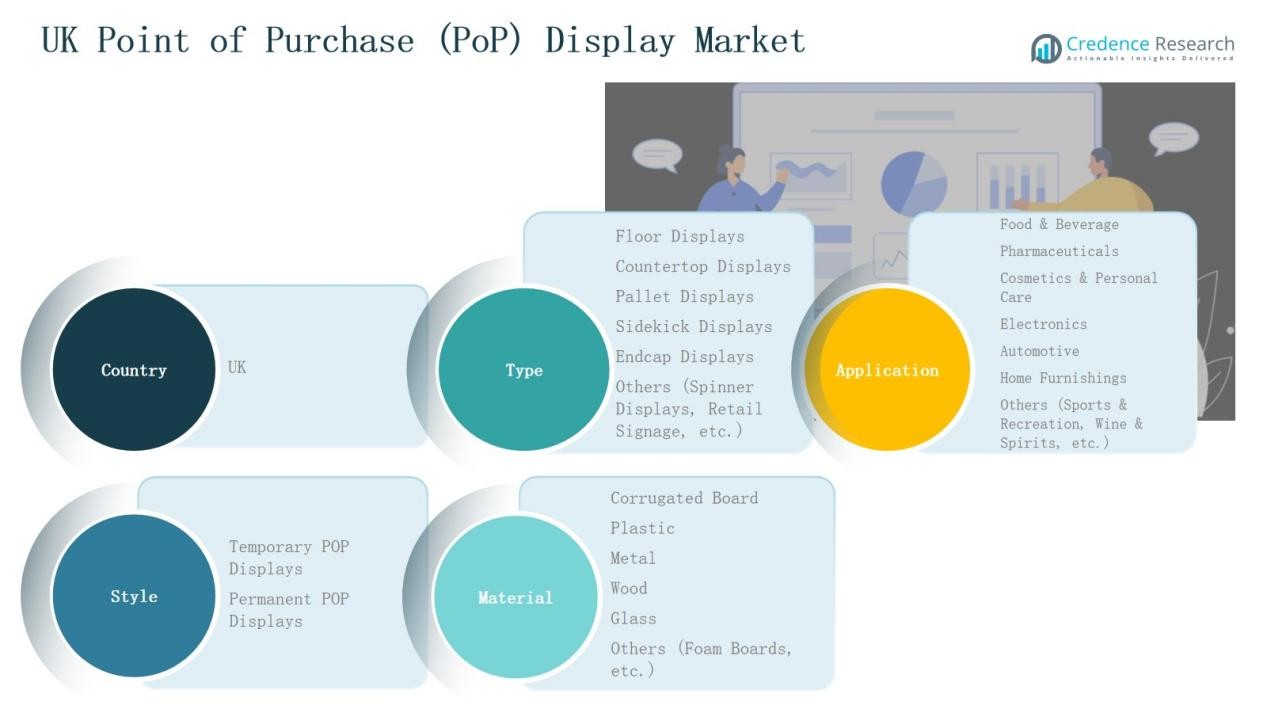
Floor displays accounted for the largest share of 34% in the UK Point of Purchase (PoP) Display Market in 2024. Their dominance is supported by wide usage across supermarkets, hypermarkets, and convenience stores to promote high-volume consumer goods. Countertop displays held 22% share, driven by impulse product promotions near checkout counters. Pallet displays captured 18% share, benefiting from bulk product visibility in retail warehouses. Sidekick and endcap displays together contributed 20%, highlighting their role in targeted promotions and seasonal campaigns. Other formats, including spinner displays and signage, held the remaining 6%.
- For instance, Costco UK used pallet displays for bulk Unilever household products, reinforcing warehouse‑style mass promotion strategies.
By Application
The food & beverage segment dominated with 38% share of the UK Point of Purchase (PoP) Display Market in 2024. Rising demand for ready-to-eat products, packaged foods, and beverages drove the use of floor and pallet displays in grocery and retail outlets. Cosmetics & personal care followed with 21% share, supported by high reliance on countertop and sidekick displays for impulse and premium products. Pharmaceuticals held 15% share, reflecting growing consumer awareness for OTC medicines and supplements. Electronics and automotive accounted for 13% and 7% respectively, while home furnishings stood at 4%. Other categories, including sports and wine displays, held 2%.
By Style
Temporary POP displays commanded 61% share in the UK Point of Purchase (PoP) Display Market in 2024. Their strong adoption is linked to cost-effectiveness, seasonal promotions, and flexible placement in retail environments. Retailers favor temporary displays for short-term campaigns and frequent product launches, particularly in the food and cosmetics segments. Permanent POP displays held 39% share, sustained by long-term brand visibility and higher durability. Premium retailers and electronics companies invest in permanent displays to enhance customer engagement and reinforce brand identity within stores.
- For instance, Samsung UK partnered with Currys to install permanent in-store display fixtures for its Galaxy AI smartphones, designed to provide interactive demonstrations and sustained visibility.
Key Growth Drivers
Rising Retail Expansion and Consumer Goods Demand
The UK Point of Purchase (PoP) Display Market benefits from rapid retail expansion and growing consumer goods demand. Supermarkets, hypermarkets, and convenience stores continue to increase shelf space, boosting demand for floor and pallet displays. High competition among FMCG brands also intensifies the use of customized displays to attract attention and drive impulse buying. Retail consolidation and store modernization further encourage adoption, with retailers prioritizing impactful product placements to maximize sales conversions. This dynamic strengthens PoP displays as critical in-store marketing tools.
Increased Brand Marketing Investments
Brands across food, beverage, cosmetics, and consumer electronics are investing heavily in in-store marketing strategies. PoP displays offer direct consumer engagement, helping brands achieve visibility during critical purchasing decisions. Temporary and countertop displays, in particular, align with frequent promotions, new product launches, and seasonal campaigns. With rising competition across categories, companies prioritize differentiated retail marketing formats. In-store branding budgets are increasingly directed toward innovative PoP solutions, supporting growth in both temporary and permanent display categories across the UK market.
- For instance, Samsung Electronics UK partnered with Currys to introduce modular end-cap PoP displays demonstrating its Galaxy Z Fold5, enabling hands-on product experience within high-footfall electronics stores.
Growing Influence of Consumer Behavior and Impulse Purchases
Impulse-driven purchases remain a key driver in the UK Point of Purchase (PoP) Display Market. Retailers leverage countertop and endcap displays to capture last-minute consumer decisions near checkout zones. Increasing consumer preference for attractive and accessible product placements fuels demand for innovative display designs. Eye-catching layouts, digital integration, and sustainable materials amplify engagement, leading to higher conversion rates. As shopping behaviors evolve toward convenience and instant gratification, PoP displays continue to serve as vital touchpoints shaping consumer buying journeys in physical retail stores.
- For instance, Smurfit Kappa launched its corrugated Shelf Facer solution in the UK, designed to boost impulse buying by pushing products to the front of retail shelves to improve accessibility and visibility.
Key Trends & Opportunities
Shift Toward Sustainable Display Materials
Sustainability has emerged as a significant trend shaping the UK PoP display market. Retailers and brands are transitioning to recyclable and eco-friendly materials such as corrugated board, cardboard composites, and biodegradable plastics. This transition aligns with government regulations and consumer expectations for environmentally responsible products. The opportunity lies in offering innovative, green alternatives without compromising durability and design appeal. Companies investing in sustainable materials strengthen their market position while meeting corporate social responsibility and retailer compliance requirements.
- For instance, DS Smith introduced its R8 innovation program in the UK, focusing on 100% recyclable corrugated cardboard PoP displays designed for circular reuse.
Integration of Digital and Interactive Technologies
The adoption of digital displays and interactive technologies offers new opportunities for market growth. Retailers are integrating QR codes, LED screens, and motion sensors into PoP displays to enhance customer engagement. These innovations create personalized experiences, provide real-time promotions, and improve brand recall. Electronics and premium cosmetics brands lead in adopting interactive displays, creating differentiated in-store marketing experiences. The opportunity for suppliers lies in combining physical display functionality with digital engagement, allowing retailers to maximize consumer influence at the point of purchase.
- For instance, Samsung Electronics introduced digital signage solutions with AI‑powered audience analytics, enabling retailers to trigger targeted promotions through interactive LED displays in shopping malls.
Key Challenges
High Competition from E-Commerce Channels
The expansion of e-commerce continues to challenge the UK Point of Purchase (PoP) Display Market. Online platforms provide convenience, wide product availability, and competitive pricing, reducing foot traffic in physical stores. As consumer shopping shifts online, retailers face difficulties in justifying large-scale investments in in-store displays. To counter this, PoP suppliers must innovate with hybrid approaches linking physical and digital experiences, ensuring stores maintain relevance. The competitive pressure from online channels remains a persistent hurdle for the market.
Rising Raw Material Costs and Supply Chain Disruptions
Volatility in raw material prices, particularly corrugated board, plastics, and metals, poses challenges for PoP display manufacturers. Fluctuations in energy and transportation costs further increase production expenses, squeezing profit margins. Supply chain disruptions, including delays and shortages, impact timely delivery of displays for seasonal campaigns. Retailers often demand cost-effective solutions, pressuring manufacturers to absorb rising costs or innovate with alternative materials. Managing pricing while maintaining quality and sustainability remains a complex challenge across the UK PoP display ecosystem.
Short Lifecycle of Temporary Displays
Temporary PoP displays, which dominate the market, have short lifecycles, creating challenges in terms of cost-efficiency and waste management. Frequent replacements for seasonal promotions or short campaigns increase operational costs for retailers and suppliers. Disposal concerns also arise as sustainability regulations tighten in the UK. While temporary displays offer flexibility, their limited durability and rapid turnover strain profitability. Manufacturers face growing pressure to design displays that balance low-cost efficiency with longer usability and environmental compliance requirements.
Regional Analysis
England
England accounted for 58% share of the UK Point of Purchase (PoP) Display Market in 2024. Strong retail infrastructure, including supermarkets, hypermarkets, and specialty stores, drives significant adoption of floor and pallet displays. London’s status as a commercial hub encourages brands to invest in innovative and premium displays for consumer engagement. The food and beverage segment leads in demand, supported by fast-moving consumer goods and seasonal promotions. Cosmetics and electronics sectors also expand display use in urban centers. England continues to set market standards due to concentrated retail activity and high consumer spending power.
Scotland
Scotland held 16% share of the UK Point of Purchase (PoP) Display Market in 2024. Growth in this region is supported by expanding supermarkets and retail chains, especially in cities such as Glasgow and Edinburgh. The market benefits from increasing demand for food, beverage, and pharmaceutical displays across convenience stores. Seasonal promotions, including festivals and tourism-driven retail activity, boost temporary display adoption. Retailers focus on countertop and sidekick displays to capture impulse purchases in high-traffic areas. Scotland’s market reflects steady adoption trends, supported by regional retail development and consumer demand shifts.
Wales
Wales represented 14% share of the UK Point of Purchase (PoP) Display Market in 2024. Retail growth in urban centers such as Cardiff and Swansea supports display adoption, particularly in the food and beverage category. Corrugated board and temporary displays dominate due to cost efficiency and alignment with short-term campaigns. Pharmaceuticals and personal care products also contribute to demand, with countertop displays gaining traction in smaller retail outlets. Rising focus on sustainable materials aligns with government policies and consumer preferences. Wales strengthens its market role by prioritizing flexible and eco-friendly display solutions.
Northern Ireland
Northern Ireland accounted for 12% share of the UK Point of Purchase (PoP) Display Market in 2024. Retail demand is concentrated in Belfast and surrounding areas, where supermarkets and specialty stores invest in PoP displays. Food and beverage remains the leading segment, supported by increasing reliance on floor and endcap displays. Cross-border retail activity with Ireland influences display adoption, particularly in wholesale and discount outlets. Retailers emphasize durable and low-cost formats to maintain competitiveness. Northern Ireland contributes steadily to overall growth, reflecting its role as a strategic regional market within the UK.
Market Segmentations:
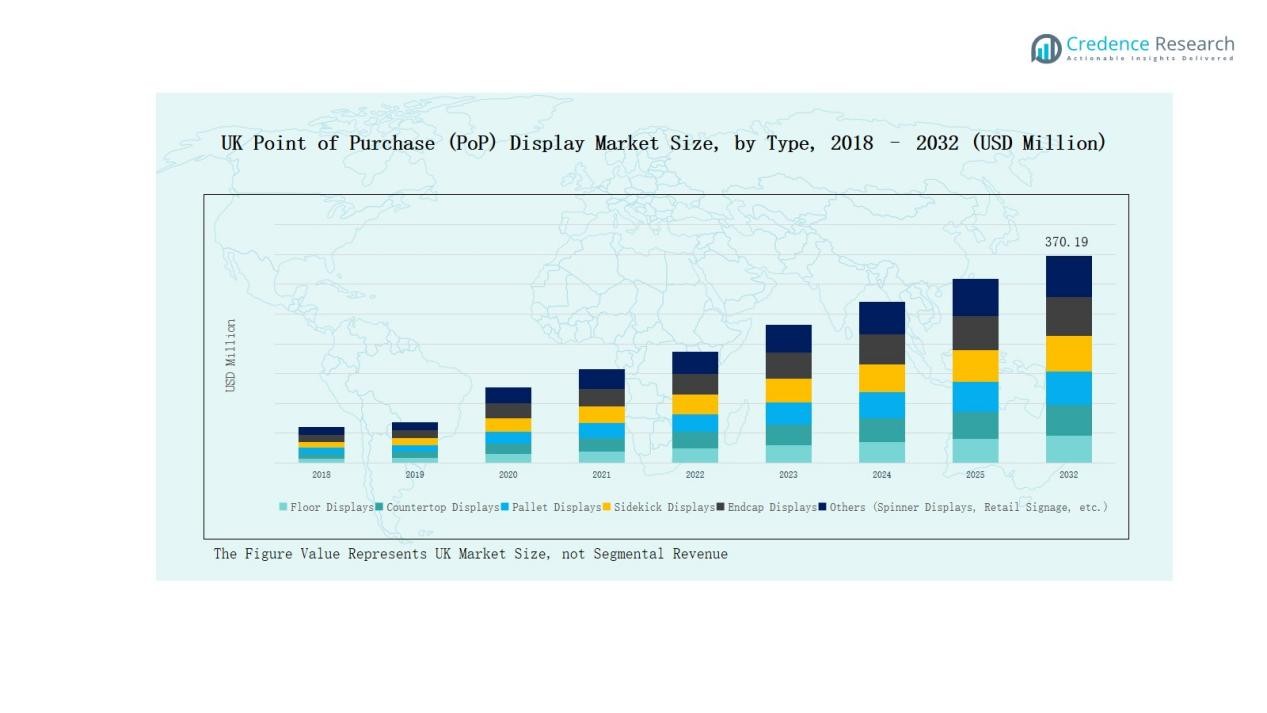
By Type
- Floor Displays
- Countertop Displays
- Pallet Displays
- Sidekick Displays
- Endcap Displays
- Others (Spinner Displays, Retail Signage, etc.)
By Application
- Food & Beverage
- Pharmaceuticals
- Cosmetics & Personal Care
- Electronics
- Automotive
- Home Furnishings
- Others (Sports & Recreation, Wine & Spirits, etc.)
By Style
- Temporary POP Displays
- Permanent POP Displays
By Material
- Corrugated Board
- Plastic
- Metal
- Wood
- Glass
- Others (Foam Boards, etc.)
By Region
- England
- Scotland
- Wales
- Northern Ireland
Competitive Landscape
The UK Point of Purchase (PoP) Display Market is characterized by strong competition among established manufacturers, specialized service providers, and retail-focused design firms. Key players such as POP Display UK Ltd, Service Graphics, shopPOPdisplays, Display Developments, and UK POS dominate the market through broad product portfolios and nationwide service networks. These companies focus on innovation, customization, and sustainability to meet diverse client requirements across food, beverage, cosmetics, and electronics segments. Mid-sized firms including Mid-West Displays, T3 Systems, and Display Wizard enhance market competitiveness by offering flexible solutions tailored for small and mid-scale retailers. Unibox and Image4 strengthen their position through premium and modular display systems, targeting long-term partnerships with leading retail brands. Intense competition drives continuous innovation in material use, particularly recyclable corrugated board and eco-friendly plastics. The market reflects a balance of cost-driven solutions for temporary displays and premium, durable designs for permanent installations, supporting both short-term campaigns and long-term brand visibility.
Key Players
- POP Display UK Ltd
- Service Graphics
- shopPOPdisplays
- Display Developments
- UK POS
- Mid-West Displays
- T3 Systems
- Image4
- Unibox
- Display Wizard
Recent Developments
- In September 2024, L'Occitane Travel Retail launched a Sol de Janeiro pop-up display at London Heathrow Airport as part of its summer campaign, featuring immersive and tropical-themed PoP activations.
- In June 2025, POP Display launched a new heat-bent POS display service made from recycled RPET (recycled PET), reinforcing its commitment to eco-friendly production practices.
- In 2024, Service Graphics installed advanced printing and finishing equipment at its Edinburgh branch through a technology partnership with Konica Minolta, boosting its regional production efficiency.
Report Coverage
The research report offers an in-depth analysis based on Type, Application, Style, Material and Region. It details leading market players, providing an overview of their business, product offerings, investments, revenue streams, and key applications. Additionally, the report includes insights into the competitive environment, SWOT analysis, current market trends, as well as the primary drivers and constraints. Furthermore, it discusses various factors that have driven market expansion in recent years. The report also explores market dynamics, regulatory scenarios, and technological advancements that are shaping the industry. It assesses the impact of external factors and global economic changes on market growth. Lastly, it provides strategic recommendations for new entrants and established companies to navigate the complexities of the market.
Future Outlook
- Retailers will increase adoption of sustainable display materials to meet environmental regulations.
- Demand for temporary displays will rise with seasonal campaigns and frequent product launches.
- Permanent displays will gain traction in premium retail and electronics segments for brand visibility.
- Digital and interactive technologies will enhance customer engagement at in-store touchpoints.
- Food and beverage will remain the dominant application segment, driving continuous display demand.
- Cosmetics and personal care displays will expand with growing consumer focus on lifestyle products.
- Countertop and endcap displays will see higher usage to capture impulse-driven purchases.
- Supply chain partnerships will strengthen to ensure timely delivery of customized displays.
- Small and mid-sized retailers will adopt cost-efficient corrugated and cardboard display formats.
- Investments in modular and recyclable designs will shape the long-term competitiveness of market players.
Request a Free Sample
Fill in your details and we'll send you a free sample report.
- Sample data tables & charts
- Research methodology
Need a Custom Version of This Report?
Tailor the scope, geography, or segments to your exact requirements.
- Custom geography or segment scope
- Direct access to our analyst team
Frequently Asked Questions
What is the current market size for UK Point of Purchase (PoP) Display Market, and what is its projected size in 2032?
At what Compound Annual Growth Rate is the UK Point of Purchase (PoP) Display Market projected to grow between 2025 and 2032?
Which UK Point of Purchase (PoP) Display Market segment held the largest share in 2024?
What are the primary factors fueling the growth of the UK Point of Purchase (PoP) Display Market?
Who are the leading companies in the UK Point of Purchase (PoP) Display Market?
Table of Content
Chapter 1. Report Introduction
- 1.1 Report Description & Purpose
- 1.1.1 Report Title & Market Definition
- 1.1.2 Unique Selling Propositions (USP) & Key Differentiators
- 1.1.3 Value Proposition for Stakeholders
- 1.2 Research Objectives
- 1.2.1 Market Sizing Objectives (Volume & Revenue) (Volume Where Applicable)
- 1.2.2 Segmentation Objectives
- 1.2.3 Competitive Intelligence Objectives
- 1.2.4 Forecast & Scenario Objectives
- 1.3 Report Scope
- 1.3.1 UK POP Display Scope – Segments & Subsegments Covered
- 1.3.2 Geographic Scope – Selected Country & Subnational Markets Covered
- 1.3.3 Historical Period, Base Year & Forecast Period (2024; forecast to 2032)
- 1.3.4 Inclusions & Exclusions
- 1.4 Industry Classification & Applicable Codes
- 1.5 Currency, Measurement Units & Valuation Basis
- 1.6 Target Stakeholders
- 1.7 Limitations & Assumptions
Chapter 2. Executive Summary
- 2.1 UK POP Display Snapshot
- 2.1.1 Market Size – Historical (2024) & Forecast (2024-2032) (2024: USD 269.67 million → 2032: USD 370.19 million)
- 2.1.2 Volume & Revenue – National Totals (Volume Where Applicable)
- 2.1.3 Key Market Highlights – Top Five Facts
- 2.2 UK POP Display Segmentation Snapshot
- 2.2.1 Market Split by Subnational Area – 2024 vs. 2032
- 2.3 Competitive Snapshot
- 2.3.1 Top 10 Players by Revenue Share – 2024
- 2.3.2 Top 10 Players by Volume Share – 2024 (Volume Where Applicable)
- 2.3.3 Recent Strategic Developments (18-Month Summary)
- 2.4 Key Investment Highlights & Strategic Conclusions
Chapter 3. UK POP Display Dynamics & Industry Analysis
- 3.1 Market Overview & Context
- 3.1.1 UK POP Display Position in the Broader Industry Value Chain
- 3.1.2 Demand Structure & Purchasing Dynamics
- 3.1.3 Market Maturity & Development Stage Across Domestic Markets
- 3.2 UK POP Display Drivers
- 3.3 UK POP Display Restraints & Challenges
- 3.4 UK POP Display Opportunities
- 3.5 Porter's Five Forces Analysis
- 3.5.1 Threat of New Entrants
- 3.5.2 Bargaining Power of Suppliers
- 3.5.3 Bargaining Power of Buyers
- 3.5.4 Threat of Substitutes
- 3.5.5 Competitive Rivalry – Intensity Assessment
- 3.6 UK POP Display Value Chain Analysis
- 3.6.1 Upstream – Key Inputs, Resources & Suppliers
- 3.6.1.1 Key Input/Resource 1
- 3.6.1.2 Key Input/Resource 2
- 3.6.1.3 Key Input/Resource 3
- 3.6.2 Midstream – Core Operations & Value Creation
- 3.6.2.1 Operating Model & Process Overview
- 3.6.2.2 Key Operating Locations & Capabilities by Company
- 3.6.3 Downstream – Market Channels & End Users
- 3.6.3.1 Direct Sales & Customer Engagement Channels
- 3.6.3.2 Indirect Sales, Intermediaries & Partner Channels
- 3.6.4 Value Chain Profitability Analysis
- 3.6.1 Upstream – Key Inputs, Resources & Suppliers
- 3.7 PESTEL Analysis
- 3.7.1 Political Factors
- 3.7.2 Economic Factors
- 3.7.3 Social Factors
- 3.7.4 Technological Factors
- 3.7.5 Environmental Factors
- 3.7.6 Legal Factors
- 3.8 UK POP Display Supply Chain Analysis
- 3.8.1 Critical Input & Resource Availability Risk Assessment
- 3.8.2 Supplier & Operational Concentration Risk (Geographic Exposure)
- 3.8.3 Supply & Service Disruption Impact Analysis
- 3.9 National & Subnational Regulatory Landscape
Note: The regulatory and policy landscape section covers regulations based on their applicability to the market, UK POP Display category, geography, and scope of the study. Only regulatory frameworks with a material impact on operations, compliance, trade, sustainability, or market access are analyzed in detail.
Chapter 4. Key Investment Pockets & Opportunity Analysis
- 4.1 UK POP Display Attractiveness Analysis
- 4.1.1 By Subnational Area – Investment Attractiveness Matrix (Market Size × CAGR)
- 4.2 Absolute Revenue Growth Opportunity
- 4.2.1 By Subnational Area – Absolute Revenue Growth Through 2032
- 4.3 Incremental Demand Opportunity
- 4.3.1 By Subnational Area – Incremental Demand Through 2032
- 4.3.2 Segment – Incremental Demand
- 4.4 Emerging Submarket Opportunity Deep Dive (Subject to Applicability)
- 4.5 Priority Domestic Market Opportunity Scorecards
- 4.5.1 Priority Domestic Market 1
- 4.5.2 Priority Domestic Market 2
- 4.5.3 Priority Domestic Market 3
- 4.5.4 Priority Domestic Market 4
Note: Domestic market scorecards cover relevant states, provinces, territories, cities, or economic zones within the selected country. Numbered entries are populated with market names suited to the national administrative structure and research scope. Geographic share tables use one consistent, nonoverlapping set of areas.
Chapter 5. UK POP Display Cross-Border Trade & Market Access Analysis
- 5.1 National Trade & International Partner Overview
- 5.1.1 Export Value by Destination Country (2024)
- 5.1.2 Export Volume by Destination Country (2024) (Where Applicable)
- 5.1.3 Import Value by Source Country (2024)
- 5.1.4 Import Volume by Source Country (2024) (Where Applicable)
- 5.1.5 National & Partner-Country Trade Balances (2024)
- 5.2 Export Analysis – Segment
- 5.2.1 Category 1 (Applicable Classification Code)
- 5.2.2 Category 2 (Applicable Classification Code)
- 5.2.3 Category 3 (Applicable Classification Code)
- 5.2.4 Category 4 (Applicable Classification Code)
- 5.2.5 Category 5 (Applicable Classification Code)
- 5.3 Import Analysis – Segment
- 5.3.1 Category 1 (Applicable Classification Code)
- 5.3.2 Category 2 (Applicable Classification Code)
- 5.3.3 Category 3 (Applicable Classification Code)
- 5.3.4 Category 4 (Applicable Classification Code)
- 5.3.5 Category 5 (Applicable Classification Code)
- 5.4 Cross-Border Pricing & Transaction Benchmarks
- 5.4.1 Export Pricing – Segment & Destination Country
- 5.4.2 Import Pricing – Segment & Source Country
- 5.4.3 Price Trends (2024)
- 5.5 Key Cross-Border Trade & Delivery Routes
- 5.5.1 Cross-Border Trade/Delivery Route 1
- 5.5.2 Cross-Border Trade/Delivery Route 2
- 5.5.3 Cross-Border Trade/Delivery Route 3
- 5.5.4 Cross-Border Trade/Delivery Route 4
- 5.5.5 Cross-Border Trade/Delivery Route 5
- 5.6 Trade Policy & Market Access Impact Assessment
- 5.6.1 Tariff & Non-Tariff Barriers
- 5.6.2 National Participation in Regional Trade & Economic Frameworks
- 5.6.3 Bilateral & Multilateral Trade Agreements
- 5.6.4 Cross-Border Operating, Licensing & Localization Requirements
Note: This chapter covers international trade relevant to UK POP Display in the selected country. Exports are analyzed by destination and imports by source. Domestic interregional flows are excluded from international trade totals. Goods, services, and digital offerings use applicable classifications; volume and route analyses apply only where meaningful.
Chapter 6. Competitive Landscape & Company Benchmarking
- 6.1 UK POP Display Concentration & Structure
- 6.1.1 Herfindahl-Hirschman Index (HHI) – vs. 2024
- 6.1.2 Leading, Mid-Sized & Emerging Player Structure
- 6.1.3 Multinational, National & Local Player Dynamics
- 6.2 UK POP Display Share Analysis – 2024
- 6.2.1 National Revenue Share by Company
- 6.2.2 National Volume Share by Company (Volume Where Applicable)
- 6.2.3 Company Revenue Share by Subnational Area
- 6.2.4 Market Share Evolution ( vs. 2024)
- 6.2.5 Company Market Share by Key Segment
- 6.2.6 Company Market Share by Customer Group
- 6.3 Operating Scale, Capacity & Infrastructure Analysis
- 6.3.1 National Operating Scale & Supply Capacity
- 6.3.2 Resource Utilization & Operating Efficiency
- 6.3.3 Output, Service Delivery & Activity Metrics
- 6.3.4 Operating Footprint & Infrastructure Map
- 6.3.5 Planned Operational & Capacity Expansion
- 6.4 UK POP Display Competitive Benchmarking Matrix
- 6.4.1 Revenue, Growth, Profitability & Operating Metric Comparison
- 6.4.2 Channel Revenue Mix
- 6.4.3 Revenue Exposure Across Domestic Markets
- 6.4.4 R&D Intensity
- 6.4.5 Sustainability Maturity
- 6.5 Strategic Developments in UK POP Display (Last 24 Months)
- 6.5.1 Mergers, Acquisitions & Divestments
- 6.5.2 New Products, Services & Solutions in UK POP Display
- 6.5.3 Operational & Infrastructure Expansions
- 6.5.4 Strategic Alliances, Joint Ventures & Partnerships
- 6.5.5 Distribution Expansion & Market Entry
- 6.5.6 Sustainability & ESG Initiatives
- 6.6 Competitive Strategy Mapping
- 6.6.1 Leader, Challenger, Follower & Niche Classification
- 6.6.2 Pricing Strategy Comparison
- 6.6.3 Channel Strategy Matrix
Note: Strategic developments are included based on their materiality and the availability of reliable information.
Chapter 7. UK POP Display – By Sales & Delivery Channel
- 7.1 Segment Overview
- 7.1.1 Volume & Revenue Split by Channel (2024 & 2032) (Volume Where Applicable)
- 7.1.2 Channel Mix Evolution (2024-2032)
Chapter 8. Subnational Market Analysis – Country Overview
- 8.1 Domestic Geographic Market Overview
- 8.1.1 Subnational Volume Share (Where Applicable)
- 8.1.2 Subnational Revenue Share
- 8.1.3 Market Volume by Subnational Area (Where Applicable)
- 8.1.4 Market Revenue by Subnational Area
- 8.1.5 Subnational Forecasts Through 2032
- 8.2 Cross-Area Segment Analysis Within the Country
- 8.2.1 By Sales & Delivery Channel
- 8.2.2 By Competitive Positioning & Price Tier
Chapter 9. UK POP Display – Priority Domestic Market 1
Chapter 10. UK POP Display – Priority Domestic Market 2
Chapter 11. UK POP Display – Priority Domestic Market 3
Chapter 12. UK POP Display – Priority Domestic Market 4
Chapter 13. UK POP Display Company Profiles
- 13.1 [Company 01]
- 13.1.1 Company Overview
- 13.1.2 Key Management Personnel
- 13.1.3 Products & Services Portfolio
- 13.1.4 Financial Performance
- 13.1.5 Domestic Market Focus & Local Operating Presence
- 13.1.6 Recent Developments & Strategic Initiatives
Note: The company profile list is preliminary and may change based on research findings, market developments, data availability, and client requirements.
Chapter 14. Appendices
- Appendix A – List of Abbreviations & Acronyms
- Appendix B – Industry Classification Code Reference – Full Series
- Appendix C – Supply, Output & Operating Capacity Data Tables
- Appendix D – End-Use & Demand Base Tables
- Appendix E – Demand, Adoption & Usage Assumptions
- Appendix F – Pricing & Revenue Metric Reference Tables
- Appendix G – Company Operations & Infrastructure Database
- Appendix H – Cross-Border Trade & Activity Data Tables (Where Applicable)
- Appendix I – Regulatory Summary Tables
- Appendix J – Primary Research Participant List (Anonymized)
- Appendix K – Primary Research Questionnaire Framework
- Appendix L – Data Sources & Bibliography
- Appendix M – Market Size Divergence & Source Comparison
Chapter 15. Research Methodology
- 15.1 Research Framework & Philosophy
- 15.2 Secondary Research – Sources, Hierarchy & Data Extraction
- 15.3 Data Modeling – National Market Sizing & Subnational Allocation
- 15.4 Primary Research – Stakeholder Framework, LOI & Sample Sizes
- 15.5 Forecast Methodology – Regression, Scenario & Sensitivity Analysis
- 15.6 Quality Control – Four-Layer Validation Framework
- 15.7 Limitations & Standard Assumptions
- 15.8 Disclaimer
