
United States Beauty Devices Market Overview:
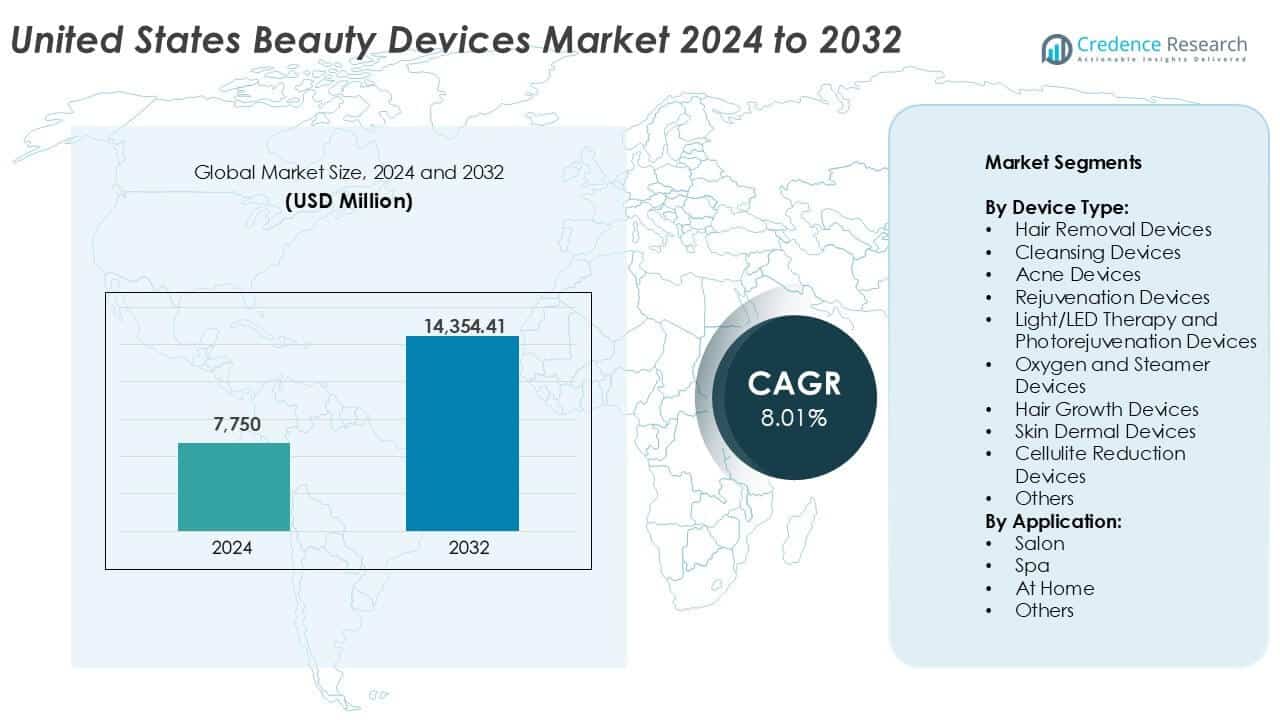
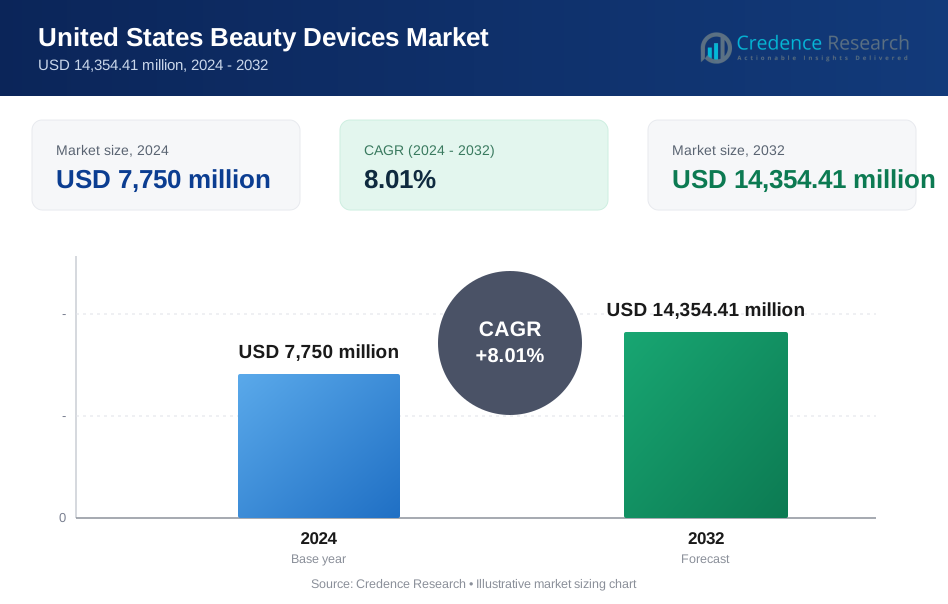
The United States Beauty Devices market size was valued at USD 7,750 million in 2024 and is anticipated to reach USD 14,354.41 million by 2032, at a CAGR of 8.01% during the forecast period.
| REPORT ATTRIBUTE | DETAILS |
|---|---|
| Historical Period | 2020-2023 |
| Base Year | 2024 |
| Forecast Period | 2025-2032 |
| United States Beauty Devices Market Size 2024 | USD 7,750 million |
| United States Beauty Devices Market, CAGR | 8.01% |
| United States Beauty Devices Market Size 2032 | USD 14,354.41 million |
Top players in the United States Beauty Devices market include Conair Corporation, Tria Beauty, Foreo, Nu Skin, and Silkn, which lead in at-home devices due to strong brand recognition and retail reach. In the professional segment, companies like Lumenis, Candela Corporation, Sciton Inc., and Cynosure dominate with advanced technologies used in dermatology clinics and aesthetic centers. Koninklijke Philips N.V. maintains a broad presence across both segments, while emerging players like Tech4beauty and Curallux LLC are gaining traction through innovation and targeted marketing. Regionally, the South leads the market with a 30% share in 2024, driven by high grooming demand, strong retail activity, and widespread availability of both home-use and professional devices.
United States Beauty Devices Market Insights
- The United States Beauty Devices market was valued at USD 7,750 million in 2024 and is expected to reach USD 14,354.41 million by 2032, growing at a CAGR of 8.01%.
- Rising consumer shift toward at-home beauty solutions drives demand for hair removal, cleansing, and rejuvenation devices.
- Smart devices with AI-driven personalization and connected features are shaping consumer preferences across age groups.
- Key players such as Conair, Lumenis, and Foreo dominate through innovation, while newer entrants focus on targeted skin concerns and tech integration.
- The South leads regionally with a 30% share, followed by the West at 25%; Hair Removal Devices account for over 25% market share by device type, while At Home use leads the application segment with over 45% share.
United States Beauty Devices Market Segmentation Analysis:
By Device Type
Hair Removal Devices lead the United States Beauty Devices market, accounting for the largest revenue share of over 25% in 2024. High consumer demand for convenient and cost-effective hair removal solutions supports this dominance. Devices like laser and IPL-based systems are widely adopted due to their long-term effectiveness and ease of use. Rising grooming awareness among both women and men continues to drive category growth. Cleansing Devices hold a significant share due to their integration into daily skincare routines, offering deep pore cleaning and enhanced product absorption. Rejuvenation Devices and Light/LED Therapy Devices also capture notable shares in the market. Together, they address aging concerns and skin tone correction, especially among aging demographics. Rejuvenation Devices benefit from the growing preference for non-invasive anti-aging solutions. Light/LED and Photorejuvenation Devices are gaining traction in at-home and salon segments for their safety and visible results. Meanwhile, Acne Devices and Hair Growth Devices appeal to younger consumers, while Skin Dermal and Cellulite Reduction Devices see selective usage.
- For instance, Philips’ Lumea Prestige IPL delivers up to 450,000 light pulses with five adjustable energy levels for home use.
By Application
The Home segment dominates the United States Beauty Devices market with over 45% market share in 2024. This segment gains momentum from rising consumer inclination toward self-care routines and the convenience of home-based beauty treatments. Growing awareness, product accessibility via online channels, and affordable device launches drive adoption. Compact design, ease of use, and safety improvements have expanded this segment beyond traditional salon goers to a broader consumer base, including teens and working adults. Salon applications hold the second-largest market share, supported by professional-grade device usage and recurring customer visits. Salons often invest in high-end hair removal, LED therapy, and rejuvenation systems to deliver premium services. Spa-based applications contribute a moderate share, catering to wellness-focused customers with specialized treatments. The ‘Others’ category includes clinics and dermatology centers using advanced devices for targeted therapies, particularly in acne, anti-aging, and hair regrowth. These applications benefit from medical-grade efficacy and dermatologist-guided treatments.
- For instance, Foreo’s LUNA 3 operates for 650 uses per charge and uses medical-grade silicone bristles. Salon use remains strong for advanced treatments.
United States Beauty Devices Market Key Growth Drivers
Rising Consumer Focus on At-Home Beauty Treatments
The growing preference for at-home beauty solutions strongly drives the United States Beauty Devices market. Consumers seek convenient, time-saving alternatives to salon visits, leading to increased adoption of compact and easy-to-use devices. Technological advancements in home-use gadgets, especially in hair removal, LED therapy, and facial cleansing, make these devices safer and more effective for unsupervised use. E-commerce platforms and influencer-driven marketing have expanded product visibility and consumer access. In particular, working professionals and younger consumers show high interest in devices that deliver salon-quality results without recurring service costs. The pandemic also accelerated this shift, with many users maintaining their self-care routines from home. As personalization and safety features improve, the home-use segment continues to attract new users, strengthening overall market expansion.
- For instance, Tria Beauty’s Hair Removal Laser 4X uses diode laser technology at 810 nm cleared for home use. CurrentBody’s LED mask delivers 132 LEDs operating at red and near-infrared wavelengths for daily sessions under 10 minutes.
Aging Population and Growing Demand for Anti-Aging Solutions
An aging population across the U.S. significantly supports demand for non-invasive anti-aging beauty devices. Consumers aged 35 and above increasingly invest in devices that target wrinkles, skin laxity, pigmentation, and age spots. Rejuvenation systems, LED therapy, and dermal devices offer long-term skin benefits without surgery or clinical downtime. This demographic prioritizes appearance maintenance and values devices that combine convenience with dermatology-grade outcomes. In addition, rising awareness of skin health, driven by dermatologist-endorsed products and media influence, boosts category interest. Manufacturers have responded with evidence-based marketing and user-friendly designs. As older consumers aim to delay visible aging signs, they represent a stable and expanding user base for advanced anti-aging devices.
- For instance, Dr. Dennis Gross’ LED face mask emits red and blue light at 633 nm and 415 nm for collagen support and acne care.
Technological Advancements and Device Innovation
Continuous innovation in beauty device technology accelerates market growth. AI-powered skin analyzers, smart cleansing brushes, and multi-function therapy devices attract tech-savvy users seeking customized skincare. FDA-approved products with improved energy delivery systems such as IPL, RF, or ultrasonic technology boost consumer confidence in safety and efficacy. Wireless operation, mobile app integration, and personalized treatment settings enhance user experience and engagement. Companies also invest in R&D to minimize side effects and extend device lifespan. Cross-industry collaboration with dermatologists and software developers further strengthens innovation. This trend supports both the at-home and professional segments, encouraging repeat purchases and market penetration across age groups.
United States Beauty Devices Market Key Trends & Opportunities
Personalization and Smart Beauty Devices Adoption
The trend toward personalized skincare and beauty routines is transforming the U.S. Beauty Devices market. Consumers increasingly demand devices that adjust to skin type, condition, and treatment goals. Smart beauty devices, equipped with sensors and AI algorithms, analyze skin and offer tailored regimens in real time. For example, connected facial brushes or LED masks sync with mobile apps for guided sessions and performance tracking. This trend aligns with the broader shift toward wellness and tech-driven self-care. Brands that combine skin diagnostics with automated treatments are gaining customer loyalty. Personalization also opens doors for subscription-based models and data-driven product development, creating long-term revenue streams for manufacturers.
- For instance, L’Oréal’s Perso system analyzes skin tone and hydration using onboard sensors and dispenses customized serum doses measured in microliters.
Expansion in Male Grooming and Inclusive Beauty Solutions
The male grooming segment presents a growing opportunity within the beauty devices space. U.S. men increasingly use hair removal, cleansing, and acne treatment devices as part of their grooming routines. Marketing strategies now target male consumers with gender-neutral branding and product design. At the same time, inclusive beauty trends encourage device makers to consider varying skin tones, sensitivities, and hair types in product development. Devices adapted for darker skin tones or coarse hair see increased traction among diverse demographic groups. Inclusive product features strengthen brand positioning and address unmet needs, enabling deeper market penetration across gender and ethnic lines.
United States Beauty Devices Market Key Challenges
High Initial Cost and Limited Product Lifespan
The premium pricing of advanced beauty devices remains a key barrier, especially in the at-home segment. FDA-cleared systems with superior technology often cost hundreds of dollars, discouraging price-sensitive consumers. Even for salon operators, upfront investment in professional-grade devices limits adoption in small or independent outlets. Furthermore, device lifespan and recurring accessory costs (e.g., cartridges, gel pads, or filters) impact long-term affordability. Limited warranty periods and inconsistent repair services reduce consumer trust in higher-end models. Although installment-based pricing and subscription plans are gaining traction, affordability concerns still restrict access to a broader user base, particularly among younger or middle-income buyers.
Concerns Regarding Safety and User Awareness
Safety and misuse issues challenge market adoption, particularly for at-home beauty devices. Without proper training or guidance, users may experience skin burns, irritation, or ineffective results. Devices like IPL hair removal or RF-based rejuvenation systems require strict adherence to usage protocols. Limited awareness about skin compatibility or contraindications leads to skepticism among first-time users. Moreover, counterfeit or unregulated products in the online marketplace further raise safety concerns. Regulatory bodies such as the FDA continue to emphasize compliance, but consumer education remains limited. Brands must invest in tutorials, support services, and quality certifications to address these barriers and build trust.
United States Beauty Devices Market Regional Analysis
Northeast
The Northeast region holds approximately 22% of the United States Beauty Devices market in 2024. High urbanization, dense population, and strong purchasing power contribute to robust demand. States like New York and Massachusetts drive sales through premium retail outlets, dermatology clinics, and spas. Consumers in this region prioritize advanced skincare and anti-aging solutions, boosting uptake of LED therapy and rejuvenation devices. The presence of luxury brands and professional-grade salons further supports device penetration. Online channels also play a growing role, especially among younger, tech-savvy users seeking personalized at-home treatments. Innovation and early adoption trends continue to shape this region's growth.
Midwest
The Midwest accounts for around 18% of the U.S. Beauty Devices market in 2024. Major markets include Illinois, Ohio, and Michigan, where consumer focus on cost-effective skincare solutions supports the growth of at-home devices. While urban centers lead in adoption, suburban and rural areas show rising interest in multifunctional and affordable tools. Hair removal and cleansing devices dominate due to broad appeal and ease of use. Beauty device sales in this region also benefit from increasing presence of national retail chains and influencer-driven e-commerce. However, slower professional service adoption compared to coastal states slightly tempers growth momentum in the salon segment.
South
The South represents the largest regional share, capturing nearly 30% of the U.S. Beauty Devices market in 2024. States like Texas, Florida, and Georgia anchor strong growth due to diverse demographics and a high concentration of salons, spas, and aesthetic clinics. Both professional and home-use segments thrive, driven by demand for skin rejuvenation, LED therapy, and hair removal devices. Rising disposable income, beauty consciousness, and cultural emphasis on grooming amplify device usage across gender and age groups. E-commerce and direct-to-consumer models see strong uptake in suburban areas. The region benefits from favorable climate-related demand for skincare-focused devices throughout the year.
West
The West commands around 25% of the United States Beauty Devices market in 2024, with California as the leading state. High-income households, wellness-oriented lifestyles, and a tech-driven consumer base support rapid device adoption. The region favors premium skincare technology, with strong demand for personalized and smart beauty devices. Urban centers like Los Angeles and San Francisco fuel growth through dermatologist-backed retail, celebrity influence, and innovation-led brands. At-home beauty device penetration is high, particularly in cleansing, LED therapy, and acne treatment categories. The presence of beauty tech startups and cosmetic R&D hubs further drives product innovation and early market testing.
United States Beauty Devices Market Segmentations:
By Device Type:
- Hair Removal Devices
- Cleansing Devices
- Acne Devices
- Rejuvenation Devices
- Light/LED Therapy and Photorejuvenation Devices
- Oxygen and Steamer Devices
- Hair Growth Devices
- Skin Dermal Devices
- Cellulite Reduction Devices
- Others
By Application:
- Salon
- Spa
- At Home
- Others
By Geography:
- Northeast
- Midwest
- South
- West
Competitive Landscape
The competitive landscape of the United States Beauty Devices market remains moderately fragmented, with a mix of global brands and specialized domestic players. Leading companies focus on innovation, brand strength, and broad product portfolios to maintain market position. Firms such as Philips, Foreo, and Conair leverage strong retail presence and consumer trust to drive volume sales in at-home devices. Professional device manufacturers including Candela, Lumenis, Cynosure, and Sciton compete through clinical-grade technology and strong relationships with dermatology clinics and aesthetic centers. Companies actively invest in R&D to enhance safety, treatment efficacy, and device lifespan. Strategic partnerships, product launches, and regulatory approvals support competitive differentiation. Digital marketing and direct-to-consumer channels play a growing role in brand visibility. Competitive intensity continues to rise as players expand portfolios across hair removal, skin rejuvenation, and LED therapy devices.
Key Player Analysis
- Tria Beauty (US)
- Lumenis (Israel)
- Koninklijke Philips N.V. (Netherlands)
- Foreo (Sweden)
- Cynosure (US)
- Conair Corporation (US)
- Sciton Inc. (US)
- Tech4beauty (Germany)
- Nu Skin (US)
- Termosalud (Spain)
- Silkn (US)
- Curallux LLC. (US)
- Candela Corporation (US)
Recent Developments
- In July 2025, JMOON entered the U.S. market with the debut of its flagship NouvelleSkin Facial Toning Device at Cosmoprof North America 2025. The advanced beauty-tech gadget introduces the brand’s proprietary Transdermal Collagen Light (TCL) Technology, which aims to redefine at-home skin rejuvenation by outperforming traditional radiofrequency (RF) treatments in both depth and treatment area.
- In May 2025, CLASSYS, a leading Korean medical aesthetic device maker, secured European Union CE certification under the new Medical Device Regulation (MDR) for its radiofrequency-based anti-aging system Volnewmer, becoming the first company to gain CE MDR approval for an RF aesthetic device in Europe.
- In November 2022, Nu Skin Enterprises had launched LumiSpa iO device, a smart skin treatment and cleansing device. It features Nu Skin's patented micropulse technology and elevates personalized beauty to a new level with customized treatments available, intelligent mentoring, skincare routine tracking, and so on.
Report Coverage
The research report offers an in-depth analysis based on Device Type, Application and Geography. It details leading market players, providing an overview of their business, product offerings, investments, revenue streams, and key applications. Additionally, the report includes insights into the competitive environment, SWOT analysis, current market trends, as well as the primary drivers and constraints. Furthermore, it discusses various factors that have driven market expansion in recent years. The report also explores market dynamics, regulatory scenarios, and technological advancements that are shaping the industry. It assesses the impact of external factors and global economic changes on market growth. Lastly, it provides strategic recommendations for new entrants and established companies to navigate the complexities of the market.
Future Outlook
- The demand for at-home beauty devices will continue to rise across all age groups.
- Hair removal and LED therapy devices will remain the top-selling product categories.
- AI-powered smart devices will gain traction through personalized skincare solutions.
- E-commerce platforms will play a larger role in expanding consumer access.
- Male grooming devices will see increased adoption in both urban and suburban areas.
- Brands will invest more in inclusive devices tailored to diverse skin tones and hair types.
- Regulatory compliance and FDA approvals will shape consumer trust and product adoption.
- Compact, multifunctional devices will replace single-use tools in consumer routines.
- Premium product segments will expand through targeted marketing and subscription models.
- Southern and Western U.S. regions will remain key growth hubs for device manufacturers.
Request a Free Sample
Fill in your details and we'll send you a free sample report.
- Sample data tables & charts
- Research methodology
Need a Custom Version of This Report?
Tailor the scope, geography, or segments to your exact requirements.
- Custom geography or segment scope
- Direct access to our analyst team
Frequently Asked Questions
What is the current market size for United States Beauty Devices market, and what is its projected size in 2032?
At what Compound Annual Growth Rate is the United States Beauty Devices market projected to grow between 2024 and 2032?
Which United States Beauty Devices market segment held the largest share in 2024?
What are the primary factors fueling the growth of the United States Beauty Devices market?
Who are the leading companies in the United States Beauty Devices market?
Which region commanded the largest share of the United States Beauty Devices market in 2024?
Table of Content
Chapter 1. Report Introduction
- 1.1 Report Description & Purpose
- 1.1.1 Report Title & Market Definition
- 1.1.2 Unique Selling Propositions (USP) & Key Differentiators
- 1.1.3 Value Proposition for Stakeholders
- 1.2 Research Objectives
- 1.2.1 Market Sizing Objectives (Volume & Revenue)
- 1.2.2 Segmentation Objectives
- 1.2.3 Competitive Intelligence Objectives
- 1.2.4 Forecast & Scenario Objectives
- 1.3 Report Scope
- 1.3.1 United States Beauty Devices Scope – Types & Subtypes Covered
- 1.3.2 Geographic Scope – Regions & Countries Covered
- 1.3.3 Historical Period, Base Year & Forecast Period (2024; forecast to 2032)
- 1.3.4 Inclusions & Exclusions
- 1.4 HS Code & Classification Framework
- 1.5 Currency, Units & Pricing Basis
- 1.6 Target Stakeholders
- 1.7 Limitations & Assumptions
Chapter 2. Executive Summary
- 2.1 Global United States Beauty Devices Market Snapshot
- 2.1.1 Market Size – Historical (2024) & Forecast (2024-2032) (2024: USD 7,750 million → 2032: USD 14,354.41 million)
- 2.1.2 Volume & Revenue – Global Totals
- 2.1.3 Key Market Highlights – Top Five Facts
- 2.2 United States Beauty Devices Market Segmentation Snapshot
- 2.2.1 Market Split by Region – 2024 vs. 2032
- 2.3 Competitive Snapshot
- 2.3.1 Top 10 Players by Revenue Share – 2024
- 2.3.2 Top 10 Players by Volume Share – 2024
- 2.3.3 Recent Strategic Developments (18-Month Summary)
- 2.4 Key Investment Highlights & Strategic Conclusions
Chapter 3. United States Beauty Devices Market Dynamics & Industry Analysis
- 3.1 Market Overview & Context
- 3.1.1 United States Beauty Devices Market Position in the Broader Automotive Value Chain
- 3.1.2 OEM vs. Replacement Market Dynamics
- 3.1.3 Market Maturity & Development Stage by Region
- 3.2 United States Beauty Devices Market Drivers
- 3.3 United States Beauty Devices Market Restraints & Challenges
- 3.4 United States Beauty Devices Market Opportunities
- 3.5 Porter's Five Forces Analysis
- 3.5.1 Threat of New Entrants
- 3.5.2 Bargaining Power of Suppliers
- 3.5.3 Bargaining Power of Buyers
- 3.5.4 Threat of Substitutes
- 3.5.5 Competitive Rivalry – Intensity Assessment
- 3.6 United States Beauty Devices Value Chain Analysis
- 3.6.1 Upstream – Raw Material/Input Suppliers
- 3.6.1.1 Raw Material/Input 1
- 3.6.1.2 Raw Material/Input 2
- 3.6.1.3 Raw Material/Input 3
- 3.6.2 Midstream – Production/Manufacturing/Service Delivery
- 3.6.2.1 Production/Process Overview
- 3.6.2.2 Key Facility Locations & Capacity by Manufacturer
- 3.6.3 Downstream – Distribution & End Consumer
- 3.6.3.1 Primary Channel – B2B/OEM
- 3.6.3.2 Secondary Channels – Dealer, Retail, Online, Direct
- 3.6.4 Value Chain Profitability Analysis
- 3.6.1 Upstream – Raw Material/Input Suppliers
- 3.7 PESTEL Analysis
- 3.7.1 Political Factors
- 3.7.2 Economic Factors
- 3.7.3 Social Factors
- 3.7.4 Technological Factors
- 3.7.5 Environmental Factors
- 3.7.6 Legal Factors
- 3.8 United States Beauty Devices Supply Chain Analysis
- 3.8.1 Raw Material/Input Supply Risk Assessment
- 3.8.2 Manufacturing Concentration Risk (Geographic Exposure)
- 3.8.3 Trade Disruption Impact Analysis
- 3.9 Regulatory & Policy Landscape
Note: The regulatory and policy landscape section covers regulations based on their applicability to the market, United States Beauty Devices category, geography, and scope of the study. Only regulatory frameworks with a material impact on operations, compliance, trade, sustainability, or market access are analyzed in detail.
Chapter 4. Key Investment Pockets & Opportunity Analysis
- 4.1 United States Beauty Devices Market Attractiveness Analysis
- 4.1.1 By Region – Investment Attractiveness Matrix (Volume × CAGR)
- 4.2 Absolute Revenue Growth Opportunity
- 4.2.1 By Region – Absolute USD Growth Through 2032
- 4.3 Incremental Volume Opportunity
- 4.3.1 By Region – Incremental Volume Through 2032
- 4.3.2 Segment – Incremental Volume
- 4.4 Emerging Submarket Opportunity Deep Dive (Subject to Applicability)
- 4.5 Emerging Market Opportunity Scorecards
- 4.5.1 United States
- 4.5.2 Europe
- 4.5.3 Asia
- 4.5.4 Middle East & Africa
Note: Emerging Market Opportunity Scorecards will be included based on relevance and strategic importance. Regions listed are indicative and may vary depending on data availability and market dynamics.
Chapter 5. United States Beauty Devices Import-Export Analysis & Trade Flows
- 5.1 Global Trade Overview
- 5.1.1 Global Export Value by Country (2024)
- 5.1.2 Global Export Volume by Country (2024)
- 5.1.3 Global Import Value by Country (2024)
- 5.1.4 Global Import Volume by Country (2024)
- 5.1.5 Net Trade Balance by Country (2024)
- 5.2 Export Analysis – Segment
- 5.2.1 Type 1 (HS Code)
- 5.2.2 Type 2 (HS Code)
- 5.2.3 Type 3 (HS Code)
- 5.2.4 Type 4 (HS Code)
- 5.2.5 Type 5 (HS Code)
- 5.3 Import Analysis – Segment
- 5.3.1 Type 1 (HS Code)
- 5.3.2 Type 2 (HS Code)
- 5.3.3 Type 3 (HS Code)
- 5.3.4 Type 4 (HS Code)
- 5.3.5 Type 5 (HS Code)
- 5.4 Average Unit Trade Prices
- 5.4.1 Average Export Price – Segment & Country
- 5.4.2 Average Import Price – Segment & Source Country
- 5.4.3 Price Trends (2024)
- 5.5 Key Trade Route Analysis
- 5.5.1 Trade Route 1
- 5.5.2 Trade Route 2
- 5.5.3 Trade Route 3
- 5.5.4 Trade Route 4
- 5.5.5 Trade Route 5
- 5.6 Trade Policy Impact Assessment
- 5.6.1 US Anti-Dumping & Section 301 Tariffs
- 5.6.2 EU Customs Union Impact
- 5.6.3 Major Free Trade Agreements
- 5.6.4 USMCA Rules of Origin
Note: Trade policy analysis will be included only where relevant to the United States Beauty Devices market.
Chapter 6. Competitive Landscape & Company Benchmarking
- 6.1 United States Beauty Devices Market Concentration & Structure
- 6.1.1 Herfindahl-Hirschman Index (HHI) – vs. 2024
- 6.1.2 Tier 1, Tier 2 & Tier 3 Market Structure
- 6.1.3 Global, Regional & Local Player Dynamics
- 6.2 United States Beauty Devices Market Share Analysis – 2024
- 6.2.1 Global Revenue Share by Company
- 6.2.2 Global Volume Share by Company
- 6.2.3 Regional Revenue Share
- 6.2.4 Market Share Evolution ( vs. 2024)
- 6.2.5 OEM Segment Share by Company
- 6.2.6 Replacement Segment Share by Company
- 6.3 Production/Delivery Capacity & Facility Analysis
- 6.3.1 Global Installed Capacity
- 6.3.2 Capacity Utilization Rates
- 6.3.3 Production/Output Volume
- 6.3.4 Facility Locations & Capacity Map
- 6.3.5 Planned Capacity Additions
- 6.4 United States Beauty Devices Competitive Benchmarking Matrix
- 6.4.1 Revenue, Volume, CAGR & Profitability Comparison
- 6.4.2 Channel Revenue Mix
- 6.4.3 Geographic Revenue Exposure
- 6.4.4 R&D Intensity
- 6.4.5 Sustainability Maturity
- 6.5 Strategic Developments in United States Beauty Devices (Last 24 Months)
- 6.5.1 Mergers, Acquisitions & Divestments
- 6.5.2 New United States Beauty Devices Launches
- 6.5.3 Facility Expansions
- 6.5.4 Strategic Alliances, Joint Ventures & Partnerships
- 6.5.5 Distribution Expansion & Market Entry
- 6.5.6 Sustainability & ESG Initiatives
- 6.6 Competitive Strategy Mapping
- 6.6.1 Leader, Challenger, Follower & Niche Classification
- 6.6.2 Pricing Strategy Comparison
- 6.6.3 Channel Strategy Matrix
Note: Strategic developments are included based on their materiality and the availability of reliable information.
Chapter 7. Global United States Beauty Devices Market – By Distribution Channel
- 7.1 Segment Overview
- 7.1.1 Volume & Revenue Split by Channel (2024 & 2032)
- 7.1.2 Channel Mix Evolution (2024-2032)
Chapter 8. Regional Market Analysis – Global Overview
- 8.1 Global Regional Overview
- 8.1.1 Regional Volume Share
- 8.1.2 Regional Revenue Share
- 8.1.3 Regional Volume by Region
- 8.1.4 Regional Revenue by Region
- 8.1.5 Regional Forecast Through 2032
- 8.2 Cross-Regional Segment Analysis
- 8.2.1 By Distribution Channel
- 8.2.2 By Brand/Price Tier
Chapter 9. North America United States Beauty Devices Market
- 9.1 United States
- 9.2 Canada
- 9.3 Mexico
Chapter 10. Europe United States Beauty Devices Market
- 10.1 Germany
- 10.2 France
- 10.3 Italy
- 10.4 United Kingdom
- 10.5 Spain
- 10.6 Poland
- 10.7 Russia
- 10.8 Netherlands
- 10.9 Belgium
- 10.10 Sweden
- 10.11 Denmark
- 10.12 Norway
- 10.13 Rest of Europe
Chapter 11. Asia Pacific United States Beauty Devices Market
- 11.1 China
- 11.2 India
- 11.3 Japan
- 11.4 South Korea
- 11.5 Thailand
- 11.6 Indonesia
- 11.7 Vietnam
- 11.8 Malaysia
- 11.9 Australia
- 11.10 Rest of Asia Pacific
Chapter 12. Latin America United States Beauty Devices Market
- 12.1 Brazil
- 12.2 Argentina
- 12.3 Colombia
- 12.4 Chile
- 12.5 Rest of Latin America
Chapter 13. Middle East United States Beauty Devices Market
- 13.1 Saudi Arabia
- 13.2 United Arab Emirates
- 13.3 Turkey
- 13.4 Israel
- 13.5 Iran
- 13.6 Rest of the Middle East
Chapter 14. Africa United States Beauty Devices Market
- 14.1 South Africa
- 14.2 Egypt
- 14.3 Nigeria
- 14.4 Morocco
- 14.5 Rest of Africa
Chapter 15. United States Beauty Devices Company Profiles
- 15.1 [Company 01]
- 15.1.1 Company Overview
- 15.1.2 Key Management Personnel
- 15.1.3 Products & Services Portfolio
- 15.1.4 Financial Performance
- 15.1.5 Key Market Focus & Geographic Presence
- 15.1.6 Recent Developments & Strategic Initiatives
Note: The company profile list is preliminary and may change based on research findings, market developments, data availability, and client requirements.
Chapter 16. Appendices
- Appendix A – List of Abbreviations & Acronyms
- Appendix B – Industry Classification Code Reference – Full Series
- Appendix C – Production & Capacity Data Tables
- Appendix D – End-Use & Demand Base Tables
- Appendix E – Consumption & Replacement Rate Assumptions
- Appendix F – ASP Reference Tables
- Appendix G – Manufacturing & Facility Database
- Appendix H – Import-Export Data Tables
- Appendix I – Regulatory Summary Tables
- Appendix J – Primary Research Participant List (Anonymized)
- Appendix K – Primary Research Questionnaire Framework
- Appendix L – Data Sources & Bibliography
- Appendix M – Market Size Divergence & Source Comparison
Chapter 17. Research Methodology
- 17.1 Research Framework & Philosophy
- 17.2 Secondary Research – Sources, Hierarchy & Data Extraction
- 17.3 Data Modeling – Bottom-Up & Top-Down Market Sizing
- 17.4 Primary Research – Stakeholder Framework, LOI & Sample Sizes
- 17.5 Forecast Methodology – Regression, Scenario & Sensitivity Analysis
- 17.6 Quality Control – Four-Layer Validation Framework
- 17.7 Limitations & Standard Assumptions
- 17.8 Disclaimer
