| REPORT ATTRIBUTE |
DETAILS |
| Historical Period |
2020-2023 |
| Base Year |
2024 |
| Forecast Period |
2025-2032 |
| U.S. Cyber Physical Systems Market Size 2024 |
USD 36561.57 Million |
| U.S. Cyber Physical Systems Market, CAGR |
10.27% |
| U.S. Cyber Physical Systems Market Size 2032 |
USD 79897.97 Million |
Market Overview:
The U.S. Cyber Physical Systems Market is projected to grow from USD 36561.57 million in 2024 to an estimated USD 79897.97 million by 2032, with a compound annual growth rate (CAGR) of 10.27% from 2024 to 2032.
The U.S. Cyber-Physical Systems (CPS) market is driven by several key factors, including the rise of industrial automation, advancements in IoT and AI technologies, and the growing demand for smart infrastructure. The shift towards Industry 4.0, emphasizing automation and data-driven decision-making, has led to CPS playing a pivotal role in enhancing operational efficiency, reducing downtime, and optimizing production processes, particularly in manufacturing. Additionally, CPS is integral to the development of smart infrastructure, such as smart grids and intelligent transportation systems, that enable real-time monitoring and control to improve energy efficiency, traffic management, and public safety. The proliferation of IoT devices and the continuous evolution of AI further augment CPS capabilities, enabling smarter, more responsive systems across various industries, including healthcare, automotive, and energy management. However, as CPS integrates into critical infrastructure, addressing cybersecurity risks becomes increasingly important to ensure the protection and reliability of these interconnected systems.
Regionally, the U.S. remains a leader in CPS adoption, fueled by its advanced technological infrastructure, significant R&D investments, and the presence of major industry players. The manufacturing sector benefits greatly from CPS technologies, as they align with Industry 4.0 goals by driving automation and process optimization. The automotive industry also leverages CPS for the development of autonomous vehicles, utilizing real-time data processing and control systems to enhance safety and performance. Government initiatives and policies further support the growth of CPS, encouraging the adoption of smart technologies across various sectors. Additionally, private sector investments in smart infrastructure contribute to the creation of smart cities, which are equipped with CPS-enabled systems for improving traffic flow, energy consumption, and public safety. With these advancements and support, the U.S. is well-positioned to lead the global CPS market.
Access crucial information at unmatched prices!
Request your sample report today & start making informed decisions powered by Credence Research Inc.!
Download Sample
Market Insights:
- The U.S. Cyber Physical Systems is projected to grow from USD 36561.57 million in 2024 to an estimated USD 79897.97 million by 2032, with a compound annual growth rate (CAGR) of 10.27% from 2024 to 2032.
- The Global Cyber Physical Systems is projected to grow from USD 1,25,271.30 million in 2024 to an estimated USD 2,71,668.59 million by 2032, with a compound annual growth rate (CAGR) of 10.16% from 2024 to 2032.
- Industrial automation and the shift to Industry 4.0 are key drivers, enhancing operational efficiency and reducing downtime, especially in manufacturing.
- The integration of IoT and AI technologies into CPS solutions is accelerating their adoption, making systems smarter and more responsive.
- Smart infrastructure, particularly in smart cities, is creating increased demand for CPS technologies, enhancing energy management and urban planning.
- Cybersecurity is a critical focus, as the rise of interconnected systems in critical infrastructure requires advanced protection to prevent cyber threats.
- Regional growth shows a dominant share in the Northeast and Midwest, with strong contributions from the manufacturing and automotive sectors.
- Despite growth opportunities, challenges such as high initial costs, system integration complexity, and cybersecurity risks remain as potential barriers to broader adoption.
Market Drivers:
Industrial Automation and Industry 4.0
The U.S. Cyber-Physical Systems (CPS) market is largely driven by the rapid adoption of industrial automation and the growing shift toward Industry 4.0. Industry 4.0 emphasizes the integration of advanced technologies like artificial intelligence (AI), the Internet of Things (IoT), and big data analytics into manufacturing processes. For instance, manufacturers are using IoT-enabled sensors and programmable logic controllers (PLCs) to collect real-time data, which is displayed on live dashboards to optimize production lines and reduce errors. CPS plays a critical role in this transformation by enabling real-time monitoring and control, allowing industries to automate operations, optimize production lines, and improve efficiency. The ability to collect and process data from connected machines and devices within industrial environments enhances decision-making and productivity while reducing downtime and operational costs.
Advancements in IoT and AI Technologies
The proliferation of Internet of Things (IoT) devices and the advancements in AI technologies have significantly boosted the capabilities of Cyber-Physical Systems in the U.S. As more devices become interconnected, CPS enables seamless communication and data exchange between physical systems and digital platforms. For instance, GE Aviation uses IoT sensors in aircraft engines to monitor performance, and this has been shown to reduce maintenance costs and unplanned maintenance. The synergy between IoT and AI enhances CPS by facilitating smarter, more responsive systems capable of making real-time decisions. This enables industries such as healthcare, automotive, and energy management to optimize resource usage, improve safety, and enhance operational performance. The integration of AI-driven algorithms with IoT devices further improves automation, predictive maintenance, and the overall functionality of CPS across various sectors.
Demand for Smart Infrastructure
The increasing demand for smart infrastructure is another critical driver of the U.S. CPS market. The concept of smart cities, which incorporates intelligent systems to improve urban living, relies heavily on CPS technologies. These systems are crucial for enhancing the efficiency of energy management, traffic flow, and public safety through real-time data processing and control. Smart grids, intelligent transportation systems, and smart buildings are just a few examples of how CPS technologies are being implemented to support urbanization and sustainable development. As more cities and communities invest in smart infrastructure to improve quality of life, CPS adoption will continue to grow, supporting a more connected and efficient society.
Cybersecurity and System Integrity
As the integration of CPS into critical infrastructure increases, ensuring robust cybersecurity becomes paramount. The more connected these systems are, the greater the risk of cyber threats and vulnerabilities that can compromise system integrity and functionality. In the U.S., the increasing focus on securing CPS against cyberattacks is driving innovation in the development of advanced cybersecurity solutions tailored to protect these interconnected systems. As businesses and governments seek to safeguard sensitive data and ensure reliable operations, investment in cybersecurity technologies for CPS is expected to rise, fueling growth in the overall market. The need for secure, resilient systems will continue to drive the demand for CPS in industries such as healthcare, manufacturing, and transportation.
Market Trends:
Integration of Edge Computing
One of the prominent trends in the U.S. Cyber-Physical Systems (CPS) market is the increasing integration of edge computing. As CPS systems rely on real-time data collection and analysis, the demand for faster data processing has led to a shift from traditional cloud computing to edge computing. By processing data closer to the source, edge computing reduces latency, improves system responsiveness, and alleviates the burden on cloud infrastructure. This trend is particularly significant in applications such as autonomous vehicles, smart grids, and industrial automation, where immediate decision-making is critical. The adoption of edge computing allows for more efficient data handling, enhanced privacy, and optimized network bandwidth, positioning it as a key enabler of advanced CPS applications.
Growth in Autonomous Systems
The growth of autonomous systems is another key trend driving the U.S. CPS market. Autonomous vehicles, drones, and robotics are increasingly relying on CPS to function efficiently and safely. These systems require advanced sensors, AI algorithms, and real-time communication to operate without human intervention. The U.S. is a leader in developing and deploying these technologies, with major automotive manufacturers and technology companies investing heavily in autonomous systems. For instance, companies like Tesla integrate CPS with AI algorithms to ensure safe navigation and real-time decision-making. The rise of autonomous vehicles, in particular, is transforming industries such as transportation and logistics, offering the potential to reduce human error, improve safety, and enhance operational efficiency. As regulatory frameworks evolve and technology matures, the U.S. CPS market will likely see continued growth in the deployment of autonomous systems.
Artificial Intelligence and Machine Learning Integration
Artificial intelligence (AI) and machine learning (ML) are increasingly integrated into CPS to enhance their capabilities and efficiency. The incorporation of AI and ML algorithms allows CPS to become more adaptive and intelligent, enabling them to analyze large amounts of data and make predictions or decisions without human intervention. This trend is particularly evident in industries like healthcare, where CPS can monitor patient conditions in real-time, predict potential health issues, and provide autonomous responses. Additionally, in manufacturing and logistics, AI-driven CPS can optimize supply chains, predict maintenance needs, and streamline production processes. The ability to continuously learn and improve through AI and ML integration is making CPS systems more efficient and capable of handling complex tasks in dynamic environments.
Focus on Sustainability and Energy Efficiency
Sustainability and energy efficiency are becoming increasingly important drivers of innovation in the U.S. CPS market. As organizations strive to meet environmental goals and reduce energy consumption, CPS technologies are being deployed to optimize resource usage and minimize waste. In industries such as manufacturing, energy management, and agriculture, CPS is used to monitor and control energy consumption in real-time, helping companies reduce their carbon footprint and operational costs. For example, IoT sensors monitor soil conditions in real-time to optimize water usage during irrigation. These innovations align with global efforts to achieve cleaner energy solutions and sustainable development goals. Smart grids, for example, leverage CPS to distribute energy more efficiently, integrating renewable energy sources and improving grid stability. Similarly, the agricultural sector is using CPS technologies for precision farming, which helps optimize irrigation, fertilizer use, and overall resource management, further contributing to sustainable practices and environmental conservation.
Market Challenges Analysis:
Complexity of Integration
One of the key challenges facing the U.S. Cyber-Physical Systems (CPS) market is the complexity of integrating these advanced systems into existing infrastructure. CPS technologies often require seamless interaction between physical components, sensors, and digital platforms, which can be difficult to implement, especially in legacy systems. For instance, the adoption of CPS in smart manufacturing highlights the need for integrating computational algorithms with physical processes, enabling capabilities such as predictive maintenance and real-time monitoring. However, this integration creates a complex environment where both digital and physical components must operate cohesively. This complexity can result in extended implementation timelines, increased costs, and operational disruptions. Organizations may face difficulties in upgrading their infrastructure to accommodate CPS without disrupting their ongoing operations.
Cybersecurity Risks
As CPS systems become more interconnected and integrated into critical infrastructure, cybersecurity risks are a significant concern. The increased reliance on data sharing and real-time communication between devices makes CPS vulnerable to cyberattacks, which can compromise system integrity, data privacy, and operational reliability. Securing these systems against potential threats requires continuous monitoring, advanced encryption methods, and proactive security measures. However, the rapid evolution of cyber threats often outpaces the development of security protocols for CPS, leaving systems exposed to potential breaches. This challenge poses a barrier to widespread adoption, as organizations hesitate to deploy CPS in mission-critical applications without robust cybersecurity frameworks in place.
High Initial Costs
The initial costs associated with implementing CPS technologies can be a major restraint for businesses. The upfront investment required for hardware, software, sensors, and specialized expertise can be significant, especially for small and medium-sized enterprises (SMEs) that may lack the resources for such high-cost projects. Additionally, the ongoing maintenance, training, and upgrades required to keep CPS systems functioning optimally further increase the financial burden. While the long-term benefits of CPS, such as improved efficiency and reduced operational costs, are evident, the high initial investment remains a challenge for organizations looking to adopt these technologies.
Market Opportunities:
The U.S. Cyber-Physical Systems (CPS) market presents significant growth opportunities driven by the increasing demand for automation, real-time monitoring, and data-driven decision-making across various industries. As more sectors such as manufacturing, healthcare, and transportation embrace digital transformation, the integration of CPS technologies offers substantial potential to improve operational efficiency, enhance safety, and reduce costs. The growing emphasis on smart infrastructure, including smart cities and intelligent transportation systems, provides a unique opportunity for CPS solutions to play a pivotal role in the modernization of urban environments. Moreover, the proliferation of IoT devices and advancements in artificial intelligence (AI) further enhance the capabilities of CPS, enabling industries to develop smarter, more responsive systems that can adapt to changing conditions.
Additionally, the rising focus on sustainability and energy efficiency creates new avenues for CPS innovation in sectors like energy management and agriculture. The ability of CPS to optimize resource usage, reduce waste, and improve energy consumption through real-time data analysis positions it as a key enabler of green technologies. In the U.S., where environmental regulations are becoming more stringent, businesses are increasingly investing in CPS solutions to meet sustainability goals. Furthermore, the ongoing development of autonomous systems, including vehicles and drones, presents a significant opportunity for CPS technologies to drive the next generation of intelligent, self-operating systems. As these trends continue to unfold, the U.S. CPS market offers a wealth of opportunities for organizations to capitalize on technological advancements and meet evolving industry demands.
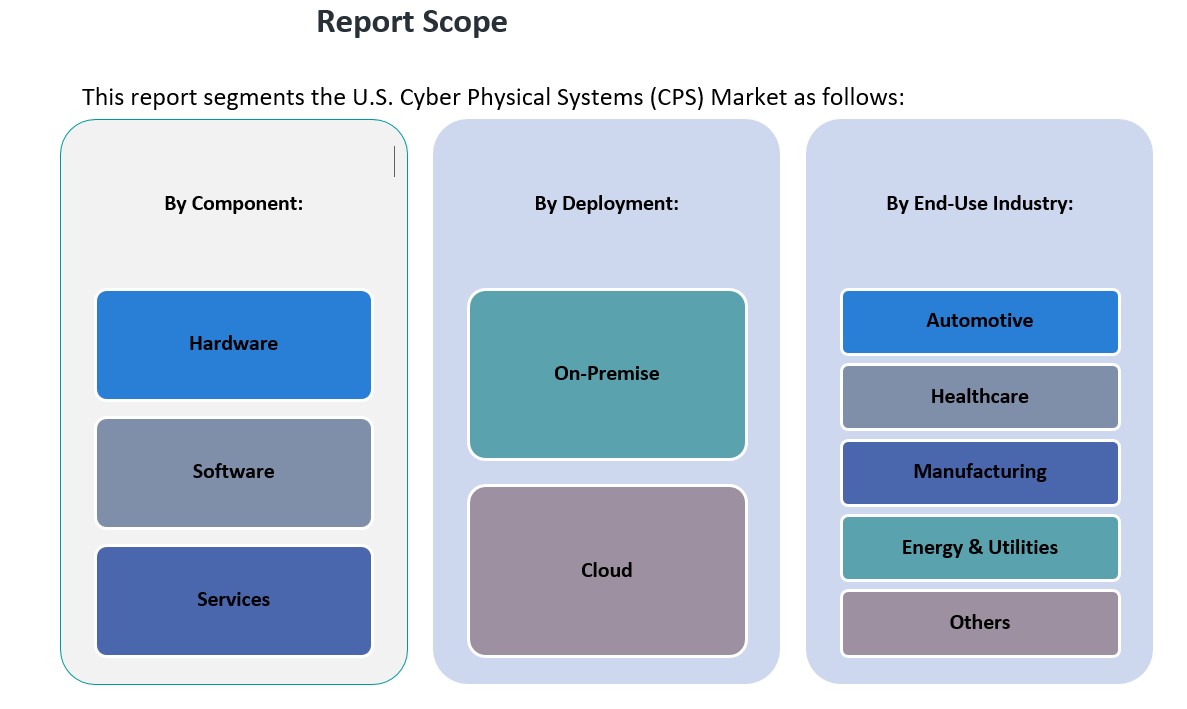
Market Segmentation Analysis:
The U.S. Cyber-Physical Systems (CPS) market is segmented across various components, deployment models, and end-use industries, each contributing to its overall growth and adoption.
By Component, the market is divided into hardware, software, and services. Hardware includes sensors, actuators, and other physical devices essential for system operation, while software encompasses the algorithms and data processing tools that enable CPS functionalities. Services refer to the support and integration offerings, including consulting, maintenance, and system integration. The hardware segment holds a significant share due to the essential role of physical components in CPS, though the software and services segments are growing rapidly as industries demand more advanced analytics and system optimization.
By Deployment, CPS solutions are delivered either on-premise or through the cloud. On-premise deployment is preferred by organizations requiring direct control over their infrastructure, ensuring better security and customization. However, cloud deployment is gaining traction due to its scalability, cost-effectiveness, and ease of access to advanced analytics, making it ideal for industries focused on real-time data processing and flexibility.
By End-Use Industry, CPS is extensively applied in automotive, healthcare, manufacturing, energy & utilities, and other sectors. The automotive sector is witnessing increased adoption due to the rise of autonomous vehicles, while manufacturing benefits from CPS in smart factories and automation. Healthcare leverages CPS for remote monitoring and precision medicine, while energy & utilities use CPS for smart grid management and resource optimization. These industries are poised for growth as CPS enhances operational efficiency and enables smarter, more sustainable systems across the board.
Segmentation:
By Component:
- Hardware
- Software
- Services
By Deployment:
By End-Use Industry:
- Automotive
- Healthcare
- Manufacturing
- Energy & Utilities
- Others
Regional Analysis:
The U.S. Cyber-Physical Systems (CPS) market exhibits significant regional variations, with distinct adoption rates and technological advancements across different areas.
Northeast Region
The Northeast, encompassing states like Massachusetts, New York, and Pennsylvania, holds a substantial share of the CPS market, accounting for approximately 30% of the national market in 2024. This region’s dominance is attributed to its robust industrial base, including manufacturing and healthcare sectors, which are increasingly adopting CPS technologies for automation and real-time data analytics. The presence of leading research institutions and technology companies further bolsters CPS development and implementation.
Midwest Region
The Midwest, including states such as Michigan, Ohio, and Illinois, represents about 25% of the U.S. CPS market. The automotive industry is particularly prominent here, with CPS applications enhancing vehicle automation and manufacturing processes. Additionally, the region’s strong manufacturing sector benefits from CPS in optimizing production lines and supply chain management.
South Region
The Southern states, including Texas, Florida, and Georgia, contribute approximately 20% to the national CPS market share. The energy sector, especially oil and gas, extensively utilizes CPS for monitoring and control systems. Moreover, the growing technology hubs in cities like Austin and Atlanta are fostering CPS adoption across various industries, including aerospace and defense.
West Region
The Western states, notably California, Washington, and Colorado, account for about 15% of the U.S. CPS market. California’s Silicon Valley serves as a hotspot for CPS innovation, particularly in autonomous vehicles and smart infrastructure. The region’s emphasis on technology startups and venture capital investment accelerates the development and deployment of advanced CPS solutions.
Mid-Atlantic Region
The Mid-Atlantic, comprising states like New Jersey, Delaware, and Maryland, holds around 10% of the CPS market share. Proximity to federal agencies and defense contractors drives CPS adoption in government and defense applications. Additionally, the healthcare sector leverages CPS for patient monitoring and data management systems.
Key Player Analysis:
- IBM Corporation
- Honeywell International Inc.
- Rockwell Automation, Inc.
- General Electric Company
- Microsoft Corporation
- Intel Corporation
- Lockheed Martin Corporation
- Northrop Grumman Corporation
- Cisco Systems, Inc.
- 3M Company
Competitive Analysis:
The U.S. Cyber-Physical Systems (CPS) market is highly competitive, with numerous players driving innovation across various industries. Leading technology companies such as Intel Corporation, IBM, and General Electric dominate the market, leveraging their expertise in hardware, software, and services to deliver comprehensive CPS solutions. These companies focus on the integration of IoT, AI, and edge computing technologies to enhance real-time monitoring, automation, and data processing capabilities. Additionally, smaller, specialized players are emerging, offering niche CPS solutions in industries like healthcare, automotive, and energy management. Startups and technology firms in Silicon Valley and other tech hubs continue to push the boundaries of autonomous systems and smart infrastructure. As competition intensifies, companies are investing in R&D to develop more advanced and scalable CPS solutions, while also addressing the growing demand for cybersecurity and system integration services. The evolving landscape presents opportunities for both established players and new entrants to innovate and capture market share.
Recent Developments:
- In March 2025, Armis, a leader in cyber exposure management and security, announced the acquisition of OTORIO, a prominent provider of Operational Technology (OT) and CPS security solutions. The integration of OTORIO’s Titan platform into Armis’ Centrix™ platform expands its capabilities to include on-premises CPS solutions for air-gapped environments, critical for industries like energy and utilities. This acquisition enhances Armis’ ability to provide hybrid security solutions while strengthening its leadership in securing critical infrastructure and industrial environments.
- In February 2025, Armis was also recognized as a Leader in the Gartner Magic Quadrant for CPS Protection Platforms. This acknowledgment highlights the company’s efforts in securing complex CPS environments that integrate IT, OT, IoT, and IIoT systems across sectors such as healthcare, transportation, and smart manufacturing.
- Microsoft was named a leader in the 2025 Gartner Magic Quadrant for Cyber-Physical Systems Protection Platforms on February 19, 2025. The company’s Microsoft Defender for IoT platform integrates CPS security with endpoint protection, enabling organizations to defend against sophisticated cyber threats across operational technology environments.
Market Concentration & Characteristics:
The U.S. Cyber-Physical Systems (CPS) market is characterized by moderate to high concentration, with a mix of established players and emerging innovators. Leading multinational corporations such as Intel, IBM, and General Electric dominate the market, leveraging extensive resources in research and development (R&D) to offer advanced CPS solutions. These companies are well-positioned to cater to large-scale industries, including automotive, manufacturing, and healthcare. However, the market also features a growing number of smaller, specialized firms focusing on niche applications, such as autonomous systems, smart cities, and energy management. This diversity fosters a dynamic competitive environment where both large and small companies continually innovate to meet industry-specific demands. Additionally, the increasing importance of cybersecurity and system integration has led to heightened partnerships and collaborations across sectors. The CPS market is marked by rapid technological advancements, requiring companies to remain agile and invest in emerging technologies to maintain their competitive edge.
Shape Your Report to Specific Countries or Regions & Enjoy 30% Off!
Report Coverage:
The research report offers an in-depth analysis based on Component, Deployment and End-Use Industry. It details leading market players, providing an overview of their business, product offerings, investments, revenue streams, and key applications. Additionally, the report includes insights into the competitive environment, SWOT analysis, current market trends, as well as the primary drivers and constraints. Furthermore, it discusses various factors that have driven market expansion in recent years. The report also explores market dynamics, regulatory scenarios, and technological advancements that are shaping the industry. It assesses the impact of external factors and global economic changes on market growth. Lastly, it provides strategic recommendations for new entrants and established companies to navigate the complexities of the market.
Future Outlook:
- The U.S. CPS market is expected to continue its rapid growth, driven by increased demand for automation and real-time data processing.
- Integration of AI and machine learning will enhance the capabilities of CPS, enabling smarter decision-making and system optimization.
- The rise of autonomous vehicles and drones will significantly impact CPS adoption, particularly in the transportation and logistics sectors.
- Edge computing will gain prominence, reducing latency and improving the efficiency of CPS applications across industries.
- The focus on cybersecurity will intensify as CPS becomes integral to critical infrastructure, driving investments in secure systems.
- Smart cities and infrastructure will drive CPS deployment, especially in energy management, transportation, and public safety.
- The healthcare industry will see increased use of CPS for remote patient monitoring and precision medicine applications.
- Manufacturing will benefit from the widespread adoption of CPS in smart factories, streamlining production and reducing costs.
- Increased government support and policy development will further accelerate CPS innovation and adoption across sectors.
- Collaboration between large corporations and startups will foster innovation, leading to the development of more specialized CPS solutions.


