CHAPTER NO. 1 : INTRODUCTION 19
1.1.1. Report Description 19
Purpose of the Report 19
USP & Key Offerings 19
1.1.2. Key Benefits for Stakeholders 19
1.1.3. Target Audience 20
1.1.4. Report Scope 20
CHAPTER NO. 2 : EXECUTIVE SUMMARY 21
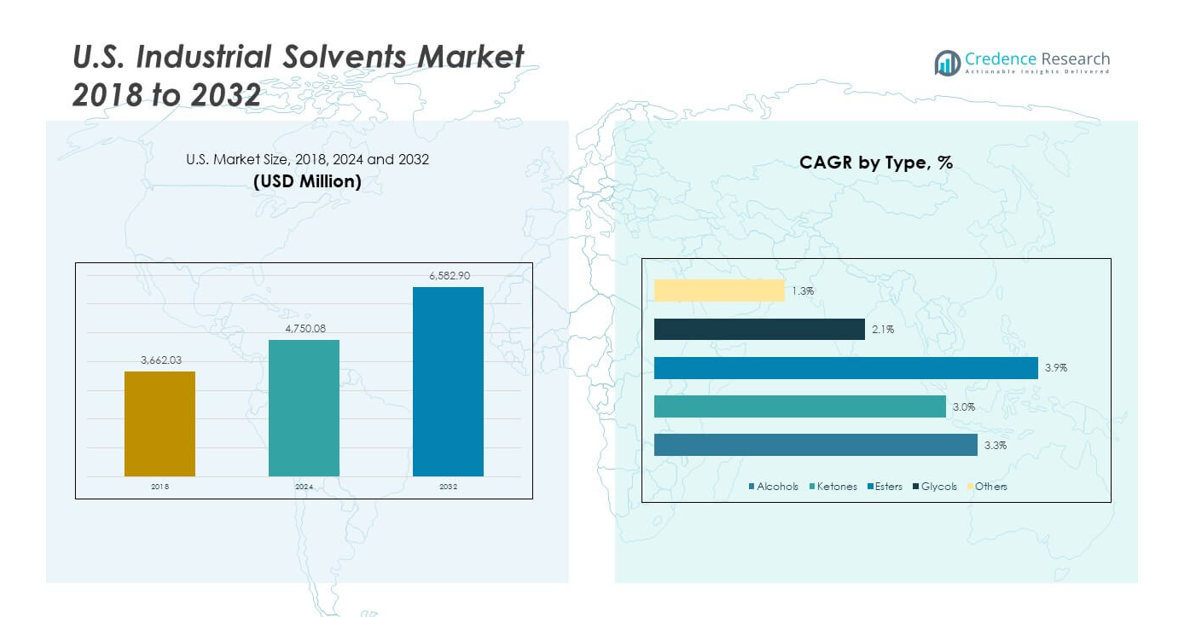
2.1. U.S. Industrial Solvents Market Snapshot 21
2.1.1. U.S. Industrial Solvents Market, 2018 – 2032 (USD Million) and Volume (Kilotons (KT)) 22
CHAPTER NO. 3 : U.S. INDUSTRIAL SOLVENTS MARKET – INDUSTRY ANALYSIS 23
3.1. Introduction 23
3.2. Market Drivers 24
3.2.1. Rising Demand Across End-Use Industries Such as Pharmaceuticals, Paints & Coatings, and Electronics 24
3.2.2. Increasing Adoption of Bio-Based and Green Solvents Driven by Environmental Sustainability 25
3.3. Market Restraints 26
3.3.1. Stringent Environmental and Health Regulations Limiting the Use of Traditional Solvents 26
3.4. Market Opportunities 27
3.4.1. Market Opportunity Analysis 27
3.5. Porter’s Five Forces Analysis 28
CHAPTER NO. 4 : IMPORT EXPORT ANALYSIS 29
4.1. Import Analysis by U.S. 29
4.1.1. U.S. XXXX Market Import Revenue, By U.S., 2018 – 2023 29
4.2. Export Analysis by U.S. 30
4.2.1. U.S. XXXX Market Export Revenue, By U.S., 2018 – 2023 30
CHAPTER NO. 5 : PRICE ANALYSIS 31
5.1. Price Analysis by Type 31
5.1.1. U.S. Industrial Solvents Market Price, By Type, 2018 – 2023 31
5.1.2. U.S. Industrial Solvents Market Price, By Type, 2018 – 2023 31
CHAPTER NO. 6 : ANALYSIS COMPETITIVE LANDSCAPE 32
6.1. Company Market Share Analysis – 2024 32
6.1.1. U.S. Industrial Solvents Market: Company Market Share, by Revenue, 2024 32
6.1.2. U.S. Industrial Solvents Market: Top 6 Company Market Share, by Revenue, 2024 32
6.1.3. U.S. Industrial Solvents Market: Top 3 Company Market Share, by Revenue, 2024 33
6.2. U.S. Industrial Solvents Market Company Revenue Market Share, 2024 34
6.3. Company Assessment Metrics, 2024 35
6.3.1. Stars 35
6.3.2. Emerging Leaders 35
6.3.3. Pervasive Players 35
6.3.4. Participants 35
6.4. Start-ups /SMEs Assessment Metrics, 2024 35
6.4.1. Progressive Companies 35
6.4.2. Responsive Companies 35
6.4.3. Dynamic Companies 35
6.4.4. Starting Blocks 35
6.5. Strategic Developments 36
6.5.1. Acquisitions & Mergers 36
New Product Launch 36
U.S. Expansion 36
6.6. Key Players Product Matrix 37
CHAPTER NO. 7 : PESTEL & ADJACENT MARKET ANALYSIS 38
7.1. PESTEL 38
7.1.1. Political Factors 38
7.1.2. Economic Factors 38
7.1.3. Social Factors 38
7.1.4. Technological Factors 38
7.1.5. Environmental Factors 38
7.1.6. Legal Factors 38
7.2. Adjacent Market Analysis 38
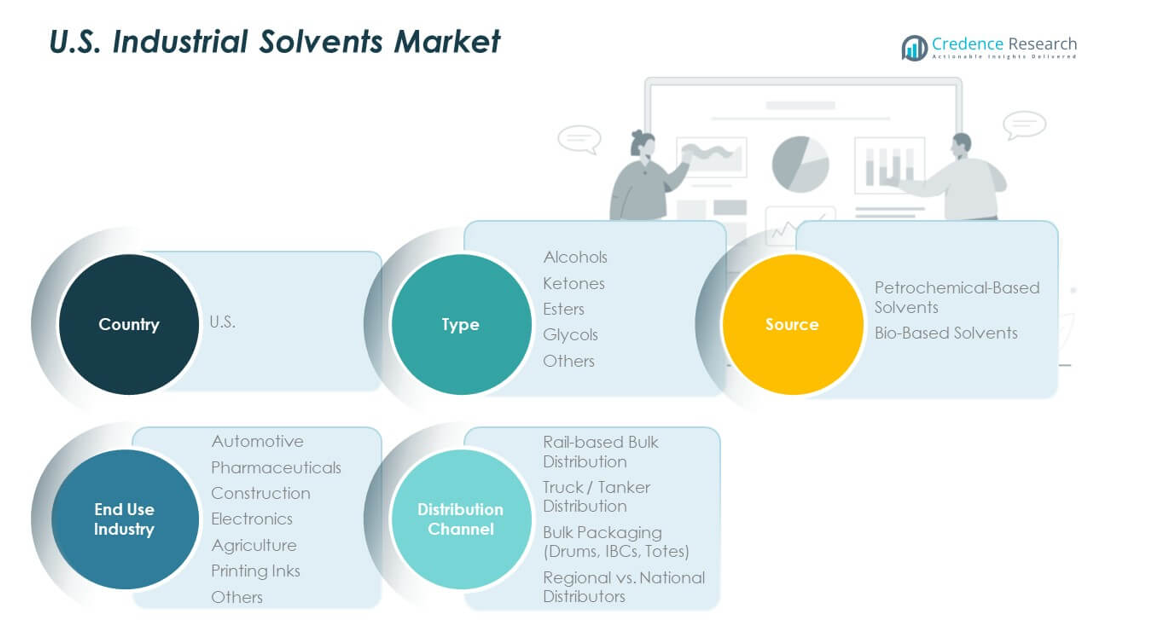
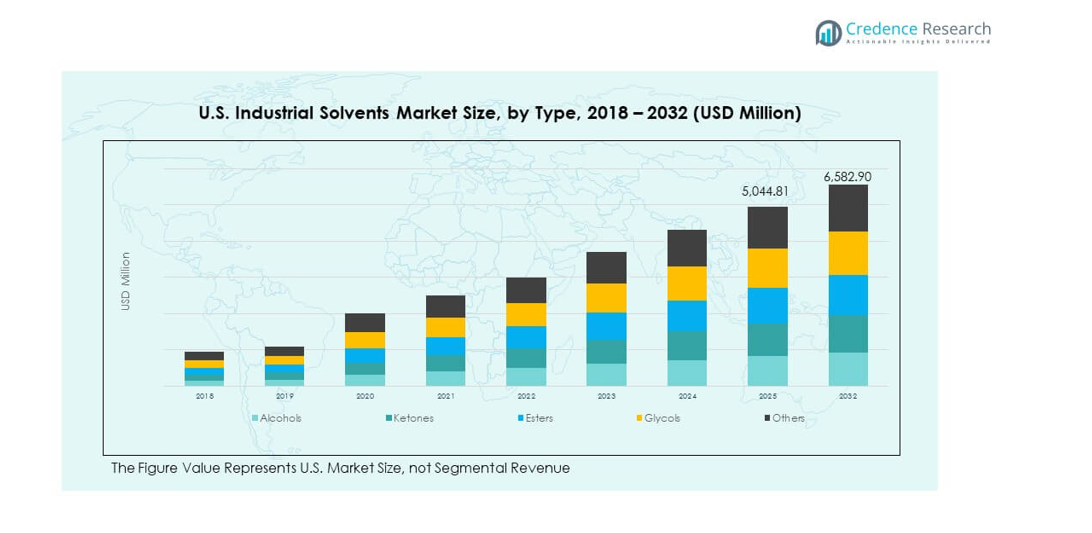
CHAPTER NO. 8 : U.S. INDUSTRIAL SOLVENTS MARKET – BY TYPE SEGMENT ANALYSIS 39
8.1. U.S. Industrial Solvents Market Overview, by Type Segment 39
8.1.1. U.S. Industrial Solvents Market Revenue Share, By Type, 2023 & 2032 40
8.1.2. U.S. Industrial Solvents Market Attractiveness Analysis, By Type 41
8.1.3. Incremental Revenue Growth Opportunity, by Type, 2024 – 2032 41
8.1.4. U.S. Industrial Solvents Market Revenue, By Type, 2018, 2023, 2027 & 2032 42
8.2. Alcohols 43
8.3. Ketones 44
8.4. Esters 45
8.5. Glycols 46
8.6. Others 47
CHAPTER NO. 9 : U.S. INDUSTRIAL SOLVENTS MARKET – BY SOURCE SEGMENT ANALYSIS 48
9.1. U.S. Industrial Solvents Market Overview, by Source Segment 48
9.1.1. U.S. Industrial Solvents Market Revenue Share, By Source, 2023 & 2032 49
9.1.2. U.S. Industrial Solvents Market Attractiveness Analysis, By Source 50
9.1.3. Incremental Revenue Growth Opportunity, by Source, 2024 – 2032 50
9.1.4. U.S. Industrial Solvents Market Revenue, By Source, 2018, 2023, 2027 & 2032 51
9.2. Petrochemical-Based Solvents 52
9.3. Bio-Based Solvents 53
CHAPTER NO. 10 : U.S. INDUSTRIAL SOLVENTS MARKET – BY END USER INDUSTRY SEGMENT ANALYSIS 54
10.1. U.S. Industrial Solvents Market Overview, by End User Industry Segment 54
10.1.1. U.S. Industrial Solvents Market Revenue Share, By End User Industry, 2023 & 2032 55
10.1.2. U.S. Industrial Solvents Market Attractiveness Analysis, By End User Industry 56
10.1.3. Incremental Revenue Growth Opportunity, by End User Industry, 2024 – 2032 56
10.1.4. U.S. Industrial Solvents Market Revenue, By End User Industry, 2018, 2023, 2027 & 2032 57
10.2. Automotive 58
10.3. Pharmaceuticals 59
10.4. Construction 60
10.5. Electronics 61
10.6. Agriculture 62
10.7. Printing Inks 63
10.8. Others 64
CHAPTER NO. 11 : U.S. INDUSTRIAL SOLVENTS MARKET – BY DISTRIBUTION CHANNEL SEGMENT ANALYSIS 65
11.1. U.S. Industrial Solvents Market Overview, by Distribution Channel Segment 65
11.1.1. U.S. Industrial Solvents Market Revenue Share, By Distribution Channel, 2023 & 2032 66
11.1.2. U.S. Industrial Solvents Market Attractiveness Analysis, By Distribution Channel 67
11.1.3. Incremental Revenue Growth Opportunity, by Distribution Channel, 2024 – 2032 67
11.1.4. U.S. Industrial Solvents Market Revenue, By Distribution Channel, 2018, 2023, 2027 & 2032 68
11.2. Rail-based Bulk Distribution 69
11.3. Truck / Tanker Distribution 70
11.4. Bulk Packaging (Drums, IBCs, Totes) 71
11.5. Regional vs. National Distributors 72
CHAPTER NO. 12 : U.S. INDUSTRIAL SOLVENTS MARKET – ANALYSIS 73
12.1. Type 73
12.1.1. U.S. Industrial Solvents Market Revenue, By Type, 2018 – 2023 (USD Million) 73
12.1.2. U.S. Industrial Solvents Market Revenue, By Type, 2024 – 2032 (USD Million) 74
12.1.3. U.S. Industrial Solvents Market Volume, By Type, 2018 – 2023 (Kilotons (KT)) 75
12.1.4. U.S. Industrial Solvents Market Volume and Volume, By Type, 2024 – 2032 (Kilotons (KT)) 76
12.2. Source 77
12.2.1. U.S. Industrial Solvents Market Revenue, By Source, 2018 – 2023 (USD Million) 77
12.2.2. U.S. Industrial Solvents Market Revenue, By Source, 2024 – 2032 (USD Million) 77
12.2.3. U.S. Industrial Solvents Market Volume, By Source, 2018 – 2023 (Kilotons (KT)) 78
12.2.4. U.S. Industrial Solvents Market Volume, By Source, 2024 – 2032 (Kilotons (KT)) 78
12.3. End User Industry 79
12.3.1. U.S. Industrial Solvents Market Revenue, By End User Industry, 2018 – 2023 (USD Million) 79
12.3.2. U.S. Industrial Solvents Market Revenue, By End User Industry, 2024 – 2032 (USD Million) 79
12.3.3. U.S. Industrial Solvents Market Volume, By End User Industry, 2018 – 2023 (Kilotons (KT)) 80
12.3.4. U.S. Industrial Solvents Market Volume, By End User Industry, 2024 – 2032 (Kilotons (KT)) 80
12.4. Distribution Channel 81
12.4.1. U.S. Industrial Solvents Market Revenue, By Distribution Channel, 2018 – 2023 (USD Million) 81
12.4.2. U.S. Industrial Solvents Market Revenue, By Distribution Channel, 2024 – 2032 (USD Million) 81
12.4.3. U.S. Industrial Solvents Market Volume, By Distribution Channel, 2018 – 2023 (Kilotons (KT)) 82
12.4.4. U.S. Industrial Solvents Market Volume, By Distribution Channel, 2024 – 2032 (Kilotons (KT)) 82
CHAPTER NO. 13 : COMPANY PROFILES 83
13.1. Univar Solutions 83
13.1.1. Company Overview 83
13.1.2. Product Portfolio 83
13.1.3. Swot Analysis 83
13.1.4. Business Strategy 84
13.1.5. Financial Overview 84
13.2. Brenntag 85
13.3. Nexeo Plastics / Solvents 85
13.4. CCI Chemical 85
13.5. Calumet 85
13.6. SolvChem 85
13.7. Ellis & Everard 85
13.8. Company 8 85
13.9. Company 9 85
13.10. Company 10 85
List of Figures
FIG NO. 1. U.S. Industrial Solvents Market Revenue, 2018 – 2032 (USD Million) and Volume (Kilotons (KT)) 22
FIG NO. 2. Porter’s Five Forces Analysis for U.S. Industrial Solvents Market 28
FIG NO. 3. U.S. XXXX Market Import Revenue, By U.S., 2018 – 2023 29
FIG NO. 4. U.S. XXXX Market Export Revenue, By U.S., 2018 – 2023 30
FIG NO. 5. U.S. Industrial Solvents Market Price, By Type, 2018 – 2023 31
FIG NO. 6. Company Share Analysis, 2024 32
FIG NO. 7. Company Share Analysis, 2024 32
FIG NO. 8. Company Share Analysis, 2024 33
FIG NO. 9. U.S. Industrial Solvents Market – Company Revenue Market Share, 2024 34
FIG NO. 10. U.S. Industrial Solvents Market Revenue Share, By Type, 2023 & 2032 40
FIG NO. 11. Market Attractiveness Analysis, By Type 41
FIG NO. 12. Incremental Revenue Growth Opportunity by Type, 2024 – 2032 41
FIG NO. 13. U.S. Industrial Solvents Market Revenue, By Type, 2018, 2023, 2027 & 2032 42
FIG NO. 14. U.S. Industrial Solvents Market for Alcohols, Revenue (USD Million) 2018 – 2032 43
FIG NO. 15. U.S. Industrial Solvents Market for Ketones, Revenue (USD Million) 2018 – 2032 44
FIG NO. 16. U.S. Industrial Solvents Market for Esters, Revenue (USD Million) 2018 – 2032 45
FIG NO. 17. U.S. Industrial Solvents Market for Glycols, Revenue (USD Million) 2018 – 2032 46
FIG NO. 18. U.S. Industrial Solvents Market for Others, Revenue (USD Million) 2018 – 2032 47
FIG NO. 19. U.S. Industrial Solvents Market Revenue Share, By Source, 2023 & 2032 49
FIG NO. 20. Market Attractiveness Analysis, By Source 50
FIG NO. 21. Incremental Revenue Growth Opportunity by Source, 2024 – 2032 50
FIG NO. 22. U.S. Industrial Solvents Market Revenue, By Source, 2018, 2023, 2027 & 2032 51
FIG NO. 23. U.S. Industrial Solvents Market for Petrochemical-Based Solvents, Revenue (USD Million) 2018 – 2032 52
FIG NO. 24. U.S. Industrial Solvents Market for Bio-Based Solvents, Revenue (USD Million) 2018 – 2032 53
FIG NO. 25. U.S. Industrial Solvents Market Revenue Share, By End User Industry, 2023 & 2032 55
FIG NO. 26. Market Attractiveness Analysis, By End User Industry 56
FIG NO. 27. Incremental Revenue Growth Opportunity by End User Industry, 2024 – 2032 56
FIG NO. 28. U.S. Industrial Solvents Market Revenue, By End User Industry, 2018, 2023, 2027 & 2032 57
FIG NO. 29. U.S. Industrial Solvents Market for Automotive, Revenue (USD Million) and Volume (Kilotons (KT)) 2018 – 2032 58
FIG NO. 30. U.S. Industrial Solvents Market for Pharmaceuticals, Revenue (USD Million) 2018 – 2032 59
FIG NO. 31. U.S. Industrial Solvents Market for Construction, Revenue (USD Million) 2018 – 2032 60
FIG NO. 32. U.S. Industrial Solvents Market for Electronics, Revenue (USD Million) 2018 – 2032 61
FIG NO. 33. U.S. Industrial Solvents Market for Agriculture, Revenue (USD Million) 2018 – 2032 62
FIG NO. 34. U.S. Industrial Solvents Market for Printing Inks, Revenue (USD Million) 2018 – 2032 63
FIG NO. 35. U.S. Industrial Solvents Market for Others, Revenue (USD Million) 2018 – 2032 64
FIG NO. 36. U.S. Industrial Solvents Market Revenue Share, By Distribution Channel, 2023 & 2032 66
FIG NO. 37. Market Attractiveness Analysis, By Distribution Channel 67
FIG NO. 38. Incremental Revenue Growth Opportunity by Distribution Channel, 2024 – 2032 67
FIG NO. 39. U.S. Industrial Solvents Market Revenue, By Distribution Channel, 2018, 2023, 2027 & 2032 68
FIG NO. 40. U.S. Industrial Solvents Market for Rail-based Bulk Distribution, Revenue (USD Million) and Volume (Kilotons (KT)) 2018 – 2032 69
FIG NO. 41. U.S. Industrial Solvents Market for Truck / Tanker Distribution, Revenue (USD Million) 2018 – 2032 70
FIG NO. 42. U.S. Industrial Solvents Market for Bulk Packaging (Drums, IBCs, Totes), Revenue (USD Million) 2018 – 2032 71
FIG NO. 43. U.S. Industrial Solvents Market for Regional vs. National Distributors, Revenue (USD Million) 2018 – 2032 72
List of Tables
TABLE NO. 1. : U.S. Industrial Solvents Market: Snapshot 21
TABLE NO. 2. : Drivers for the U.S. Industrial Solvents Market: Impact Analysis 24
TABLE NO. 3. : Restraints for the U.S. Industrial Solvents Market: Impact Analysis 26
TABLE NO. 4. : U.S. Industrial Solvents Market Revenue, By Type, 2018 – 2023 31
TABLE NO. 5. : U.S. Industrial Solvents Market Revenue, By Type, 2018 – 2023 (USD Million) 73
TABLE NO. 6. : U.S. Industrial Solvents Market Revenue, By Type, 2024 – 2032 (USD Million) 74
TABLE NO. 7. : U.S. Industrial Solvents Market Volume, By Type, 2018 – 2023 (Kilotons (KT)) 75
TABLE NO. 8. : U.S. Industrial Solvents Market Volume, By Type, 2024 – 2032 (Kilotons (KT)) 76
TABLE NO. 9. : U.S. Industrial Solvents Market Revenue, By Source, 2018 – 2023 (USD Million) 77
TABLE NO. 10. : U.S. Industrial Solvents Market Revenue, By Source, 2024 – 2032 (USD Million) 77
TABLE NO. 11. : U.S. Industrial Solvents Market Volume, By Source, 2018 – 2023 (Kilotons (KT)) 78
TABLE NO. 12. : U.S. Industrial Solvents Market Volume, By Source, 2024 – 2032 (Kilotons (KT)) 78
TABLE NO. 13. : U.S. Industrial Solvents Market Revenue, By End User Industry, 2018 – 2023 (USD Million) 79
TABLE NO. 14. : U.S. Industrial Solvents Market Revenue, By End User Industry, 2024 – 2032 (USD Million) 79
TABLE NO. 15. : U.S. Industrial Solvents Market Volume, By End User Industry, 2018 – 2023 (Kilotons (KT)) 80
TABLE NO. 16. : U.S. Industrial Solvents Market Volume, By End User Industry, 2024 – 2032 (Kilotons (KT)) 80
TABLE NO. 17. : U.S. Industrial Solvents Market Revenue, By Distribution Channel, 2018 – 2023 (USD Million) 81
TABLE NO. 18. : U.S. Industrial Solvents Market Revenue, By Distribution Channel, 2024 – 2032 (USD Million) 81
TABLE NO. 19. : U.S. Industrial Solvents Market Volume, By Distribution Channel, 2018 – 2023 (Kilotons (KT)) 82
TABLE NO. 20. : U.S. Industrial Solvents Market Volume, By Distribution Channel, 2024 – 2032 (Kilotons (KT)) 82