CHAPTER NO. 1 : INTRODUCTION 16
1.1.1. Report Description 16
Purpose of the Report 17
USP & Key Product 17
1.1.2. Key Benefits for Stakeholders 17
1.1.3. Target Audience 18
1.1.4. Report Scope 18
CHAPTER NO. 2 : EXECUTIVE SUMMARY 19
2.1. Cardiovascular Devices Market Snapshot 19
2.1.1. U.S. Cardiovascular Devices Market, 2018 – 2032 (USD Million) 20
CHAPTER NO. 3 : GEOPOLITICAL CRISIS IMPACT ANALYSIS 21
3.1. Russia-Ukraine and Israel-Palestine War Impacts 21
CHAPTER NO. 4 : CARDIOVASCULAR DEVICES MARKET – INDUSTRY ANALYSIS 22
4.1. Introduction 22
4.2. Market Drivers 23
4.2.1. Driving Factor 1 Analysis 23
4.2.2. Driving Factor 2 Analysis 24
4.3. Market Restraints 25
4.3.1. Restraining Factor Analysis 25
4.4. Market Opportunities 26
4.4.1. Market Opportunities Analysis 26
4.5. Porter’s Five Force analysis 27
4.6. Value Chain Analysis 28
4.7. Buying Criteria 29
CHAPTER NO. 5 : ANALYSIS COMPETITIVE LANDSCAPE 30
5.1. Company Market Share Analysis – 2023 30
5.1.1. U.S. Cardiovascular Devices Market: Company Market Share, by Revenue, 2023 30
5.1.2. U.S. Cardiovascular Devices Market: Top 6 Company Market Share, by Revenue, 2023 30
5.1.3. U.S. Cardiovascular Devices Market: Top 3 Company Market Share, by Revenue, 2023 31
5.2. U.S. Cardiovascular Devices Market Company Revenue Market Share, 2023 32
5.3. Company Assessment Metrics, 2023 33
5.3.1. Stars 33
5.3.2. Emerging Leaders 33
5.3.3. Pervasive Players 33
5.3.4. Participants 33
5.4. Start-ups /Code Assessment Metrics, 2023 33
5.4.1. Progressive Companies 33
5.4.2. Responsive Companies 33
5.4.3. Dynamic Companies 33
5.4.4. Starting Blocks 33
5.5. Strategic Developments 34
5.5.1. Acquisition & Mergers 34
New Product Launch 34
Regional Expansion 34
5.6. Key Players Product Matrix 35
CHAPTER NO. 6 : PESTEL & ADJACENT MARKET ANALYSIS 36
6.1. PESTEL 36
6.1.1. Political Factors 36
6.1.2. Economic Factors 36
6.1.3. Social Factors 36
6.1.4. Technological Factors 36
6.1.5. Environmental Factors 36
6.1.6. Legal Factors 36
6.2. Adjacent Market Analysis 36
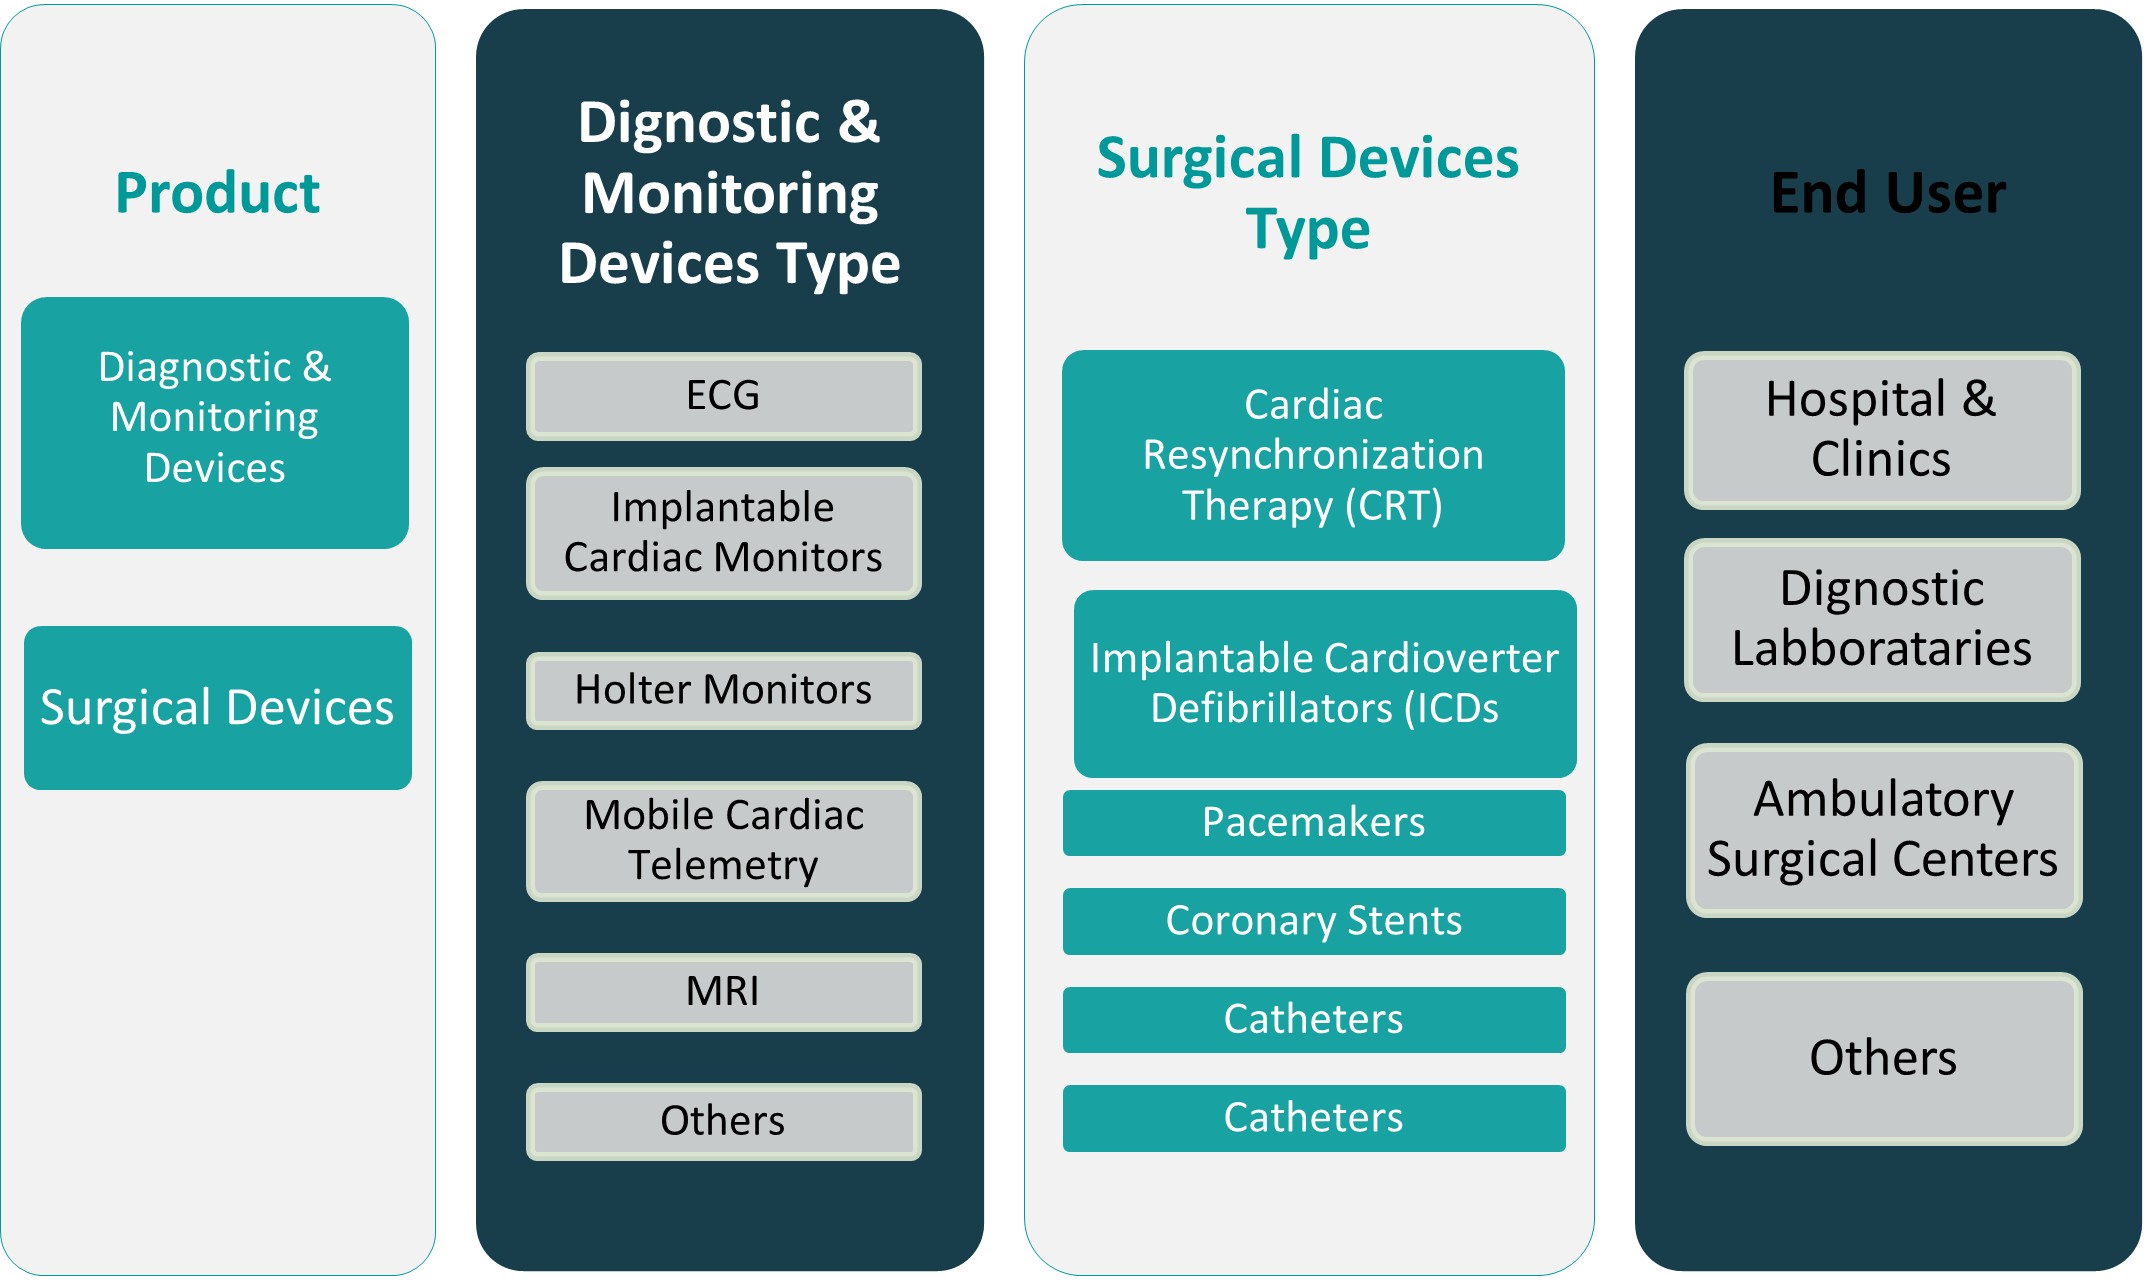
CHAPTER NO. 7 : CARDIOVASCULAR DEVICES MARKET – BY PRODUCT SEGMENT ANALYSIS 37
7.1. Cardiovascular Devices Market Overview, by Product Segment 37
7.1.1. Cardiovascular Devices Market Revenue Share, By Product, 2023 & 2032 38
7.1.2. Cardiovascular Devices Market Attractiveness Analysis, By Product 39
7.1.3. Incremental Revenue Growth Opportunities, by Product, 2024 – 2032 39
7.1.4. Cardiovascular Devices Market Revenue, By Product, 2018, 2023, 2027 & 2032 40
7.2. Diagnostic & Monitoring Devices 41
7.2.1. U.S. Cardiovascular Devices Market Revenue, By Diagnostic & Monitoring Device Types, 2018 – 2023 (USD Million) 42
7.2.1. U.S. Cardiovascular Devices Market Revenue, By Diagnostic & Monitoring Device Types, 2018 – 2023 (USD Million) 42
7.3. Surgical Devices 43
7.3.1. U.S. Cardiovascular Devices Market Revenue, By Surgical Devices Types, 2018 – 2023 (USD Million) 44
7.3.2. U.S. Cardiovascular Devices Market Revenue, By Surgical Devices Types, 2018 – 2023 (USD Million) 44
CHAPTER NO. 8 : CARDIOVASCULAR DEVICES MARKET – BY END USER SEGMENT ANALYSIS 45
8.1. Cardiovascular Devices Market Overview, by End User Segment 45
8.1.1. Cardiovascular Devices Market Revenue Share, By End User, 2023 & 2032 46
8.1.2. Cardiovascular Devices Market Attractiveness Analysis, By End User 47
8.1.3. Incremental Revenue Growth Opportunities, by End User, 2024 – 2032 47
8.1.4. Cardiovascular Devices Market Revenue, By End User, 2018, 2023, 2027 & 2032 48
8.2. Hospitals & Clinics 49
8.3. Diagnostic Laboratories 50
8.4. Ambulatory Surgical Centers 51
8.5. Others 52
CHAPTER NO. 9 : CARDIOVASCULAR DEVICES MARKET – U.S. 53
9.1. U.S. 53
9.1.1. Key Highlights 53
9.1.2. U.S. Cardiovascular Devices Market Revenue, By Country, 2018 – 2023 (USD Million) 54
9.2. Product 55
9.3. U.S. Cardiovascular Devices Market Revenue, By Product, 2018 – 2023 (USD Million) 55
9.4. U.S. Cardiovascular Devices Market Revenue, By Product, 2024 – 2032 (USD Million) 55
9.5. Diagnostic & Monitoring Device Types 56
9.5.1. U.S. Cardiovascular Devices Market Revenue, By Diagnostic & Monitoring Device Types, 2018 – 2023 (USD Million) 56
9.5.2. U.S. Cardiovascular Devices Market Revenue, By Diagnostic & Monitoring Device Types, 2018 – 2023 (USD Million) 56
9.6. Surgical Devices Types 57
9.6.1. U.S. Cardiovascular Devices Market Revenue, By Surgical Devices Types, 2018 – 2023 (USD Million) 57
9.6.2. U.S. Cardiovascular Devices Market Revenue, By Surgical Devices Types, 2018 – 2023 (USD Million) 57
9.7. End User 58
9.7.1. U.S. Cardiovascular Devices Market Revenue, By End User, 2018 – 2023 (USD Million) 58
9.7.2. U.S. Cardiovascular Devices Market Revenue, By End User, 2024 – 2032 (USD Million) 58
CHAPTER NO. 10 : COMPANY PROFILES 59
10.1. Abbott 59
10.1.1. Company Overview 59
10.1.2. Product Portfolio 59
10.1.3. Swot Analysis 59
10.1.4. Business Strategy 60
10.1.5. Financial Overview 60
10.2. GE HealthCare 61
10.3. Edwards Lifesciences Corporation 61
10.4. W. L. Gore & Associates, Inc. 61
10.5. Siemens Healthcare GmbH 61
10.6. BIOTRONIK SE & Co. KG 61
10.7. Canon Medical Systems Asia Pte. Ltd. 61
10.8. B. Braun SE 61
10.9. LivaNova PLC 61
10.10. Cardinal Health 61
10.11. Medtronic 61
10.12. Boston Scientific Corporation 61
10.13. Koninklijke Philips N.V., 61
10.14. Johnson & Johnson Services, Inc. 61
10.15. Baxter International Inc. 61
10.16. Others 61
]
List of Figures
FIG NO. 1. U.S. Cardiovascular Devices Market Revenue, 2018 – 2032 (USD Million) 20
FIG NO. 2. Porter’s Five Forces Analysis for U.S. Cardiovascular Devices Market 27
FIG NO. 3. Value Chain Analysis for U.S. Cardiovascular Devices Market 28
FIG NO. 4. Company Share Analysis, 2023 30
FIG NO. 5. Company Share Analysis, 2023 30
FIG NO. 6. Company Share Analysis, 2023 31
FIG NO. 7. Cardiovascular Devices Market – Company Revenue Market Share, 2023 32
FIG NO. 8. Cardiovascular Devices Market Revenue Share, By Product, 2023 & 2032 38
FIG NO. 9. Market Attractiveness Analysis, By Product 39
FIG NO. 10. Incremental Revenue Growth Opportunities by Product, 2024 – 2032 39
FIG NO. 11. Cardiovascular Devices Market Revenue, By Product, 2018, 2023, 2027 & 2032 40
FIG NO. 12. U.S. Cardiovascular Devices Market for Diagnostic & Monitoring Devices, Revenue (USD Million) 2018 – 2032 41
FIG NO. 13. U.S. Cardiovascular Devices Market for Surgical Devices, Revenue (USD Million) 2018 – 2032 43
FIG NO. 14. Cardiovascular Devices Market Revenue Share, By End User, 2023 & 2032 46
FIG NO. 15. Market Attractiveness Analysis, By End User 47
FIG NO. 16. Incremental Revenue Growth Opportunities by End User, 2024 – 2032 47
FIG NO. 17. Cardiovascular Devices Market Revenue, By End User, 2018, 2023, 2027 & 2032 48
FIG NO. 18. U.S. Cardiovascular Devices Market for Hospitals & Clinics, Revenue (USD Million) 2018 – 2032 49
FIG NO. 19. U.S. Cardiovascular Devices Market for Diagnostic Laboratories, Revenue (USD Million) 2018 – 2032 50
FIG NO. 20. U.S. Cardiovascular Devices Market for Ambulatory Surgical Centers, Revenue (USD Million) 2018 – 2032 51
FIG NO. 21. U.S. Cardiovascular Devices Market for Others, Revenue (USD Million) 2018 – 2032 52
FIG NO. 22. U.S. Cardiovascular Devices Market Revenue, 2018 – 2032 (USD Million) 53
List of Tables
TABLE NO. 1. : U.S. Cardiovascular Devices Market: Snapshot 19
TABLE NO. 2. : Drivers for the Cardiovascular Devices Market: Impact Analysis 23
TABLE NO. 3. : Restraints for the Cardiovascular Devices Market: Impact Analysis 25
TABLE NO. 4. : U.S. Cardiovascular Devices Market Revenue, By Diagnostic & Monitoring Device Types, 2018 – 2023 (USD Million) 42
TABLE NO. 5. : U.S. Cardiovascular Devices Market Revenue, By Diagnostic & Monitoring Device Types, 2018 – 2023 (USD Million) 42
TABLE NO. 6. : U.S. Cardiovascular Devices Market Revenue, By Surgical Devices Types, 2018 – 2023 (USD Million) 44
TABLE NO. 7. : U.S. Cardiovascular Devices Market Revenue, By Surgical Devices Types, 2018 – 2023 (USD Million) 44
TABLE NO. 8. : U.S. Cardiovascular Devices Market Revenue, By Country, 2018 – 2023 (USD Million) 54
TABLE NO. 9. : U.S. Cardiovascular Devices Market Revenue, By Country, 2024 – 2032 (USD Million) 54
TABLE NO. 10. : U.S. Cardiovascular Devices Market Revenue, By Product, 2018 – 2023 (USD Million) 55
TABLE NO. 11. : U.S. Cardiovascular Devices Market Revenue, By Product, 2024 – 2032 (USD Million) 55
TABLE NO. 12. : U.S. Cardiovascular Devices Market Revenue, By Diagnostic & Monitoring Device Types, 2018 – 2023 (USD Million) 56
TABLE NO. 13. : U.S. Cardiovascular Devices Market Revenue, By Diagnostic & Monitoring Device Types, 2018 – 2023 (USD Million) 56
TABLE NO. 14. : U.S. Cardiovascular Devices Market Revenue, By Surgical Devices Types, 2018 – 2023 (USD Million) 57
TABLE NO. 15. : U.S. Cardiovascular Devices Market Revenue, By Surgical Devices Types, 2018 – 2023 (USD Million) 57
TABLE NO. 16. : U.S. Cardiovascular Devices Market Revenue, By End User, 2018 – 2023 (USD Million) 58
TABLE NO. 17. : U.S. Cardiovascular Devices Market Revenue, By End User, 2024 – 2032 (USD Million) 58