
Market Overview:
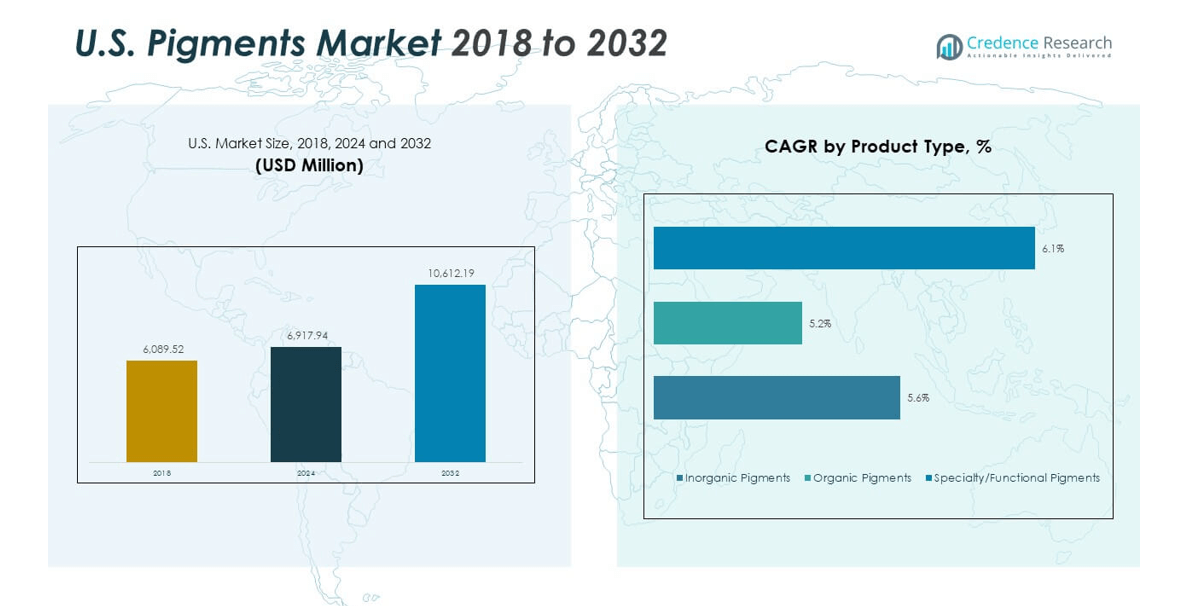
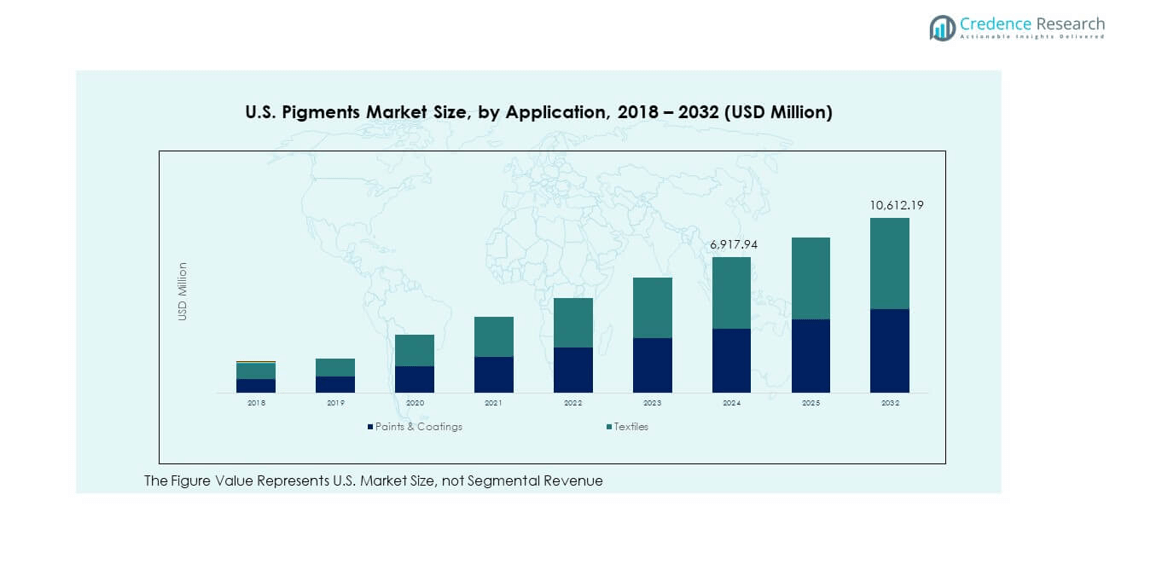
The U.S. Pigments Market size was valued at USD 6,089.52 million in 2018 to USD 6,917.94 million in 2024 and is anticipated to reach USD 10,612.19 million by 2032, at a CAGR of 5.49% during the forecast period.
| REPORT ATTRIBUTE | DETAILS |
|---|---|
| Historical Period | 2020-2023 |
| Base Year | 2024 |
| Forecast Period | 2025-2032 |
| U.S. Pigments Market Size 2024 | USD 6,917.94 million |
| U.S. Pigments Market, CAGR | 5.49% |
| U.S. Pigments Market Size 2032 | USD 10,612.19 million |
Market growth is driven by expanding applications across coatings, plastics, packaging, and construction industries. Rising consumer preference for eco-friendly and bio-based pigments fuels innovation in non-toxic formulations. Manufacturers focus on improving color strength, dispersion, and durability to meet the evolving standards of automotive and industrial coatings. Increasing investments in high-performance pigments enhance product quality and operational efficiency across various sectors.
The Midwest and South lead the U.S. pigments market, supported by strong industrial bases and construction activities. The Midwest benefits from established automotive and manufacturing clusters, while the South experiences high demand from packaging and infrastructure sectors. The Northeast region shows steady growth, supported by printing and specialty coating applications. The West, particularly California, records growing adoption of sustainable pigment technologies aligned with environmental regulations. Each region contributes uniquely to the market, reflecting diverse industrial strengths and regional consumption trends.
Market Insights
- The U.S. Pigments Market was valued at USD 6,089.52 million in 2018, reached USD 6,917.94 million in 2024, and is projected to hit USD 10,612.19 million by 2032, registering a CAGR of 5.49%.
- The Midwest holds 31% of the market share, supported by its strong automotive and industrial manufacturing base, which drives steady demand for coatings and titanium dioxide pigments.
- The South accounts for 28% share, driven by expanding construction and packaging sectors fueled by infrastructure projects and favorable industrial policies.
- The West represents 19% and stands as the fastest-growing region, propelled by high adoption of sustainable pigments and the rise of eco-focused regulations in California.
- Paints & coatings dominate with roughly 60% of total pigment consumption, while textiles represent about 40%, highlighting coatings’ central role in industrial and architectural applications.
Market Drivers
Rising Demand for High-Performance Pigments Across Coatings and Automotive Applications
The U.S. Pigments Market experiences strong growth driven by the demand for high-performance pigments in coatings and automotive sectors. These pigments enhance durability, gloss, and color stability, meeting consumer and industrial needs for premium finishes. Manufacturers are investing in advanced formulations that offer superior weather resistance and heat stability. The automobile sector relies on pigment technology for UV protection and visual appeal. Stringent environmental standards encourage low-VOC pigment production. The shift toward customized color solutions expands product portfolios. Advanced dispersion techniques improve coating performance. The combination of aesthetics and sustainability strengthens market adoption.
Growing Adoption of Eco-Friendly and Bio-Based Pigments
The rising awareness of environmental sustainability accelerates the transition toward bio-based and non-toxic pigments. The U.S. Pigments Market benefits from eco-conscious consumer preferences and corporate sustainability commitments. Manufacturers develop plant-derived and low-carbon pigment alternatives. Bio-based pigments reduce reliance on petrochemical resources and align with EPA environmental standards. These pigments provide equivalent performance while lowering environmental impact. Increasing preference for circular economy models supports sustainable pigment innovation. Several producers integrate renewable feedstocks into production lines. The focus on waste reduction and clean manufacturing enhances competitiveness in regulated markets.
- For instance, Sun Chemical, a member of the DIC Group, announced in January 2024 that several of its pigment preparations achieved ECO PASSPORT by OEKO-TEX® certification with ZDHC Level 3 conformance, verifying compliance with the highest global chemical-safety and sustainability standards in textile pigment production.
Expanding Use of Pigments in Plastic and Packaging Applications
Growth in packaging and plastics manufacturing drives pigment consumption across sectors. The demand for vibrant, durable, and recyclable colorants pushes innovation in pigment technology. The U.S. Pigments Market witnesses strong demand from food-grade packaging, consumer goods, and industrial plastics. Pigments improve UV stability, surface appearance, and heat resistance of polymer-based materials. Companies focus on color uniformity and performance in flexible packaging. Compliance with FDA and ASTM standards ensures safety and consistency. Technological progress in polymer-compatible pigments supports widespread adoption. Expanding e-commerce and packaged food markets sustain pigment demand.
- For instance, Clariant’s FDA-compliant pigments for food packaging applications are designed to maintain color stability and uniform dispersion, meeting stringent safety and performance standards for flexible packaging materials as stated in the company’s official product documentation.
Technological Advancements and Automation in Pigment Production
Automation and process optimization reshape pigment manufacturing across the United States. Producers invest in digital twins, smart reactors, and predictive maintenance tools. The U.S. Pigments Market benefits from automation, which enhances precision and operational efficiency. AI-enabled monitoring ensures consistent pigment quality and reduces production waste. Process analytics optimize energy consumption and resource management. Manufacturers achieve faster formulation cycles and scalability. Integration of digital systems supports customized pigment development. The ongoing technological transformation promotes sustainable, cost-effective, and high-quality pigment output.
Market Trends
Shift Toward Nanotechnology and Smart Pigment Applications
Nanotechnology expands pigment performance across coatings, plastics, and specialty inks. The U.S. Pigments Market observes a growing preference for nano-pigments due to superior dispersion and color strength. Smart pigments, including thermochromic and photochromic variants, gain traction in packaging and security printing. These pigments change color based on environmental conditions, improving functionality and consumer interaction. Brands use them for authenticity verification and visual appeal. Enhanced UV absorption and conductivity characteristics support high-tech applications. Technological integration boosts market differentiation. Smart pigments redefine innovation in color engineering.
- For instance, LCR Hallcrest produces photochromic pigments that change color upon exposure to UV light, enabling interactive and security-focused packaging applications. The company’s officially documented pigment technologies are widely used by U.S. brands for smart labeling and product authentication.
Digitalization of Color Management and Supply Chain Integration
The digital transformation of pigment formulation processes supports faster color-matching accuracy. The U.S. Pigments Market integrates digital tools for precision in production and logistics. Automated color measurement systems reduce human error and ensure batch consistency. Cloud-based software enables collaboration between manufacturers and end users. Digital color libraries support rapid prototyping and standardization. AI-powered analytics help optimize pigment inventories and demand forecasts. Data-driven systems minimize rework rates. The convergence of digital manufacturing and supply chain transparency elevates quality standards.
- For instance, X-Rite Incorporated, a Danaher Corporation company, offers the Color iQC platform that enables precise digital color matching and quality control for pigment and coatings producers. The software helps manufacturers maintain color consistency across global production lines, as confirmed by official X-Rite product documentation.
Growing Focus on Recyclable Pigments and Circular Economy Practices
Sustainability commitments from producers accelerate the shift to recyclable pigment systems. The U.S. Pigments Market evolves with circular economy frameworks emphasizing reduced waste and improved reusability. Manufacturers explore closed-loop pigment recovery and eco-label certifications. Recycling-compatible pigments find applications in packaging, textiles, and building materials. Demand for water-based dispersions and low-energy synthesis processes continues to rise. Regulations promoting environmental compliance influence raw material sourcing. Innovations in pigment recovery technologies reduce environmental footprint. The integration of green chemistry ensures long-term resource efficiency.
Increased Penetration in 3D Printing and Additive Manufacturing
Advancements in additive manufacturing create new opportunities for pigment innovation. The U.S. Pigments Market adapts to colorants suitable for 3D printing polymers and resins. High-purity pigments improve print accuracy and visual consistency. Manufacturers develop pigments compatible with advanced filaments and resins. The need for vibrant, durable, and thermally stable colorants supports this trend. Industrial and consumer 3D printing both demand precise color control. The expansion of design flexibility enhances pigment functionality. Pigments tailored for additive processes expand beyond traditional manufacturing limits.
Market Challenges Analysis
Stringent Environmental Regulations and Compliance Pressure
The pigment manufacturing industry faces significant compliance obligations under federal and state environmental laws. The U.S. Pigments Market encounters strict limits on heavy metals, VOCs, and hazardous substances. Compliance with EPA and OSHA standards increases operational costs. Smaller manufacturers struggle to implement advanced emission-control systems. Reformulation toward eco-safe pigments requires costly R&D. Complex approval procedures delay product launches. Environmental audits and waste management practices raise administrative overheads. Maintaining consistent quality while meeting regulatory standards remains a critical challenge for the industry.
Volatile Raw Material Prices and Global Supply Disruptions
Fluctuations in raw material prices impact production economics and profit margins. The U.S. Pigments Market relies on imports for several pigment intermediates, exposing it to global supply chain disruptions. Price instability in titanium dioxide, iron oxides, and organic precursors affects cost structure. Currency fluctuations and logistic delays amplify market uncertainty. Producers are forced to maintain buffer inventories, raising working capital requirements. Limited availability of eco-friendly feedstocks adds complexity. Trade restrictions and geopolitical tensions further affect supply consistency. Industry participants must adopt flexible sourcing strategies to ensure resilience.
Market Opportunities
Rising Investment in Sustainable Pigment Technologies and Green Manufacturing
The transition toward low-carbon production models creates strong opportunities for pigment producers. The U.S. Pigments Market benefits from increasing investment in renewable and water-based pigment systems. Companies explore energy-efficient processes and bio-derived feedstocks. Partnerships between manufacturers and research institutions foster green innovation. Growing adoption of eco-certifications improves brand positioning. High consumer preference for environmentally responsible products expands demand. Regulatory incentives encourage sustainability-driven production. The focus on clean technology fosters competitiveness in domestic and export markets.
Expansion in Construction and Industrial Coatings Sectors
Infrastructure modernization and residential development strengthen pigment demand in construction coatings. The U.S. Pigments Market finds growth prospects in industrial and architectural applications. Pigments enhance color stability, corrosion resistance, and UV durability in surface coatings. Energy-efficient reflective pigments gain adoption for sustainable buildings. Expanding renovation projects drive consistent product consumption. Industrial coatings with functional pigments meet safety and aesthetic standards. Long-term government spending on infrastructure supports continuous pigment application. Demand for durable pigments in smart cities reinforces market momentum.
Market Segmentation Analysis
By Product Type
Inorganic pigments dominate the U.S. Pigments Market, driven by titanium dioxide’s strong opacity and light-scattering characteristics. Titanium dioxide holds a major share in coatings, plastics, and construction materials due to its brightness and durability. Zinc oxide also gains demand in ceramics, cosmetics, and rubber applications. Organic pigments witness steady adoption for high-color-strength printing inks and packaging products. Specialty pigments such as effect and functional pigments cater to advanced needs like infrared reflection and luminescence. Increasing industrial diversification sustains demand across all pigment types.
- For instance, Kronos Worldwide, Inc. expanded production efficiency at its Louisiana Pigment Company facility after fully acquiring Venator’s 50% stake in 2024, enhancing titanium dioxide output and supply reliability across North America.
By Application
Paints and coatings lead the U.S. Pigments Market, fueled by construction and automotive refinishing demand. Pigments improve UV resistance, gloss, and color intensity in exterior and industrial coatings. The plastics segment also expands due to rising usage in packaging and consumer goods. Printing inks rely on organic pigments for high-definition color reproduction. The textile and leather industries incorporate pigments to achieve lasting shades and superior fabric finish. Other applications include paper, ceramics, and electronics where optical precision matters. Broad industrial consumption secures consistent market growth.
- For instance, The Chemours Company enhanced its Ti-Pure™ Titanium Dioxide pigment technology for coatings, improving dispersion stability and durability in architectural and automotive paints, as confirmed in its 2025 product innovation updates.
Segmentation
By Product Type
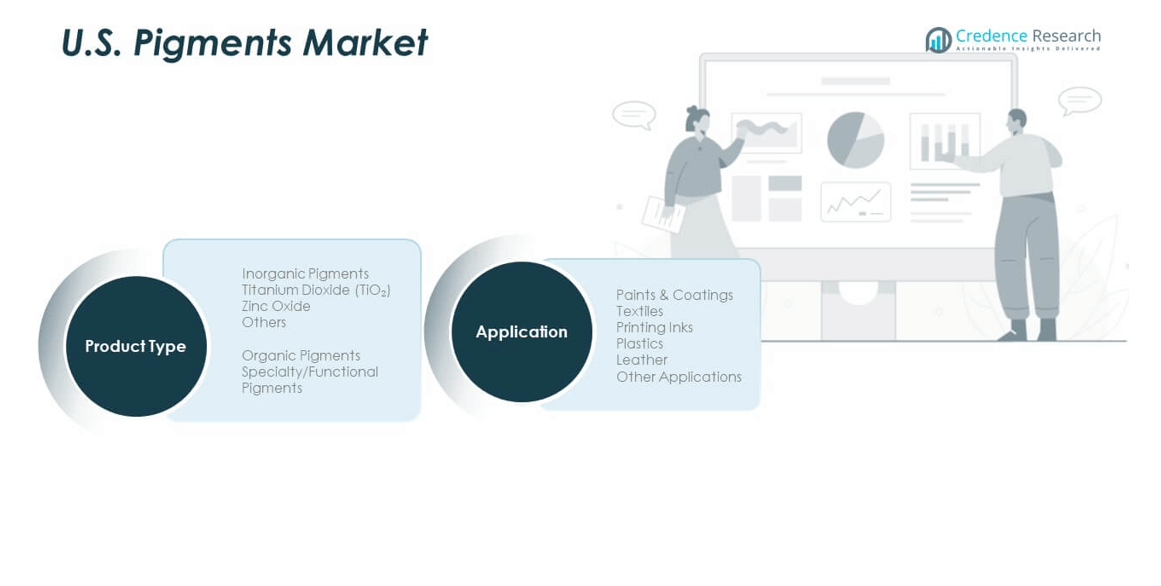
- Inorganic Pigments
- Titanium Dioxide (TiO₂)
- Zinc Oxide
- Others
- Organic Pigments
- Specialty/Functional Pigments
By Application
- Paints & Coatings
- Textiles
- Printing Inks
- Plastics
- Leather
- Other Applications
Regional Analysis
Northeast and Midwest – Established Industrial Hubs
The Northeast holds 22% of the U.S. Pigments Market, supported by a dense concentration of printing, packaging, and coatings industries. States such as New York, New Jersey, and Pennsylvania lead pigment consumption in printing inks and specialty coatings. The region’s mature manufacturing infrastructure and demand from architectural coatings sustain consistent growth. The Midwest dominates with a 31% market share, led by Ohio, Illinois, and Michigan, where automotive coatings and industrial paints remain major drivers. It benefits from strong pigment production capacity and access to raw materials. The presence of leading chemical producers strengthens its industrial output.
South – Rapid Expansion in Construction and Plastics
The Southern region accounts for 28% of the U.S. Pigments Market, driven by growth in construction, packaging, and plastics industries. Texas and Georgia serve as manufacturing hotspots due to expanding infrastructure and industrial activities. The increasing use of high-performance pigments in building materials supports long-term demand. Strong investments in residential development and packaging innovation fuel market expansion. The region’s warm climate encourages demand for UV-resistant pigments in coatings. Access to petrochemical resources supports cost-effective pigment synthesis. The South continues to attract new pigment facilities through favorable business policies.
West – Innovation and Sustainable Pigment Growth
The Western region represents 19% of the U.S. Pigments Market, led by California and Washington. Strong demand for eco-friendly pigments in sustainable construction and packaging drives growth. California’s strict environmental standards accelerate adoption of bio-based and low-VOC pigments. The region’s technology-driven industries promote innovation in nanotechnology and smart pigments. Rising investments in green infrastructure create favorable conditions for pigment producers. Proximity to the Pacific trade corridor enables strong export potential. It maintains a balanced growth outlook supported by sustainability initiatives and digital manufacturing trends.
Key Player Analysis
- DIC Corporation
- Kronos Worldwide, Inc.
- Sudarshan Chemical Industries Limited
- Venator Materials PLC
- The Chemours Company
- Tronox Holdings Plc
- ALTANA AG
- LB Group
- Shepherd Color Company
- Trust Chem Co., Ltd.
Competitive Analysis
The U.S. Pigments Market is moderately consolidated, with leading players including DIC Corporation, Kronos Worldwide, Venator Materials PLC, The Chemours Company, and Tronox Holdings Plc. These companies focus on high-performance pigment development, eco-friendly formulations, and process efficiency. Continuous investment in R&D enhances product performance and compliance with U.S. environmental standards. Regional players such as Shepherd Color Company and Sudarshan Chemical Industries strengthen competition through product innovation and niche color solutions. Partnerships and capacity expansions remain common strategies to increase domestic footprint. It continues to evolve through mergers, sustainable technology integration, and market-specific customization.
Recent Developments
- In October 2025, California Natural Color introduced its newest line of crystal color technology-based natural pigment solutions at the SupplySide Global Exposition in Las Vegas. The product features plant-based pigments with high concentration and superior dispersibility, tailored for food and beverage manufacturers seeking clean-label alternatives.
- In July 2025, Saint-Gobain North America revealed the acquisition of Interstar Materials Inc., a company specializing in pigment granules and dispensers for the U.S. and Canadian construction sectors. This strategic move enables Saint-Gobain to strengthen its Construction Chemicals segment and advance its innovation focus, particularly in the pigment business for concrete and construction materials.
- In July 2024, Kronos Worldwide completed the acquisition of the remaining 50% joint venture interest in Louisiana Pigment Company, L.P. (LPC) from Venator Investments, Ltd for upfront payment plus earn-out potential. This move positions LPC as a wholly-owned subsidiary of Kronos, expected to deliver operational efficiencies and strategic synergies across North America, specifically enhancing titanium dioxide capacity and supply reliability for domestic customers.
- In July 2024, Sudarshan Chemical Industries announced a strategic partnership with LBB Specialties for the North American pigments market, aiming to distribute high-quality, vibrant pigments tailored for the cosmetics and personal care segments. The partnership leverages Sudarshan’s manufacturing expertise and LBB’s market reach, targeting emerging consumer trends for safe and beautiful cosmetics.
Report Coverage
The research report offers an in-depth analysis based on Product Type and Application. It details leading market players, providing an overview of their business, product offerings, investments, revenue streams, and key applications. Additionally, the report includes insights into the competitive environment, SWOT analysis, current market trends, as well as the primary drivers and constraints. Furthermore, it discusses various factors that have driven market expansion in recent years. The report also explores market dynamics, regulatory scenarios, and technological advancements that are shaping the industry. It assesses the impact of external factors and global economic changes on market growth. Lastly, it provides strategic recommendations for new entrants and established companies to navigate the complexities of the market.
Future Outlook
- Growing preference for eco-friendly pigments will accelerate innovation in bio-based and waterborne formulations.
- Increasing automation and digital control in pigment manufacturing will enhance precision and reduce waste.
- Rising demand from automotive and construction coatings will sustain long-term industry expansion.
- The packaging sector will increasingly adopt recyclable and food-safe pigments to meet sustainability goals.
- Investments in nanotechnology will create new opportunities for high-performance and smart pigments.
- Demand for pigments compatible with 3D printing and additive manufacturing will strengthen industrial applications.
- Ongoing regulatory reforms will drive R&D toward safer and low-emission pigment alternatives.
- Regional producers will expand capacity to ensure supply stability amid fluctuating raw material costs.
- Integration of AI in color formulation and supply chain management will improve production efficiency.
- Strategic collaborations between pigment producers and end-use industries will reinforce product innovation and market competitiveness.

Request a Free Sample
Fill in your details and we'll send you a free sample report.
- Sample data tables & charts
- Research methodology
Need a Custom Version of This Report?
Tailor the scope, geography, or segments to your exact requirements.
- Custom geography or segment scope
- Direct access to our analyst team
Frequently Asked Questions
What is the current market size for U.S. Pigments Market, and what is its projected size in 2032?
At what Compound Annual Growth Rate is the U.S. Pigments Market projected to grow between 2024 and 2032?
Which U.S. Pigments Market segment held the largest share in 2024?
What are the primary factors fueling the growth of the U.S. Pigments Market?
Who are the leading companies in the U.S. Pigments Market?
Table of Content
Chapter 1. Report Introduction
- 1.1 Report Description & Purpose
- 1.1.1 Report Title & Market Definition
- 1.1.2 Unique Selling Propositions (USP) & Key Differentiators
- 1.1.3 Value Proposition for Stakeholders
- 1.2 Research Objectives
- 1.2.1 Market Sizing Objectives (Volume & Revenue) (Volume Where Applicable)
- 1.2.2 Segmentation Objectives
- 1.2.3 Competitive Intelligence Objectives
- 1.2.4 Forecast & Scenario Objectives
- 1.3 Report Scope
- 1.3.1 U.S. Pigments Scope – Segments & Subsegments Covered
- 1.3.2 Geographic Scope – Selected Country & Subnational Markets Covered
- 1.3.3 Historical Period, Base Year & Forecast Period (2024; forecast to 2032)
- 1.3.4 Inclusions & Exclusions
- 1.4 Industry Classification & Applicable Codes
- 1.5 Currency, Measurement Units & Valuation Basis
- 1.6 Target Stakeholders
- 1.7 Limitations & Assumptions
Chapter 2. Executive Summary
- 2.1 U.S. Pigments Snapshot
- 2.1.1 Market Size – Historical (2024) & Forecast (2024-2032) (2024: USD 6,917.94 million → 2032: USD 10,612.19 million)
- 2.1.2 Volume & Revenue – National Totals (Volume Where Applicable)
- 2.1.3 Key Market Highlights – Top Five Facts
- 2.2 U.S. Pigments Segmentation Snapshot
- 2.2.1 Market Split by Subnational Area – 2024 vs. 2032
- 2.3 Competitive Snapshot
- 2.3.1 Top 10 Players by Revenue Share – 2024
- 2.3.2 Top 10 Players by Volume Share – 2024 (Volume Where Applicable)
- 2.3.3 Recent Strategic Developments (18-Month Summary)
- 2.4 Key Investment Highlights & Strategic Conclusions
Chapter 3. U.S. Pigments Dynamics & Industry Analysis
- 3.1 Market Overview & Context
- 3.1.1 U.S. Pigments Position in the Broader Industry Value Chain
- 3.1.2 Demand Structure & Purchasing Dynamics
- 3.1.3 Market Maturity & Development Stage Across Domestic Markets
- 3.2 U.S. Pigments Drivers
- 3.3 U.S. Pigments Restraints & Challenges
- 3.4 U.S. Pigments Opportunities
- 3.5 Porter's Five Forces Analysis
- 3.5.1 Threat of New Entrants
- 3.5.2 Bargaining Power of Suppliers
- 3.5.3 Bargaining Power of Buyers
- 3.5.4 Threat of Substitutes
- 3.5.5 Competitive Rivalry – Intensity Assessment
- 3.6 U.S. Pigments Value Chain Analysis
- 3.6.1 Upstream – Key Inputs, Resources & Suppliers
- 3.6.1.1 Key Input/Resource 1
- 3.6.1.2 Key Input/Resource 2
- 3.6.1.3 Key Input/Resource 3
- 3.6.2 Midstream – Core Operations & Value Creation
- 3.6.2.1 Operating Model & Process Overview
- 3.6.2.2 Key Operating Locations & Capabilities by Company
- 3.6.3 Downstream – Market Channels & End Users
- 3.6.3.1 Direct Sales & Customer Engagement Channels
- 3.6.3.2 Indirect Sales, Intermediaries & Partner Channels
- 3.6.4 Value Chain Profitability Analysis
- 3.6.1 Upstream – Key Inputs, Resources & Suppliers
- 3.7 PESTEL Analysis
- 3.7.1 Political Factors
- 3.7.2 Economic Factors
- 3.7.3 Social Factors
- 3.7.4 Technological Factors
- 3.7.5 Environmental Factors
- 3.7.6 Legal Factors
- 3.8 U.S. Pigments Supply Chain Analysis
- 3.8.1 Critical Input & Resource Availability Risk Assessment
- 3.8.2 Supplier & Operational Concentration Risk (Geographic Exposure)
- 3.8.3 Supply & Service Disruption Impact Analysis
- 3.9 National & Subnational Regulatory Landscape
Note: The regulatory and policy landscape section covers regulations based on their applicability to the market, U.S. Pigments category, geography, and scope of the study. Only regulatory frameworks with a material impact on operations, compliance, trade, sustainability, or market access are analyzed in detail.
Chapter 4. Key Investment Pockets & Opportunity Analysis
- 4.1 U.S. Pigments Attractiveness Analysis
- 4.1.1 By Subnational Area – Investment Attractiveness Matrix (Market Size × CAGR)
- 4.2 Absolute Revenue Growth Opportunity
- 4.2.1 By Subnational Area – Absolute Revenue Growth Through 2032
- 4.3 Incremental Demand Opportunity
- 4.3.1 By Subnational Area – Incremental Demand Through 2032
- 4.3.2 Segment – Incremental Demand
- 4.4 Emerging Submarket Opportunity Deep Dive (Subject to Applicability)
- 4.5 Priority Domestic Market Opportunity Scorecards
- 4.5.1 Priority Domestic Market 1
- 4.5.2 Priority Domestic Market 2
- 4.5.3 Priority Domestic Market 3
- 4.5.4 Priority Domestic Market 4
Note: Domestic market scorecards cover relevant states, provinces, territories, cities, or economic zones within the selected country. Numbered entries are populated with market names suited to the national administrative structure and research scope. Geographic share tables use one consistent, nonoverlapping set of areas.
Chapter 5. U.S. Pigments Cross-Border Trade & Market Access Analysis
- 5.1 National Trade & International Partner Overview
- 5.1.1 Export Value by Destination Country (2024)
- 5.1.2 Export Volume by Destination Country (2024) (Where Applicable)
- 5.1.3 Import Value by Source Country (2024)
- 5.1.4 Import Volume by Source Country (2024) (Where Applicable)
- 5.1.5 National & Partner-Country Trade Balances (2024)
- 5.2 Export Analysis – Segment
- 5.2.1 Category 1 (Applicable Classification Code)
- 5.2.2 Category 2 (Applicable Classification Code)
- 5.2.3 Category 3 (Applicable Classification Code)
- 5.2.4 Category 4 (Applicable Classification Code)
- 5.2.5 Category 5 (Applicable Classification Code)
- 5.3 Import Analysis – Segment
- 5.3.1 Category 1 (Applicable Classification Code)
- 5.3.2 Category 2 (Applicable Classification Code)
- 5.3.3 Category 3 (Applicable Classification Code)
- 5.3.4 Category 4 (Applicable Classification Code)
- 5.3.5 Category 5 (Applicable Classification Code)
- 5.4 Cross-Border Pricing & Transaction Benchmarks
- 5.4.1 Export Pricing – Segment & Destination Country
- 5.4.2 Import Pricing – Segment & Source Country
- 5.4.3 Price Trends (2024)
- 5.5 Key Cross-Border Trade & Delivery Routes
- 5.5.1 Cross-Border Trade/Delivery Route 1
- 5.5.2 Cross-Border Trade/Delivery Route 2
- 5.5.3 Cross-Border Trade/Delivery Route 3
- 5.5.4 Cross-Border Trade/Delivery Route 4
- 5.5.5 Cross-Border Trade/Delivery Route 5
- 5.6 Trade Policy & Market Access Impact Assessment
- 5.6.1 Tariff & Non-Tariff Barriers
- 5.6.2 National Participation in Regional Trade & Economic Frameworks
- 5.6.3 Bilateral & Multilateral Trade Agreements
- 5.6.4 Cross-Border Operating, Licensing & Localization Requirements
Note: This chapter covers international trade relevant to U.S. Pigments in the selected country. Exports are analyzed by destination and imports by source. Domestic interregional flows are excluded from international trade totals. Goods, services, and digital offerings use applicable classifications; volume and route analyses apply only where meaningful.
Chapter 6. Competitive Landscape & Company Benchmarking
- 6.1 U.S. Pigments Concentration & Structure
- 6.1.1 Herfindahl-Hirschman Index (HHI) – vs. 2024
- 6.1.2 Leading, Mid-Sized & Emerging Player Structure
- 6.1.3 Multinational, National & Local Player Dynamics
- 6.2 U.S. Pigments Share Analysis – 2024
- 6.2.1 National Revenue Share by Company
- 6.2.2 National Volume Share by Company (Volume Where Applicable)
- 6.2.3 Company Revenue Share by Subnational Area
- 6.2.4 Market Share Evolution ( vs. 2024)
- 6.2.5 Company Market Share by Key Segment
- 6.2.6 Company Market Share by Customer Group
- 6.3 Operating Scale, Capacity & Infrastructure Analysis
- 6.3.1 National Operating Scale & Supply Capacity
- 6.3.2 Resource Utilization & Operating Efficiency
- 6.3.3 Output, Service Delivery & Activity Metrics
- 6.3.4 Operating Footprint & Infrastructure Map
- 6.3.5 Planned Operational & Capacity Expansion
- 6.4 U.S. Pigments Competitive Benchmarking Matrix
- 6.4.1 Revenue, Growth, Profitability & Operating Metric Comparison
- 6.4.2 Channel Revenue Mix
- 6.4.3 Revenue Exposure Across Domestic Markets
- 6.4.4 R&D Intensity
- 6.4.5 Sustainability Maturity
- 6.5 Strategic Developments in U.S. Pigments (Last 24 Months)
- 6.5.1 Mergers, Acquisitions & Divestments
- 6.5.2 New Products, Services & Solutions in U.S. Pigments
- 6.5.3 Operational & Infrastructure Expansions
- 6.5.4 Strategic Alliances, Joint Ventures & Partnerships
- 6.5.5 Distribution Expansion & Market Entry
- 6.5.6 Sustainability & ESG Initiatives
- 6.6 Competitive Strategy Mapping
- 6.6.1 Leader, Challenger, Follower & Niche Classification
- 6.6.2 Pricing Strategy Comparison
- 6.6.3 Channel Strategy Matrix
Note: Strategic developments are included based on their materiality and the availability of reliable information.
Chapter 7. U.S. Pigments – By Sales & Delivery Channel
- 7.1 Segment Overview
- 7.1.1 Volume & Revenue Split by Channel (2024 & 2032) (Volume Where Applicable)
- 7.1.2 Channel Mix Evolution (2024-2032)
Chapter 8. Subnational Market Analysis – Country Overview
- 8.1 Domestic Geographic Market Overview
- 8.1.1 Subnational Volume Share (Where Applicable)
- 8.1.2 Subnational Revenue Share
- 8.1.3 Market Volume by Subnational Area (Where Applicable)
- 8.1.4 Market Revenue by Subnational Area
- 8.1.5 Subnational Forecasts Through 2032
- 8.2 Cross-Area Segment Analysis Within the Country
- 8.2.1 By Sales & Delivery Channel
- 8.2.2 By Competitive Positioning & Price Tier
Chapter 9. U.S. Pigments – Priority Domestic Market 1
Chapter 10. U.S. Pigments – Priority Domestic Market 2
Chapter 11. U.S. Pigments – Priority Domestic Market 3
Chapter 12. U.S. Pigments – Priority Domestic Market 4
Chapter 13. U.S. Pigments Company Profiles
- 13.1 [Company 01]
- 13.1.1 Company Overview
- 13.1.2 Key Management Personnel
- 13.1.3 Products & Services Portfolio
- 13.1.4 Financial Performance
- 13.1.5 Domestic Market Focus & Local Operating Presence
- 13.1.6 Recent Developments & Strategic Initiatives
Note: The company profile list is preliminary and may change based on research findings, market developments, data availability, and client requirements.
Chapter 14. Appendices
- Appendix A – List of Abbreviations & Acronyms
- Appendix B – Industry Classification Code Reference – Full Series
- Appendix C – Supply, Output & Operating Capacity Data Tables
- Appendix D – End-Use & Demand Base Tables
- Appendix E – Demand, Adoption & Usage Assumptions
- Appendix F – Pricing & Revenue Metric Reference Tables
- Appendix G – Company Operations & Infrastructure Database
- Appendix H – Cross-Border Trade & Activity Data Tables (Where Applicable)
- Appendix I – Regulatory Summary Tables
- Appendix J – Primary Research Participant List (Anonymized)
- Appendix K – Primary Research Questionnaire Framework
- Appendix L – Data Sources & Bibliography
- Appendix M – Market Size Divergence & Source Comparison
Chapter 15. Research Methodology
- 15.1 Research Framework & Philosophy
- 15.2 Secondary Research – Sources, Hierarchy & Data Extraction
- 15.3 Data Modeling – National Market Sizing & Subnational Allocation
- 15.4 Primary Research – Stakeholder Framework, LOI & Sample Sizes
- 15.5 Forecast Methodology – Regression, Scenario & Sensitivity Analysis
- 15.6 Quality Control – Four-Layer Validation Framework
- 15.7 Limitations & Standard Assumptions
- 15.8 Disclaimer
