
Market Overview:
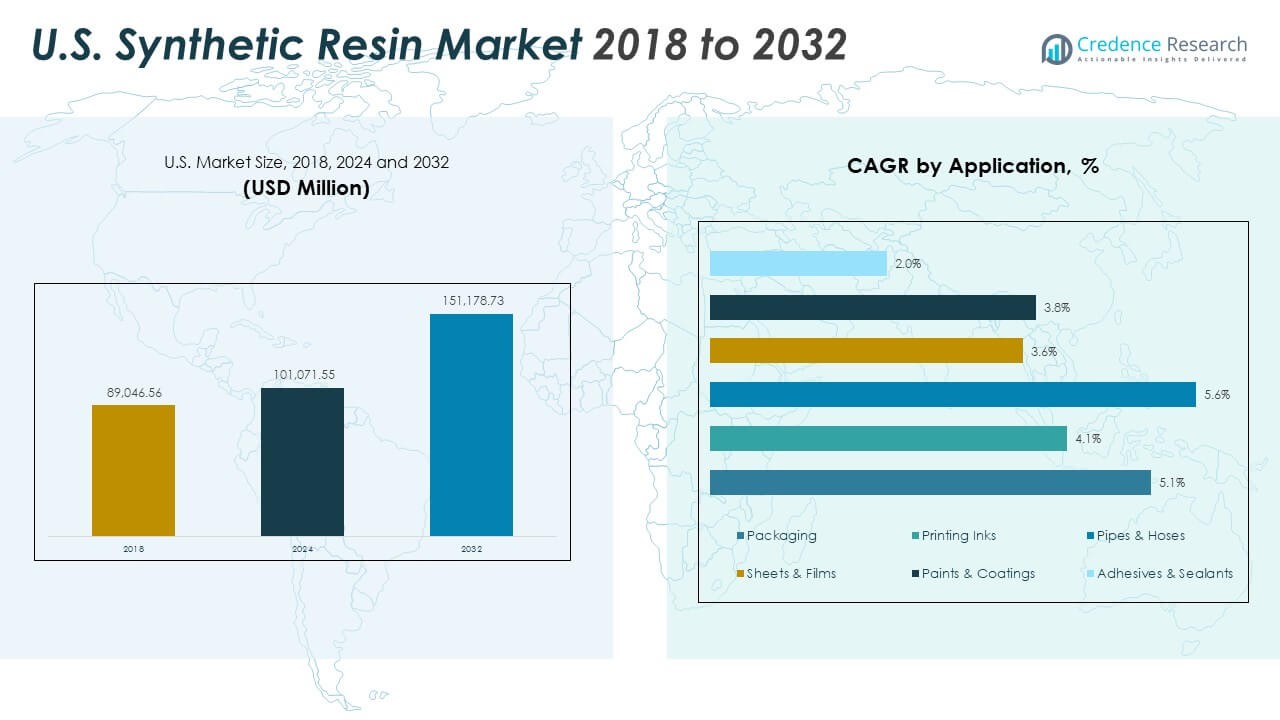
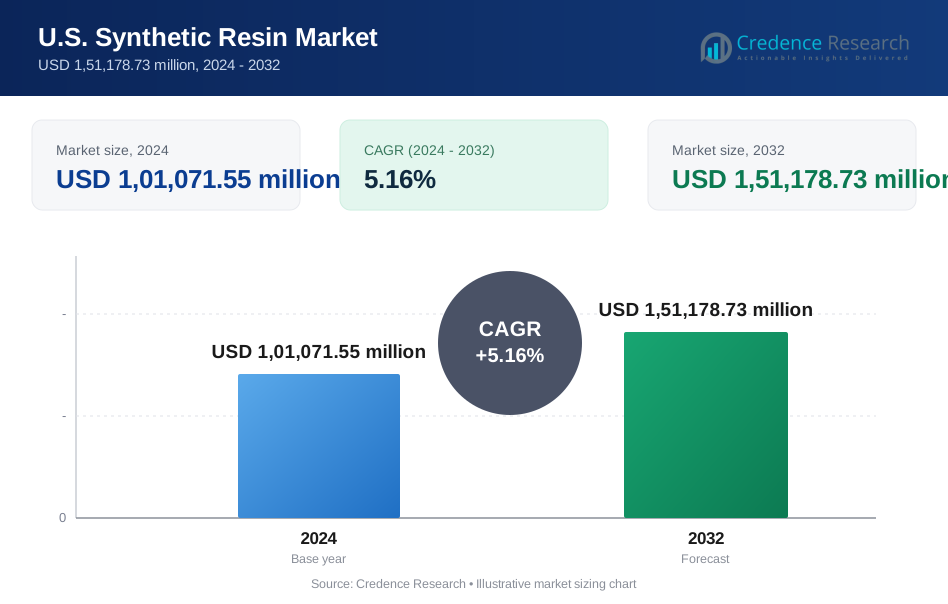
The U.S. Synthetic Resin Market size was valued at USD 89,046.56 million in 2018 to USD 1,01,071.55 million in 2024 and is anticipated to reach USD 1,51,178.73 million by 2032, at a CAGR of 5.16% during the forecast period.
| REPORT ATTRIBUTE | DETAILS |
|---|---|
| Historical Period | 2020-2023 |
| Base Year | 2024 |
| Forecast Period | 2025-2032 |
| U.S. Synthetic Resin Market Size 2024 | USD 1,01,071.55 Million |
| U.S. Synthetic Resin Market, CAGR | 5.16% |
| U.S. Synthetic Resin Market Size 2032 | USD 1,51,178.73 Million |
Strong market growth is driven by rising demand for lightweight, cost-effective, and durable materials. The packaging sector is a major contributor, supported by high consumption in food, beverage, and e-commerce industries. The automotive industry boosts demand through the shift toward lightweight components that improve efficiency and design flexibility. Construction and infrastructure development strengthen resin use in coatings, sealants, and insulation. Ongoing technological improvements enhance material strength, chemical resistance, and sustainability, encouraging manufacturers to invest in advanced resin production capabilities.
The Midwest holds a leading share of the U.S. Synthetic Resin Market due to its strong automotive and construction industries. The Northeast region benefits from an established manufacturing base and high packaging demand. Southern and Western regions are emerging, supported by expanding oil and gas activities, electronics, and personal care product manufacturing. Growth in these subregions is reinforced by advanced infrastructure, efficient supply chains, and strategic industrial investments, ensuring balanced demand across multiple end-use industries and securing long-term market stability.
Market Insights
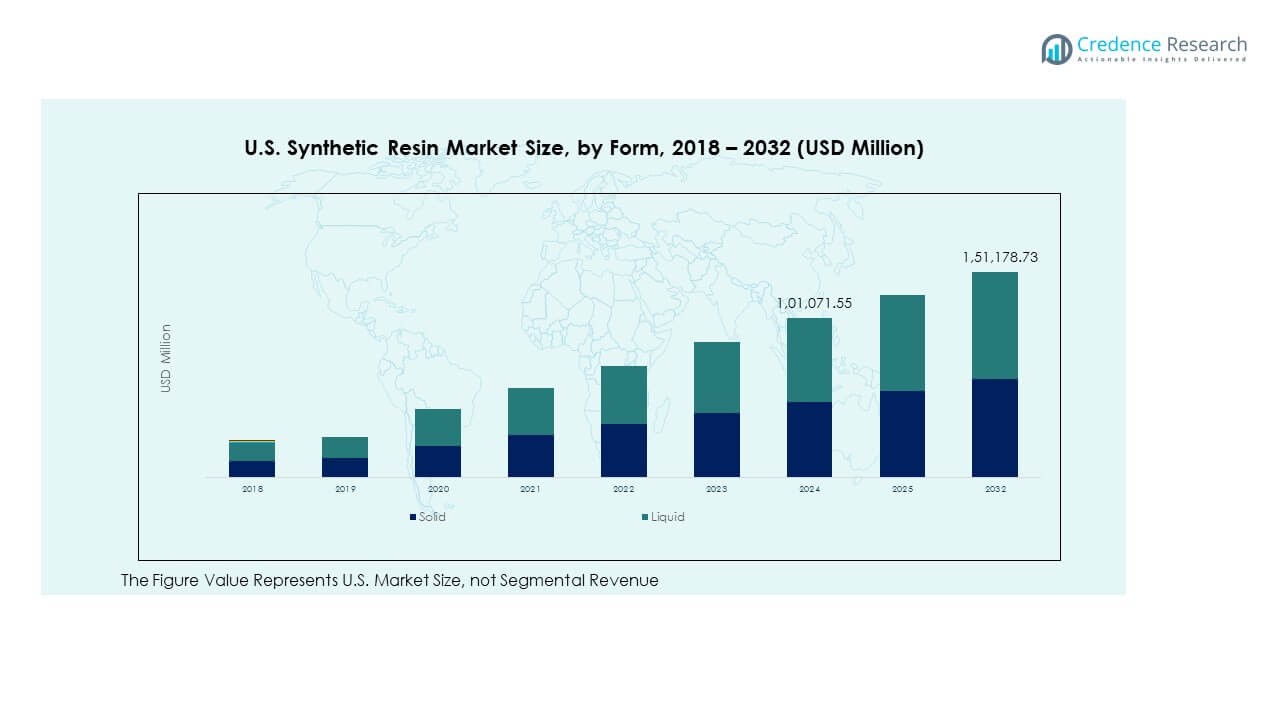
- The U.S. Synthetic Resin Market was valued at USD 89,046.56 million in 2018, grew to USD 1,01,071.55 million in 2024, and is projected to reach USD 1,51,178.73 million by 2032 at a CAGR of 5.16%.
- The Midwest region holds a 33% share, driven by strong automotive and construction demand. The Southern and Western regions account for 38%, supported by oil & gas and electronics industries. The Northeast region contributes 29%, benefitting from manufacturing and packaging growth.
- The Southern and Western regions represent the fastest-growing subregions due to expanding industrial diversification, recycling investments, and technology-driven capacity upgrades.
- Solid resins account for 46.8% of the total market in 2032, reflecting strong demand in packaging, construction, and automotive segments where high strength and durability are required.
- Liquid resins represent 53.2% of the total market in 2032, supported by increased use in coatings, adhesives, and sealants across infrastructure and industrial applications.
Market Drivers
Growing Demand from Packaging Applications Enhancing Resin Consumption Across Multiple Product Categories
The packaging industry plays a central role in driving consumption across flexible and rigid formats. Rising demand for food-safe, lightweight, and durable packaging is increasing the use of polyethylene, polypropylene, and PVC. E-commerce growth supports this demand through greater volumes of protective packaging. It helps improve shelf life, ensure product safety, and reduce overall logistics costs. Consumer preferences for sustainable yet efficient materials encourage manufacturers to invest in resin innovations. Strategic collaborations between packaging companies and resin producers enhance supply stability. Growing automation in production facilities strengthens operational efficiency. The U.S. Synthetic Resin Market benefits from these combined developments.
Rapid Growth in the Construction Sector Supporting Expanded Resin Utilization in Multiple Applications
The construction industry strongly influences resin consumption through pipes, insulation, panels, adhesives, and coatings. Increased housing projects, infrastructure development, and renovation activities expand the use of thermoplastic and thermosetting resins. It supports durability, corrosion resistance, and cost-efficiency in modern construction. Demand for energy-efficient building materials boosts the adoption of insulation and sealing applications. Companies focus on developing advanced polymer blends to meet strict building codes. Green construction trends increase the appeal of recyclable resin solutions. Manufacturers strengthen capacity to meet surging project timelines. The U.S. Synthetic Resin Market gains momentum from this expansion.
Automotive Industry Shifting Toward Lightweight Materials to Improve Efficiency and Lower Costs
Automotive manufacturers focus on reducing vehicle weight to improve fuel efficiency and meet emission targets. High-performance resins support structural strength while replacing heavier metal components. It helps optimize design flexibility and lower manufacturing costs. Advanced polymer applications in bumpers, dashboards, and interior parts enhance vehicle safety and performance. Electric vehicle growth boosts the demand for lightweight composite materials. Companies integrate innovative processing technologies to improve resin quality and consistency. Strategic partnerships with OEMs help secure long-term supply agreements. The U.S. Synthetic Resin Market benefits from rising automotive innovation.
- For instance, LyondellBasell Industries Holdings B.V. offers advanced polypropylene compounds designed to support automotive lightweighting. These materials enable thin-walled component design and foam formation, improving vehicle efficiency and supporting OEM weight-reduction strategies.
Technological Advancements in Polymer Science Enabling Product Differentiation and Performance Enhancement
Innovation in polymer technology improves resin durability, chemical resistance, and processing efficiency. Companies invest in advanced manufacturing methods like reactive extrusion and controlled polymerization. It supports the creation of resins with tailored performance for niche applications. Integration of nanotechnology improves strength and thermal stability in high-performance materials. Product diversification helps industries adapt to evolving regulatory standards. Enhanced material consistency improves production reliability across end-use industries. Strategic R&D programs strengthen competitive positions globally. The U.S. Synthetic Resin Market leverages these advancements to support sustainable growth.
- For instance, Matmerize Inc., a Georgia Tech spin-out, offers its cloud-based PolymRize™ platform to accelerate polymer design and development. In 2024, the company partnered with CJ Biomaterials to apply this technology for sustainable polymer innovation.
Market Trends
Rising Focus on Bio-Based Resins to Address Sustainability Concerns and Reduce Carbon Emissions
Bio-based alternatives gain traction due to increasing environmental regulations and consumer awareness. Resin manufacturers prioritize renewable feedstocks derived from plant-based sources. It helps reduce carbon footprints and supports circular economy goals. Companies invest in large-scale bio-polymer production units to meet growing demand. Government incentives encourage industries to transition toward eco-friendly materials. Strategic alliances strengthen market entry for bio-based solutions. Product portfolios expand with biodegradable resin grades to target sensitive applications. The U.S. Synthetic Resin Market reflects this sustainability shift in product development strategies.
- For instance, in June 2024, BASF launched its biomass-balanced ecoflex® F Blend C1200 BMB biopolymer, certified under REDcert² and ISCC PLUS, which delivers a 60% lower product carbon footprint than conventional fossil-based grades through direct replacement of fossil feedstock with waste or residual biomass at the start of the value chain.
Integration of Smart Manufacturing Practices to Optimize Production Efficiency and Lower Costs
Manufacturers adopt Industry 4.0 technologies, including AI, IoT, and predictive analytics, to modernize production. It improves throughput, reduces waste, and enhances quality control in resin processing. Automation of mixing, extrusion, and curing enhances operational precision. Companies streamline maintenance schedules using real-time monitoring systems. Advanced data analytics support continuous performance improvements. Workforce upskilling aligns with the adoption of digital tools in production environments. Strategic modernization ensures long-term competitiveness. The U.S. Synthetic Resin Market experiences a stronger push toward smart production ecosystems.
Increased Customization of Resin Formulations to Meet Specific End-Use Industry Demands
Resin manufacturers design specialized formulations to address distinct performance needs in packaging, automotive, and construction sectors. It ensures product suitability across varied operational conditions. Development of UV-resistant, flame-retardant, and impact-modified grades enhances market adaptability. Companies emphasize application testing and validation to secure regulatory approvals. Growth in specialized applications drives targeted product innovation. Customer-specific development strategies strengthen brand differentiation. Long-term contracts with key end users ensure stable demand. The U.S. Synthetic Resin Market aligns product development with industry-specific requirements.
Rising Adoption of Advanced Recycling Technologies to Strengthen Material Circularity and Reduce Waste
The industry focuses on chemical and mechanical recycling techniques to manage plastic waste effectively. It enables the reuse of post-consumer materials without compromising quality. Companies invest in pyrolysis, solvent-based recycling, and depolymerization to improve recovery rates. Strategic partnerships strengthen waste collection networks. Circular economy models create new revenue streams for producers. Product design aligns with recyclability goals across packaging and automotive applications. Regulatory pressures drive accelerated technology adoption. The U.S. Synthetic Resin Market embraces recycling innovation to improve sustainability outcomes.
- For instance, Eastman Chemical’s Kingsport, Tennessee molecular recycling facility began revenue-generating operations in early 2024. It is designed to recycle up to 110,000 metric tons of polyester waste annually using methanolysis, reducing greenhouse gas emissions by 20–30% compared with fossil-based methods.
Market Challenges Analysis
Stringent Environmental Regulations Increasing Compliance Costs and Reshaping Production Strategies
Regulatory frameworks targeting plastic waste and emissions increase operational pressure on resin producers. Companies face higher costs to meet compliance and reporting requirements. It leads to investments in cleaner technologies and sustainable production methods. Bans on single-use plastics restrict demand in several applications. Product redesign requires significant time and financial resources. Complex approval procedures delay market entry for new materials. Smaller manufacturers struggle to maintain profitability while meeting evolving standards. The U.S. Synthetic Resin Market experiences strategic restructuring to address these regulatory hurdles.
Volatility in Raw Material Prices Affecting Production Planning and Margin Stability
The market depends heavily on petrochemical feedstocks like ethylene and propylene. Fluctuations in crude oil prices impact resin production costs and supply planning. It creates uncertainty in long-term pricing strategies for manufacturers. Trade disruptions and geopolitical tensions amplify supply chain risks. Companies face difficulties maintaining competitive pricing under volatile conditions. Strategic sourcing and inventory management become critical for stability. Producers diversify supply sources to mitigate risks. The U.S. Synthetic Resin Market adapts to unpredictable raw material dynamics through flexible procurement strategies.
Market Opportunities
Strong Growth in Recyclable Resin Applications Creating New Revenue Streams for Manufacturers
Demand for recyclable materials is increasing across packaging, construction, and automotive sectors. It drives innovation in developing high-quality recyclable grades with superior mechanical properties. Companies invest in advanced processing technologies to expand sustainable product lines. Circular economy initiatives support market expansion into regulated industries. Collaboration with waste management firms improves supply consistency. Brands focus on integrating eco-friendly materials to enhance market positioning. The U.S. Synthetic Resin Market capitalizes on this shift to strengthen competitive advantage.
Emergence of High-Performance Resins for Specialized Industrial Applications Supporting Market Expansion
High-performance resins gain traction in aerospace, defense, and energy applications. It offers superior strength, temperature resistance, and lightweight characteristics. Manufacturers develop advanced composite materials to meet demanding performance requirements. Strategic partnerships accelerate innovation and market entry. Adoption in critical infrastructure supports long-term revenue generation. Expansion into high-value sectors ensures better profit margins. The U.S. Synthetic Resin Market benefits from the growing adoption of specialized resin technologies.
Market Segmentation Analysis
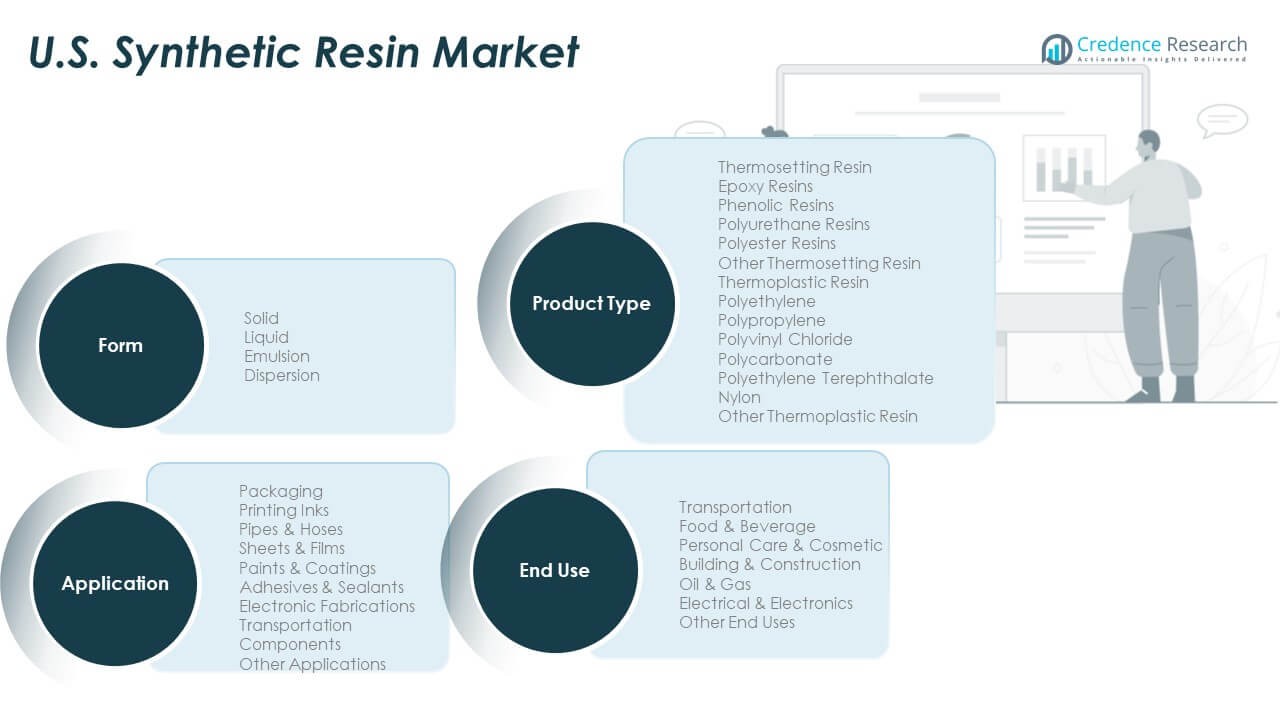
By Form, solid resins dominate the market due to their strength, ease of processing, and wide compatibility with various end-use applications. Liquid resins hold strong demand in coatings, adhesives, and sealants, supporting fast-curing and flexible designs. Emulsion and dispersion types gain traction in paints and inks because of low VOC content and superior film formation. These forms collectively strengthen material versatility and performance in manufacturing environments.
- For instance, Dow’s VERSIFY™ 3000 solid resin reports a tensile strength of 27.3 MPa with 730% elongation at break, while VERSIFY™ 3200 shows 22.1 MPa with 840% elongation at break, according to official ASTM D638 product datasheets.
By Application, packaging leads due to rising demand for flexible and rigid packaging solutions in consumer goods and food products. Sheets and films represent a significant share, supported by applications in construction and electronics. Paints, coatings, adhesives, and sealants maintain consistent growth due to their use in infrastructure and industrial projects. Transportation components and electronic fabrications add high-value applications.
- For instance, SABIC’s LEXAN™ 945 polycarbonate resin is a flame-retardant grade that achieves a UL-94 V-0 rating at 3.0 mm thickness, as verified in official product datasheets and UL certifications. It is commonly used in electronic applications requiring high safety standards.
By End Use, transportation holds a strong share driven by lightweight material adoption in automotive and aerospace sectors. Building and construction also contribute significantly through structural and finishing materials. Food and beverage, personal care, and oil and gas segments display stable demand across diverse product lines. Electrical and electronics expand steadily with smart manufacturing growth.
By Product Type, thermoplastic resin dominates due to its reusability, process flexibility, and broad industrial use. Polyethylene and polypropylene drive volume demand, while PVC and PET support packaging and construction. Thermosetting resin, including epoxy and polyurethane, finds strong demand in coatings, adhesives, and high-performance applications. The U.S. Synthetic Resin Market benefits from this balanced and diversified segment structure.
Segmentation
By Form
- Solid
- Liquid
- Emulsion
- Dispersion
By Application
- Packaging
- Printing Inks
- Pipes & Hoses
- Sheets & Films
- Paints & Coatings
- Adhesives & Sealants
- Electronic Fabrications
- Transportation Components
- Other Applications
By End Use
- Transportation
- Food & Beverage
- Personal Care & Cosmetic
- Building & Construction
- Oil & Gas
- Electrical & Electronics
- Other End Uses
By Product Type
· Thermosetting Resin
- Epoxy Resins
- Phenolic Resins
- Polyurethane Resins
- Polyester Resins
- Other Thermosetting Resin
· Thermoplastic Resin
- Polyethylene
- Polypropylene
- Polyvinyl Chloride (PVC)
- Polycarbonate
- Polyethylene Terephthalate (PET)
- Nylon
- Other Thermoplastic Resin
Regional Analysis
Northeast Region Strengthening Resin Production Through Industrial Base Expansion – 29% Share
The Northeast region holds a 29% market share, supported by a strong manufacturing base and high packaging consumption. It benefits from advanced infrastructure and proximity to key chemical production hubs. Growing demand from food packaging, construction materials, and electronics reinforces market expansion. It gains a strategic edge from established transportation networks that reduce logistics costs. Investment in sustainable resin production enhances competitiveness in regulated markets. Regional producers focus on capacity upgrades to meet specialized end-use requirements. The U.S. Synthetic Resin Market gains steady support from this region’s stable industrial demand.
Midwest Region Leveraging Automotive and Construction Growth for Increased Resin Consumption – 33% Share
The Midwest region leads with a 33% share, supported by automotive manufacturing clusters and expanding construction activity. It benefits from consistent resin demand for lightweight vehicle components and infrastructure projects. Strong collaboration between resin producers and automotive OEMs strengthens supply stability. Regional manufacturers invest in energy-efficient facilities to improve processing capacity. Growth in industrial coatings and adhesives applications supports market depth. Innovation in thermoplastic resin formulations aligns with performance needs in transportation. The region contributes significantly to overall market momentum.
Southern and Western Regions Driving Market Growth Through Diverse Industrial Applications – 38% Share
The Southern and Western regions together account for a 38% share, supported by expanding packaging, energy, and electronics industries. High resin demand from oil and gas operations strengthens market penetration in the South. The West benefits from electronics and personal care product manufacturing, supporting diversified end-use segments. Investments in recycling infrastructure and sustainable polymer technology increase competitiveness. Companies in these regions adopt advanced production processes to improve output efficiency. The regional mix ensures balanced supply and demand distribution. It strengthens the overall national market structure and supports long-term growth.
Key Player Analysis
- BASF SE
- SABIC
- Covestro AG
- Mitsubishi Chemical Group Corporation
- LG Chem
- Sumitomo Chemical Co., Ltd.
- Arkema S.A.
- DSM-Firmenich
- Dow Inc.
- DuPont de Nemours, Inc.
- Westlake Chemical Corporation
Competitive Analysis
The U.S. Synthetic Resin Market is characterized by intense competition among major global and domestic producers. Key players focus on expanding product portfolios, strengthening distribution networks, and investing in R&D to address performance and sustainability demands. It drives strategic partnerships with packaging, automotive, and construction industries to secure long-term supply agreements. Companies enhance competitiveness through production capacity expansion and integration of advanced processing technologies. Sustainability commitments and circular economy strategies influence innovation priorities. Firms actively engage in mergers and acquisitions to strengthen market presence and achieve cost efficiencies. Competitive differentiation relies on product quality, pricing strategies, and technological capabilities. Leading players maintain strong customer relationships to secure consistent market positioning.
Recent Developments
- In October 2025, BASF SE entered a strategic partnership with International Flavors & Fragrances (IFF) to develop next-generation enzyme and polymer technologies targeting fabric, dish, personal care, and industrial cleaning applications in the U.S. synthetic resin market.
- In October 2025, Mitsubishi Chemical Japan announced the launch of advanced ethylene vinyl acetate (EVA) resins designed for the U.S. synthetic resin market, specifically catering to segments such as packaging and footwear. These new EVA resins feature improved clarity and flexibility, addressing the increasing demand for high-performance materials in key manufacturing sectors.
Report Coverage
The research report offers an in-depth analysis based on Form, Application, End Use and Product Type. It details leading market players, providing an overview of their business, product offerings, investments, revenue streams, and key applications. Additionally, the report includes insights into the competitive environment, SWOT analysis, current market trends, as well as the primary drivers and constraints. Furthermore, it discusses various factors that have driven market expansion in recent years. The report also explores market dynamics, regulatory scenarios, and technological advancements that are shaping the industry. It assesses the impact of external factors and global economic changes on market growth. Lastly, it provides strategic recommendations for new entrants and established companies to navigate the complexities of the market.
Future Outlook
- Demand for bio-based and recyclable resins will strengthen due to rising sustainability goals.
- Smart manufacturing technologies will increase resin production efficiency and improve material quality.
- Expanding infrastructure development will drive greater use in construction, coatings, and adhesives.
- Lightweight materials in automotive and transportation will sustain thermoplastic resin dominance.
- Strategic R&D investments will support new resin formulations for specialized applications.
- Growth in e-commerce and consumer goods will expand packaging demand for flexible and rigid formats.
- Recycling technologies will accelerate circular economy integration and supply chain optimization.
- Industrial partnerships will enhance production capacity and secure long-term supply agreements.
- Regulatory frameworks will shape product innovation toward environmentally compliant resin grades.
- The U.S. Synthetic Resin Market will maintain a balanced growth path supported by broad end-use diversification.
Request a Free Sample
Fill in your details and we'll send you a free sample report.
- Sample data tables & charts
- Research methodology
Need a Custom Version of This Report?
Tailor the scope, geography, or segments to your exact requirements.
- Custom geography or segment scope
- Direct access to our analyst team
Frequently Asked Questions
What is the current market size for U.S.Synthetic Resin Market, and what is its projected size in 2032?
At what Compound Annual Growth Rate is the U.S.Synthetic Resin Market projected to grow between 2024 and 2032?
Which U.S.Synthetic Resin Market segment held the largest share in 2024?
What are the primary factors fueling the growth of the U.S.Synthetic Resin Market?
Who are the leading companies in the U.S.Synthetic Resin Market?
Which region commanded the largest share of the U.S.Synthetic Resin Market in 2024?
Table of Content
Chapter 1. Report Introduction
- 1.1 Report Description & Purpose
- 1.1.1 Report Title & Market Definition
- 1.1.2 Unique Selling Propositions (USP) & Key Differentiators
- 1.1.3 Value Proposition for Stakeholders
- 1.2 Research Objectives
- 1.2.1 Market Sizing Objectives (Volume & Revenue)
- 1.2.2 Segmentation Objectives
- 1.2.3 Competitive Intelligence Objectives
- 1.2.4 Forecast & Scenario Objectives
- 1.3 Report Scope
- 1.3.1 U.S. Synthetic Resin Scope – Types & Subtypes Covered
- 1.3.2 Geographic Scope – Regions & Countries Covered
- 1.3.3 Historical Period, Base Year & Forecast Period (2024; forecast to 2032)
- 1.3.4 Inclusions & Exclusions
- 1.4 HS Code & Classification Framework
- 1.5 Currency, Units & Pricing Basis
- 1.6 Target Stakeholders
- 1.7 Limitations & Assumptions
Chapter 2. Executive Summary
- 2.1 Global U.S. Synthetic Resin Market Snapshot
- 2.1.1 Market Size – Historical (2024) & Forecast (2024-2032) (2024: USD 1,01,071.55 million → 2032: USD 1,51,178.73 million)
- 2.1.2 Volume & Revenue – Global Totals
- 2.1.3 Key Market Highlights – Top Five Facts
- 2.2 U.S. Synthetic Resin Market Segmentation Snapshot
- 2.2.1 Market Split by Region – 2024 vs. 2032
- 2.3 Competitive Snapshot
- 2.3.1 Top 10 Players by Revenue Share – 2024
- 2.3.2 Top 10 Players by Volume Share – 2024
- 2.3.3 Recent Strategic Developments (18-Month Summary)
- 2.4 Key Investment Highlights & Strategic Conclusions
Chapter 3. U.S. Synthetic Resin Market Dynamics & Industry Analysis
- 3.1 Market Overview & Context
- 3.1.1 U.S. Synthetic Resin Market Position in the Broader Automotive Value Chain
- 3.1.2 OEM vs. Replacement Market Dynamics
- 3.1.3 Market Maturity & Development Stage by Region
- 3.2 U.S. Synthetic Resin Market Drivers
- 3.3 U.S. Synthetic Resin Market Restraints & Challenges
- 3.4 U.S. Synthetic Resin Market Opportunities
- 3.5 Porter's Five Forces Analysis
- 3.5.1 Threat of New Entrants
- 3.5.2 Bargaining Power of Suppliers
- 3.5.3 Bargaining Power of Buyers
- 3.5.4 Threat of Substitutes
- 3.5.5 Competitive Rivalry – Intensity Assessment
- 3.6 U.S. Synthetic Resin Value Chain Analysis
- 3.6.1 Upstream – Raw Material/Input Suppliers
- 3.6.1.1 Raw Material/Input 1
- 3.6.1.2 Raw Material/Input 2
- 3.6.1.3 Raw Material/Input 3
- 3.6.2 Midstream – Production/Manufacturing/Service Delivery
- 3.6.2.1 Production/Process Overview
- 3.6.2.2 Key Facility Locations & Capacity by Manufacturer
- 3.6.3 Downstream – Distribution & End Consumer
- 3.6.3.1 Primary Channel – B2B/OEM
- 3.6.3.2 Secondary Channels – Dealer, Retail, Online, Direct
- 3.6.4 Value Chain Profitability Analysis
- 3.6.1 Upstream – Raw Material/Input Suppliers
- 3.7 PESTEL Analysis
- 3.7.1 Political Factors
- 3.7.2 Economic Factors
- 3.7.3 Social Factors
- 3.7.4 Technological Factors
- 3.7.5 Environmental Factors
- 3.7.6 Legal Factors
- 3.8 U.S. Synthetic Resin Supply Chain Analysis
- 3.8.1 Raw Material/Input Supply Risk Assessment
- 3.8.2 Manufacturing Concentration Risk (Geographic Exposure)
- 3.8.3 Trade Disruption Impact Analysis
- 3.9 Regulatory & Policy Landscape
Note: The regulatory and policy landscape section covers regulations based on their applicability to the market, U.S. Synthetic Resin category, geography, and scope of the study. Only regulatory frameworks with a material impact on operations, compliance, trade, sustainability, or market access are analyzed in detail.
Chapter 4. Key Investment Pockets & Opportunity Analysis
- 4.1 U.S. Synthetic Resin Market Attractiveness Analysis
- 4.1.1 By Region – Investment Attractiveness Matrix (Volume × CAGR)
- 4.2 Absolute Revenue Growth Opportunity
- 4.2.1 By Region – Absolute USD Growth Through 2032
- 4.3 Incremental Volume Opportunity
- 4.3.1 By Region – Incremental Volume Through 2032
- 4.3.2 Segment – Incremental Volume
- 4.4 Emerging Submarket Opportunity Deep Dive (Subject to Applicability)
- 4.5 Emerging Market Opportunity Scorecards
- 4.5.1 United States
- 4.5.2 Europe
- 4.5.3 Asia
- 4.5.4 Middle East & Africa
Note: Emerging Market Opportunity Scorecards will be included based on relevance and strategic importance. Regions listed are indicative and may vary depending on data availability and market dynamics.
Chapter 5. U.S. Synthetic Resin Import-Export Analysis & Trade Flows
- 5.1 Global Trade Overview
- 5.1.1 Global Export Value by Country (2024)
- 5.1.2 Global Export Volume by Country (2024)
- 5.1.3 Global Import Value by Country (2024)
- 5.1.4 Global Import Volume by Country (2024)
- 5.1.5 Net Trade Balance by Country (2024)
- 5.2 Export Analysis – Segment
- 5.2.1 Type 1 (HS Code)
- 5.2.2 Type 2 (HS Code)
- 5.2.3 Type 3 (HS Code)
- 5.2.4 Type 4 (HS Code)
- 5.2.5 Type 5 (HS Code)
- 5.3 Import Analysis – Segment
- 5.3.1 Type 1 (HS Code)
- 5.3.2 Type 2 (HS Code)
- 5.3.3 Type 3 (HS Code)
- 5.3.4 Type 4 (HS Code)
- 5.3.5 Type 5 (HS Code)
- 5.4 Average Unit Trade Prices
- 5.4.1 Average Export Price – Segment & Country
- 5.4.2 Average Import Price – Segment & Source Country
- 5.4.3 Price Trends (2024)
- 5.5 Key Trade Route Analysis
- 5.5.1 Trade Route 1
- 5.5.2 Trade Route 2
- 5.5.3 Trade Route 3
- 5.5.4 Trade Route 4
- 5.5.5 Trade Route 5
- 5.6 Trade Policy Impact Assessment
- 5.6.1 US Anti-Dumping & Section 301 Tariffs
- 5.6.2 EU Customs Union Impact
- 5.6.3 Major Free Trade Agreements
- 5.6.4 USMCA Rules of Origin
Note: Trade policy analysis will be included only where relevant to the U.S. Synthetic Resin market.
Chapter 6. Competitive Landscape & Company Benchmarking
- 6.1 U.S. Synthetic Resin Market Concentration & Structure
- 6.1.1 Herfindahl-Hirschman Index (HHI) – vs. 2024
- 6.1.2 Tier 1, Tier 2 & Tier 3 Market Structure
- 6.1.3 Global, Regional & Local Player Dynamics
- 6.2 U.S. Synthetic Resin Market Share Analysis – 2024
- 6.2.1 Global Revenue Share by Company
- 6.2.2 Global Volume Share by Company
- 6.2.3 Regional Revenue Share
- 6.2.4 Market Share Evolution ( vs. 2024)
- 6.2.5 OEM Segment Share by Company
- 6.2.6 Replacement Segment Share by Company
- 6.3 Production/Delivery Capacity & Facility Analysis
- 6.3.1 Global Installed Capacity
- 6.3.2 Capacity Utilization Rates
- 6.3.3 Production/Output Volume
- 6.3.4 Facility Locations & Capacity Map
- 6.3.5 Planned Capacity Additions
- 6.4 U.S. Synthetic Resin Competitive Benchmarking Matrix
- 6.4.1 Revenue, Volume, CAGR & Profitability Comparison
- 6.4.2 Channel Revenue Mix
- 6.4.3 Geographic Revenue Exposure
- 6.4.4 R&D Intensity
- 6.4.5 Sustainability Maturity
- 6.5 Strategic Developments in U.S. Synthetic Resin (Last 24 Months)
- 6.5.1 Mergers, Acquisitions & Divestments
- 6.5.2 New U.S. Synthetic Resin Launches
- 6.5.3 Facility Expansions
- 6.5.4 Strategic Alliances, Joint Ventures & Partnerships
- 6.5.5 Distribution Expansion & Market Entry
- 6.5.6 Sustainability & ESG Initiatives
- 6.6 Competitive Strategy Mapping
- 6.6.1 Leader, Challenger, Follower & Niche Classification
- 6.6.2 Pricing Strategy Comparison
- 6.6.3 Channel Strategy Matrix
Note: Strategic developments are included based on their materiality and the availability of reliable information.
Chapter 7. Global U.S. Synthetic Resin Market – By Distribution Channel
- 7.1 Segment Overview
- 7.1.1 Volume & Revenue Split by Channel (2024 & 2032)
- 7.1.2 Channel Mix Evolution (2024-2032)
Chapter 8. Regional Market Analysis – Global Overview
- 8.1 Global Regional Overview
- 8.1.1 Regional Volume Share
- 8.1.2 Regional Revenue Share
- 8.1.3 Regional Volume by Region
- 8.1.4 Regional Revenue by Region
- 8.1.5 Regional Forecast Through 2032
- 8.2 Cross-Regional Segment Analysis
- 8.2.1 By Distribution Channel
- 8.2.2 By Brand/Price Tier
Chapter 9. North America U.S. Synthetic Resin Market
- 9.1 United States
- 9.2 Canada
- 9.3 Mexico
Chapter 10. Europe U.S. Synthetic Resin Market
- 10.1 Germany
- 10.2 France
- 10.3 Italy
- 10.4 United Kingdom
- 10.5 Spain
- 10.6 Poland
- 10.7 Russia
- 10.8 Netherlands
- 10.9 Belgium
- 10.10 Sweden
- 10.11 Denmark
- 10.12 Norway
- 10.13 Rest of Europe
Chapter 11. Asia Pacific U.S. Synthetic Resin Market
- 11.1 China
- 11.2 India
- 11.3 Japan
- 11.4 South Korea
- 11.5 Thailand
- 11.6 Indonesia
- 11.7 Vietnam
- 11.8 Malaysia
- 11.9 Australia
- 11.10 Rest of Asia Pacific
Chapter 12. Latin America U.S. Synthetic Resin Market
- 12.1 Brazil
- 12.2 Argentina
- 12.3 Colombia
- 12.4 Chile
- 12.5 Rest of Latin America
Chapter 13. Middle East U.S. Synthetic Resin Market
- 13.1 Saudi Arabia
- 13.2 United Arab Emirates
- 13.3 Turkey
- 13.4 Israel
- 13.5 Iran
- 13.6 Rest of the Middle East
Chapter 14. Africa U.S. Synthetic Resin Market
- 14.1 South Africa
- 14.2 Egypt
- 14.3 Nigeria
- 14.4 Morocco
- 14.5 Rest of Africa
Chapter 15. U.S. Synthetic Resin Company Profiles
- 15.1 [Company 01]
- 15.1.1 Company Overview
- 15.1.2 Key Management Personnel
- 15.1.3 Products & Services Portfolio
- 15.1.4 Financial Performance
- 15.1.5 Key Market Focus & Geographic Presence
- 15.1.6 Recent Developments & Strategic Initiatives
Note: The company profile list is preliminary and may change based on research findings, market developments, data availability, and client requirements.
Chapter 16. Appendices
- Appendix A – List of Abbreviations & Acronyms
- Appendix B – Industry Classification Code Reference – Full Series
- Appendix C – Production & Capacity Data Tables
- Appendix D – End-Use & Demand Base Tables
- Appendix E – Consumption & Replacement Rate Assumptions
- Appendix F – ASP Reference Tables
- Appendix G – Manufacturing & Facility Database
- Appendix H – Import-Export Data Tables
- Appendix I – Regulatory Summary Tables
- Appendix J – Primary Research Participant List (Anonymized)
- Appendix K – Primary Research Questionnaire Framework
- Appendix L – Data Sources & Bibliography
- Appendix M – Market Size Divergence & Source Comparison
Chapter 17. Research Methodology
- 17.1 Research Framework & Philosophy
- 17.2 Secondary Research – Sources, Hierarchy & Data Extraction
- 17.3 Data Modeling – Bottom-Up & Top-Down Market Sizing
- 17.4 Primary Research – Stakeholder Framework, LOI & Sample Sizes
- 17.5 Forecast Methodology – Regression, Scenario & Sensitivity Analysis
- 17.6 Quality Control – Four-Layer Validation Framework
- 17.7 Limitations & Standard Assumptions
- 17.8 Disclaimer
