
Market Overview
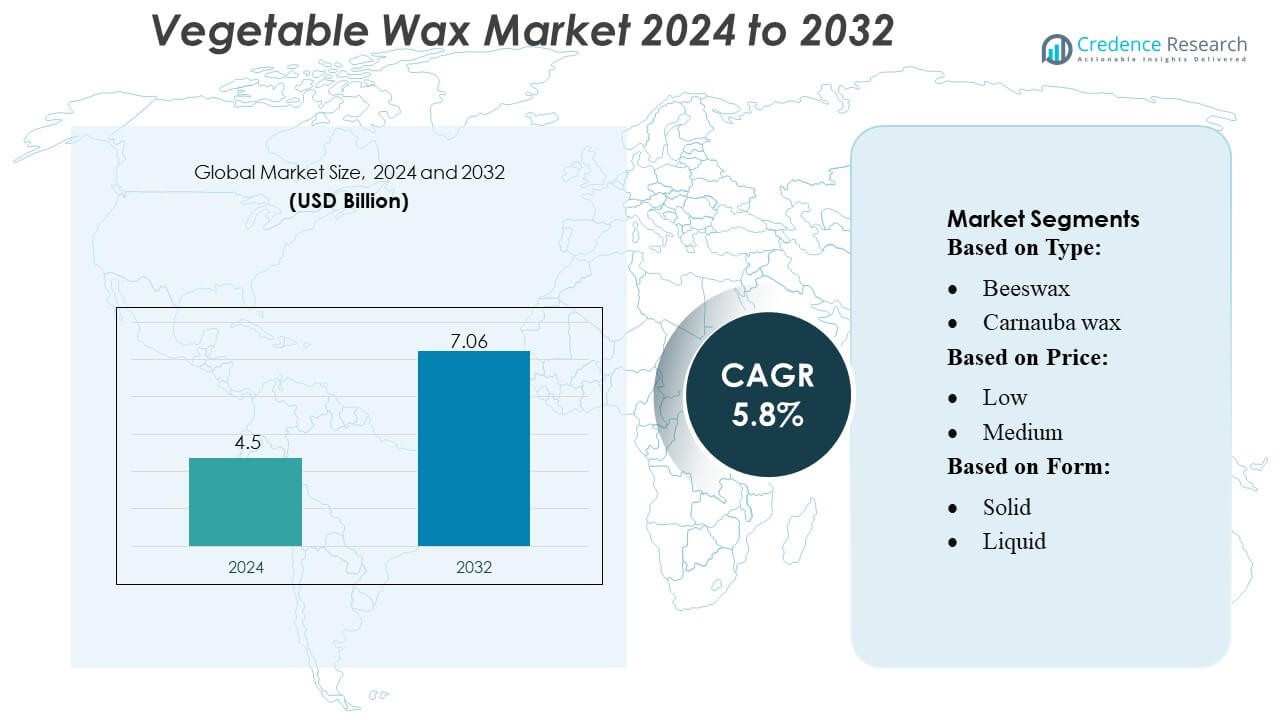
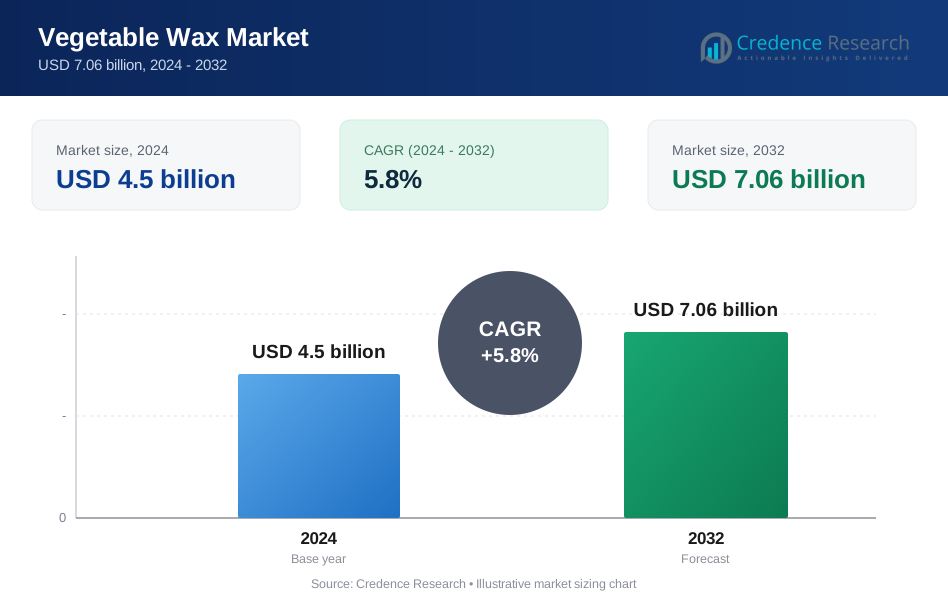
Vegetable Wax Market size was valued USD 4.5 billion in 2024 and is anticipated to reach USD 7.06 billion by 2032, at a CAGR of 5.8% during the forecast period.
| REPORT ATTRIBUTE | DETAILS |
|---|---|
| Historical Period | 2020-2023 |
| Base Year | 2024 |
| Forecast Period | 2025-2032 |
| Vegetable Wax Market Size 2024 | USD 4.5 Billion |
| Vegetable Wax Market, CAGR | 5.8% |
| Vegetable Wax Market Size 2032 | USD 7.06 Billion |
The Vegetable Wax Market features a competitive environment shaped by major global participants such as Evonik Industries AG, BP P.L.C, The International Group, Inc., Dow, Sasol Limited, Nippon Seiro Co., Ltd, Exxon Mobil Corporation, HollyFrontier Corporation, BASF SE, and Baker Hughes Company, all focusing on expanding bio-based wax portfolios and enhancing processing technologies. These companies strengthen competitiveness through high-purity grades, sustainable sourcing, and application-specific performance improvements across cosmetics, food coatings, and industrial uses. Asia-Pacific leads the global market with an exact market share of 36%, driven by abundant agricultural resources, strong manufacturing capacity, and rising demand for natural, plant-derived ingredients.
Market Insights
- The Vegetable Wax Market reached USD 4.5 billion in 2024 and is projected to grow to USD 7.06 billion by 2032, registering a CAGR of 5.8% during the forecast period.
- Growing demand for natural, biodegradable, and clean-label ingredients drives adoption across cosmetics, food coatings, pharmaceuticals, and specialty industrial applications.
- Market trends reflect rising use of high-purity plant-based waxes in premium beauty products, sustainable packaging, and engineered bio-wax blends designed for enhanced stability and performance.
- Competitive dynamics intensify as leading companies expand production capacity, strengthen sourcing networks, and invest in advanced refining technologies to improve product quality and differentiate offerings.
- Asia-Pacific holds the largest regional share at 36%, supported by strong agricultural resources and manufacturing strength, while the cosmetics and personal care segment leads overall consumption due to broad application in emulsions, balms, and formulation structuring.
 Market Segmentation Analysis:
By Type
Natural waxes represent the dominant segment in the Vegetable Wax Market, accounting for an estimated 62–65% share, supported by rising demand for clean-label, plant-based ingredients across cosmetics, food coatings, and premium candle applications. Within this group, soy wax leads due to its cost-effectiveness, renewable sourcing, and superior fragrance-holding capacity for artisanal and mass-market candles. Carnauba and candelilla waxes strengthen segment growth through expanding use in confectionery glazing and personal care. Increasing preference for sustainable alternatives over mineral and synthetic waxes reinforces the long-term advantage of natural waxes.
- For instance, BP p.l.c. is strengthening its decarbonization capabilities by integrating an advanced hydrogen-based processing system at its Lingen facility in Germany. The planned electrolyzer system is engineered to operate at 100 MW capacity and generate approximately 11,000 tons of green hydrogen annually, replacing fossil-based hydrogen in the refinery's operations.
By Price
The medium-priced segment holds the largest share of the Vegetable Wax Market, estimated at 48–52%, as it balances performance, quality, and affordability for end users in cosmetics, packaging, food coatings, and candle manufacturing. Medium-priced natural waxes such as soy, candelilla, and blended plant waxes are widely adopted due to stable supply, consistent melting points, and broader formulation compatibility. Rising small-scale and premium candle producers fuel demand for mid-range waxes that offer improved burn quality compared to low-priced products while remaining more cost-efficient than high-purity specialty waxes.
- For instance, The International Group, Inc. (IGI) has expanded its medium-range wax portfolio with formulations such as IGI 4630 Harmony Blend and IGI 6028 Paraffin Blend.
By Form
Solid waxes dominate the Vegetable Wax Market with approximately 55–58% share, driven by their extensive use in candles, cosmetics, polishes, food glazing, pharmaceuticals, and industrial coatings. Solid vegetable waxes-particularly soy, carnauba, and candelilla-benefit from longer shelf life, ease of molding, and stable structural characteristics essential for premium candle manufacturing and cosmetic sticks. Liquid waxes such as jojoba find growing adoption in skincare, while flakes gain traction for easy blending in industrial and personal-care formulations. However, solids remain the preferred form due to widespread compatibility and cost efficiency.
Key Growth Drivers
Rising Demand for Natural and Sustainable Ingredients
The Vegetable Wax Market grows strongly as consumer and industry preferences shift toward natural, biodegradable, and plant-derived materials. Brands in cosmetics, personal care, and food packaging replace petroleum-based waxes with sustainable alternatives such as soy, carnauba, candelilla, and beeswax substitutes to meet clean-label and eco-friendly standards. Regulatory pressure supporting bio-based raw materials further accelerates adoption. Manufacturers benefit from growing applications in lip care, skincare, candles, and food coatings, where plant-based waxes offer performance, safety, and environmental advantages that strengthen long-term market demand.
- For instance, Dow advanced its bio-based materials portfolio through the launch of SURLYN™ REN ionomers, documented to contain up to 30% certified renewable feedstock based on mass balance accounting.
Expanding Use in Cosmetics, Personal Care, and Food Industries
Vegetable waxes experience robust growth due to their increasing use in cosmetics and personal care formulations that require natural emollients, stabilizers, and structuring agents. Their compatibility with oils, butters, and active ingredients makes them essential in lip balms, lotions, mascaras, and hair-care products. In the food sector, waxes support glazing, coating, and moisture-barrier applications for fruits, confectionery, and bakery products. Rising global consumption of processed foods, premium cosmetics, and organic personal care products drives higher production volumes and encourages manufacturers to broaden their portfolio of performance-enhanced vegetable wax grades.
- For instance, Sasol’s technical sheets confirm that its FT-derived wax grades such as Sasolwax C80 and Sasolwax C105 exhibit controlled congealing points of approximately 83°C and 102°C respectively.
R&D Advancements in Plant-Derived Wax Processing and Customization
Innovation in extraction, refining, and hydrogenation technologies enables producers to enhance hardness, melting point, and stability characteristics of vegetable waxes, expanding their suitability across industrial and commercial applications. Tailored grades now serve niche needs in pharmaceuticals, printing, polishes, packaging, and adhesives. Increased investment in high-purity and multifunctional waxes strengthens product differentiation and allows natural waxes to compete more effectively with synthetic alternatives. The focus on improving performance consistency, supply sustainability, and cost efficiency supports broader market penetration across emerging and developed economies.
Key Trends & Opportunities
Growing Adoption in Premium and Organic Beauty Products
A key trend shaping the Vegetable Wax Market is the accelerated use of plant-based waxes in luxury and organic beauty categories. Consumers favor formulations free from paraffin and microcrystalline waxes, driving brands to incorporate soy, sunflower, jojoba, and carnauba waxes for texture enhancement and natural claim positioning. This shift creates opportunities for suppliers offering certified organic, vegan, and allergen-free wax grades. As global clean beauty spending rises, manufacturers gain a competitive edge by developing high-performance wax blends tailored for premium skincare, makeup, and personal grooming applications.
- For instance, Nippon Seiro Co., Ltd. documented advancements in its refined wax production with technical specifications for high-performance Fischer-Tropsch (FT) grades, such as those in the FNP series. The FNP-0090 grade has a typical congealing point of 90°C and a penetration value of 3 dmm at 25°C, while the FNP-0080 grade has a congealing point of 80°C and a penetration value of 8 dmm at 25°C, according to the company’s official datasheets.
Rising Integration in Sustainable Packaging and Industrial Applications
Vegetable waxes gain traction in packaging and industrial sectors as companies adopt biodegradable coatings, polishes, lubricants, and protective films. Their ability to provide gloss, water resistance, and surface protection without environmental toxicity offers strong competitive benefits. Opportunities expand in paper packaging, flexible films, and food-contact coatings where sustainability commitments guide material selection. Demand also increases for plant-based waxes in textile treatments, rubber processing, and eco-friendly polishes, enabling manufacturers to tap into new revenue streams aligned with global circular economy initiatives.
- For instance, ExxonMobil Corporation advanced sustainable packaging feedstock development through its Exxtend™ technology, with the Baytown plant documented to process up to 40,000 metric tons of plastic waste per year, enabling production of certified-circular polymers used in coatings and packaging materials.
Product Innovation and Bio-Based Blending Opportunities
The market witnesses rising opportunities in the development of multifunctional wax blends that combine plant-derived waxes with other bio-based additives for improved stability and performance. These innovations help overcome limitations such as variable melting points and hardness. Blends designed for high-temperature applications, enhanced slip characteristics, or improved compatibility with natural oils support wider formulation flexibility across cosmetics, pharmaceuticals, printing, and packaging. The shift toward engineered bio-wax systems strengthens competitive positioning while supporting cost-effective and scalable use of natural waxes in diverse applications.
Key Challenges
Price Volatility and Irregular Raw Material Supply
The Vegetable Wax Market faces challenges due to fluctuating prices of plant-derived feedstocks such as soybeans, palm, carnauba leaves, and candelilla shrubs. Seasonal variations, climatic disruptions, geopolitical factors, and agricultural yield uncertainties affect supply stability and procurement costs. This volatility creates pressure on manufacturers and end users that rely on consistent input quality and pricing. Companies must manage supply chain risks through diversified sourcing, long-term supplier agreements, and investments in cultivation programs to ensure steady availability of natural wax materials.
Limitations Compared to Synthetic Waxes in High-Performance Applications
Despite growing demand for natural alternatives, vegetable waxes face performance constraints in applications requiring extreme temperature resistance, high hardness, or chemical stability, where synthetic waxes like polyethylene or Fischer-Tropsch types hold an advantage. These limitations restrict adoption in industrial coatings, automotive polishes, and advanced manufacturing processes. Manufacturers must invest in refining technologies, bio-engineering, and advanced blending strategies to bridge performance gaps. Without sustained innovation, natural waxes risk slower penetration into specialized industrial sectors dominated by synthetic alternatives.
Regional Analysis
North America
North America accounts for an estimated 28–30% share of the Vegetable Wax Market, driven by strong demand from premium candle producers, natural cosmetics brands, and the growing shift toward sustainable packaging materials. The U.S. leads regional consumption as manufacturers adopt soy, candelilla, and blended plant-based waxes to meet clean-label and vegan product requirements. Expanding artisanal candle businesses, rising preference for non-toxic home fragrances, and the presence of established personal care formulators strengthen market expansion. Supportive regulatory standards for bio-based materials further accelerate adoption across food coatings, pharmaceuticals, and industrial applications.
Europe
Europe holds approximately 26–28% market share, supported by stringent environmental regulations, consumer preference for natural ingredients, and strong demand from the cosmetics, confectionery, and pharmaceutical sectors. Germany, France, and the U.K. anchor regional growth with extensive use of carnauba, candelilla, and specialty blended waxes in personal care, food glazing, and clean-label packaging solutions. The region’s mature organic and vegan product markets encourage rapid substitution of mineral and synthetic waxes. Rising investments in sustainable manufacturing and expanding imports of plant-based waxes from Brazil and Mexico further reinforce Europe’s position in the global market.
Asia Pacific
Asia Pacific leads the Vegetable Wax Market with 32–35% share, driven by large-scale manufacturing hubs, expanding cosmetics consumption, and strong adoption of soy and palm-derived waxes across India, China, and Southeast Asia. The region benefits from abundant raw material availability and a rapidly growing candle export industry. Rising consumer inclination toward natural skincare, increased use of vegetable waxes in food coatings, and expanding industrial applications such as polishes and lubricants contribute to sustained growth. Competitive production costs and improving supply chain networks further position Asia Pacific as the fastest-growing regional market.
Latin America
Latin America captures an estimated 6–8% share, with growth anchored by Brazil and Mexico-key suppliers of carnauba and candelilla wax used in global cosmetics, confectionery, and pharmaceutical applications. Expanding local processing capabilities, rising participation in sustainable ingredient exports, and growing demand for natural personal care products support regional development. The increasing shift toward organic food glazing and eco-friendly candle materials also boosts consumption. However, fluctuations in raw material output due to climate conditions and reliance on export-driven demand moderately affect long-term stability, although global clean-label trends sustain steady regional momentum.
Middle East & Africa
The Middle East & Africa region holds approximately 4–5% market share, characterized by steady demand in cosmetics, food coatings, and specialty industrial products. Growth is driven by rising adoption of natural waxes in premium beauty brands across the Gulf Cooperation Council (GCC) countries and increasing use of plant-based coatings in confectionery and bakery sectors. South Africa contributes to demand through expanding personal care and candle markets. Although the region relies heavily on imports of soy, carnauba, and candelilla waxes, improving distribution networks and rising consumer preference for natural alternatives support long-term growth potential.
Market Segmentations:
By Type:
- Beeswax
- Carnauba wax
By Price:
- Low
- Medium
By Form:
- Solid
- Liquid
By Geography
- North America
- U.S.
- Canada
- Mexico
- Europe
- Germany
- France
- U.K.
- Italy
- Spain
- Rest of Europe
- Asia Pacific
- China
- Japan
- India
- South Korea
- South-east Asia
- Rest of Asia Pacific
- Latin America
- Brazil
- Argentina
- Rest of Latin America
- Middle East & Africa
- GCC Countries
- South Africa
- Rest of the Middle East and Africa
Competitive Landscape
The Vegetable Wax Market features a diversified competitive landscape, with leading participants including Evonik Industries AG, BP P.L.C, The International Group, Inc., Dow, Sasol Limited, Nippon Seiro Co., Ltd, Exxon Mobil Corporation, HollyFrontier Corporation, BASF SE, and Baker Hughes Company. the Vegetable Wax Market is characterized by increasing innovation, expanding production capabilities, and a growing focus on sustainability-driven product development. Companies emphasize advanced refining, hydrogenation, and blending technologies to enhance melt stability, hardness, and compatibility with cosmetic, food, and industrial formulations. Market participants strengthen portfolios by introducing high-purity and multifunctional wax grades that align with clean-label and eco-friendly requirements. Competitive strategies include expanding sourcing networks for reliable plant-based feedstocks, investing in organic certification, and targeting fast-growing applications such as premium beauty products, food coatings, and biodegradable packaging. Continuous R&D, regional capacity expansion, and strategic partnerships with downstream manufacturers enable companies to improve cost efficiency and achieve broader market penetration.
Key Player Analysis
- Evonik Industries AG
- BP P.L.C
- The International Group, Inc.
- Dow
- Sasol Limited
- Nippon Seiro Co., Ltd
- Exxon Mobil Corporation
- HollyFrontier Corporation
- BASF SE
- Baker Hughes Company
Recent Developments
- In October 2024, Food Tech Valley established a 27-year agreement with hydroponic farming company Badia Farms, which is backed by Gulf Islamic Investments (GII). This strategic partnership aims to boost the UAE's food security and promote sustainable, year-round fruit and vegetable cultivation using advanced technology.
- In August 2024, Sasol Chemicals has introduced SASOLWAX LC100, an industrial wax grade with a reported 35% carbon footprint reduction, designed for use in packaging adhesives. Sasol Chemicals has introduced SASOLWAX LC100, an industrial wax grade with a 35% lower carbon footprint, further enhancing its sustainable product portfolio.
- In April 2024, ExxonMobil launched the new wax product brand, Prowaxx, to provide a clearer and more differentiated product portfolio for customers. The new brand serves as an anchor for the company's wax offerings and introduces new, scalable naming conventions for future products.
- In April 2023, Dole Food Company launched a new, sweeter, and juicier pineapple called the Dole® Golden Selection® to meet consumer demand. This new pineapple is available at select U.S. and Canadian supermarkets and is cultivated in Costa Rica to have a more vibrant tropical flavor that balances sweetness and tartness.
Report Coverage
The research report offers an in-depth analysis based on Type, Price, Form and Geography. It details leading market players, providing an overview of their business, product offerings, investments, revenue streams, and key applications. Additionally, the report includes insights into the competitive environment, SWOT analysis, current market trends, as well as the primary drivers and constraints. Furthermore, it discusses various factors that have driven market expansion in recent years. The report also explores market dynamics, regulatory scenarios, and technological advancements that are shaping the industry. It assesses the impact of external factors and global economic changes on market growth. Lastly, it provides strategic recommendations for new entrants and established companies to navigate the complexities of the market.
Future Outlook
- The market will witness rising adoption of natural waxes as industries shift toward biodegradable and sustainable raw materials.
- Demand from cosmetics and personal care manufacturers will grow as brands focus on clean-label and vegan-friendly formulations.
- Food processing and packaging sectors will expand usage of plant-based waxes for coatings and surface protection.
- Advances in refining and hydrogenation technologies will enhance performance characteristics and widen industrial applications.
- Premium beauty and organic product segments will drive higher consumption of high-purity wax grades.
- Blended bio-wax solutions will gain traction as manufacturers seek improved stability and multifunctionality.
- Regional producers will invest in supply chain resilience to manage raw material volatility and environmental uncertainties.
- Regulatory support for renewable and low-emission materials will accelerate global market penetration.
- Export opportunities will increase as Asian and Latin American suppliers strengthen production and processing capabilities.
- Circular economy initiatives will boost adoption of vegetable waxes in eco-friendly coatings, packaging, and specialty industrial applications.
Request a Free Sample
Fill in your details and we'll send you a free sample report.
- Sample data tables & charts
- Research methodology
Need a Custom Version of This Report?
Tailor the scope, geography, or segments to your exact requirements.
- Custom geography or segment scope
- Direct access to our analyst team
Frequently Asked Questions
What is the current market size for the Vegetable Wax Market, and what is its projected size in 2032?
At what Compound Annual Growth Rate is the Vegetable Wax Market projected to grow between 2025 and 2032?
Which Vegetable Wax Market segment held the largest share in 2024?
What are the primary factors fueling the growth of the Vegetable Wax Market?
Who are the leading companies in the Vegetable Wax Market?
Which region commanded the largest share of the Vegetable Wax Market in 2024?
Table of Content
Chapter 1. Report Introduction
- 1.1 Report Description & Purpose
- 1.1.1 Report Title & Market Definition
- 1.1.2 Unique Selling Propositions (USP) & Key Differentiators
- 1.1.3 Value Proposition for Stakeholders
- 1.2 Research Objectives
- 1.2.1 Market Sizing Objectives (Volume & Revenue) (Volume Where Applicable)
- 1.2.2 Segmentation Objectives
- 1.2.3 Competitive Intelligence Objectives
- 1.2.4 Forecast & Scenario Objectives
- 1.3 Report Scope
- 1.3.1 Vegetable Wax Scope – Segments & Subsegments Covered
- 1.3.2 Geographic Scope – Regions & Countries Covered
- 1.3.3 Historical Period, Base Year & Forecast Period (2024; forecast to 2032)
- 1.3.4 Inclusions & Exclusions
- 1.4 Industry Classification & Applicable Codes
- 1.5 Currency, Measurement Units & Valuation Basis
- 1.6 Target Stakeholders
- 1.7 Limitations & Assumptions
Chapter 2. Executive Summary
- 2.1 Global Vegetable Wax Market Snapshot
- 2.1.1 Market Size – Historical (2024) & Forecast (2024-2032) (2024: USD 4.5 billion → 2032: USD 7.06 billion)
- 2.1.2 Volume & Revenue – Global Totals (Volume Where Applicable)
- 2.1.3 Key Market Highlights – Top Five Facts
- 2.2 Vegetable Wax Market Segmentation Snapshot
- 2.2.1 Market Split by Region – 2024 vs. 2032
- 2.3 Competitive Snapshot
- 2.3.1 Top 10 Players by Revenue Share – 2024
- 2.3.2 Top 10 Players by Volume Share – 2024 (Volume Where Applicable)
- 2.3.3 Recent Strategic Developments (18-Month Summary)
- 2.4 Key Investment Highlights & Strategic Conclusions
Chapter 3. Vegetable Wax Market Dynamics & Industry Analysis
- 3.1 Market Overview & Context
- 3.1.1 Vegetable Wax Market Position in the Broader Industry Value Chain
- 3.1.2 Demand Structure & Purchasing Dynamics
- 3.1.3 Market Maturity & Development Stage by Region
- 3.2 Vegetable Wax Market Drivers
- 3.3 Vegetable Wax Market Restraints & Challenges
- 3.4 Vegetable Wax Market Opportunities
- 3.5 Porter's Five Forces Analysis
- 3.5.1 Threat of New Entrants
- 3.5.2 Bargaining Power of Suppliers
- 3.5.3 Bargaining Power of Buyers
- 3.5.4 Threat of Substitutes
- 3.5.5 Competitive Rivalry – Intensity Assessment
- 3.6 Vegetable Wax Value Chain Analysis
- 3.6.1 Upstream – Key Inputs, Resources & Suppliers
- 3.6.1.1 Key Input/Resource 1
- 3.6.1.2 Key Input/Resource 2
- 3.6.1.3 Key Input/Resource 3
- 3.6.2 Midstream – Core Operations & Value Creation
- 3.6.2.1 Operating Model & Process Overview
- 3.6.2.2 Key Operating Locations & Capabilities by Company
- 3.6.3 Downstream – Market Channels & End Users
- 3.6.3.1 Direct Sales & Customer Engagement Channels
- 3.6.3.2 Indirect Sales, Intermediaries & Partner Channels
- 3.6.4 Value Chain Profitability Analysis
- 3.6.1 Upstream – Key Inputs, Resources & Suppliers
- 3.7 PESTEL Analysis
- 3.7.1 Political Factors
- 3.7.2 Economic Factors
- 3.7.3 Social Factors
- 3.7.4 Technological Factors
- 3.7.5 Environmental Factors
- 3.7.6 Legal Factors
- 3.8 Vegetable Wax Supply Chain Analysis
- 3.8.1 Critical Input & Resource Availability Risk Assessment
- 3.8.2 Supplier & Operational Concentration Risk (Geographic Exposure)
- 3.8.3 Supply & Service Disruption Impact Analysis
- 3.9 Regulatory & Policy Landscape
Note: The regulatory and policy landscape section covers regulations based on their applicability to the market, Vegetable Wax category, geography, and scope of the study. Only regulatory frameworks with a material impact on operations, compliance, trade, sustainability, or market access are analyzed in detail.
Chapter 4. Key Investment Pockets & Opportunity Analysis
- 4.1 Vegetable Wax Market Attractiveness Analysis
- 4.1.1 By Region – Investment Attractiveness Matrix (Market Size × CAGR)
- 4.2 Absolute Revenue Growth Opportunity
- 4.2.1 By Region – Absolute Revenue Growth Through 2032
- 4.3 Incremental Demand Opportunity
- 4.3.1 By Region – Incremental Demand Through 2032
- 4.3.2 Segment – Incremental Demand
- 4.4 Emerging Submarket Opportunity Deep Dive (Subject to Applicability)
- 4.5 Priority Market Opportunity Scorecards
- 4.5.1 United States
- 4.5.2 Europe
- 4.5.3 Asia
- 4.5.4 Middle East & Africa
Note: Priority market opportunity scorecards reflect the geographic scope and strategic relevance of the study. Listed markets are indicative and may be adapted to the industry.
Chapter 5. Vegetable Wax Cross-Border Trade & Market Access Analysis
- 5.1 International Trade & Cross-Border Activity Overview
- 5.1.1 Global Export Value by Country (2024)
- 5.1.2 Global Export Volume by Country (2024) (Volume Where Applicable)
- 5.1.3 Global Import Value by Country (2024)
- 5.1.4 Global Import Volume by Country (2024) (Volume Where Applicable)
- 5.1.5 Net Trade Balance by Country (2024)
- 5.2 Export Analysis – Segment
- 5.2.1 Category 1 (Applicable Classification Code)
- 5.2.2 Category 2 (Applicable Classification Code)
- 5.2.3 Category 3 (Applicable Classification Code)
- 5.2.4 Category 4 (Applicable Classification Code)
- 5.2.5 Category 5 (Applicable Classification Code)
- 5.3 Import Analysis – Segment
- 5.3.1 Category 1 (Applicable Classification Code)
- 5.3.2 Category 2 (Applicable Classification Code)
- 5.3.3 Category 3 (Applicable Classification Code)
- 5.3.4 Category 4 (Applicable Classification Code)
- 5.3.5 Category 5 (Applicable Classification Code)
- 5.4 Cross-Border Pricing & Transaction Benchmarks
- 5.4.1 Export Pricing – Segment & Country
- 5.4.2 Import Pricing – Segment & Source Country
- 5.4.3 Price Trends (2024)
- 5.5 Key Cross-Border Trade & Delivery Routes
- 5.5.1 Cross-Border Trade/Delivery Route 1
- 5.5.2 Cross-Border Trade/Delivery Route 2
- 5.5.3 Cross-Border Trade/Delivery Route 3
- 5.5.4 Cross-Border Trade/Delivery Route 4
- 5.5.5 Cross-Border Trade/Delivery Route 5
- 5.6 Trade Policy & Market Access Impact Assessment
- 5.6.1 Tariff & Non-Tariff Barriers
- 5.6.2 Regional Trade & Economic Integration Frameworks
- 5.6.3 Bilateral & Multilateral Trade Agreements
- 5.6.4 Cross-Border Operating, Licensing & Localization Requirements
Note: This chapter applies where cross-border trade or delivery is relevant to Vegetable Wax. Goods, services, and digital offerings are assessed using applicable classifications and transaction measures. Import-export volumes, trade balances, and route analyses are included only where meaningful to the market.
Chapter 6. Competitive Landscape & Company Benchmarking
- 6.1 Vegetable Wax Market Concentration & Structure
- 6.1.1 Herfindahl-Hirschman Index (HHI) – vs. 2024
- 6.1.2 Leading, Mid-Sized & Emerging Player Structure
- 6.1.3 Global, Regional & Local Player Dynamics
- 6.2 Vegetable Wax Market Share Analysis – 2024
- 6.2.1 Global Revenue Share by Company
- 6.2.2 Global Volume Share by Company (Volume Where Applicable)
- 6.2.3 Regional Revenue Share
- 6.2.4 Market Share Evolution ( vs. 2024)
- 6.2.5 Company Market Share by Key Segment
- 6.2.6 Company Market Share by Customer Group
- 6.3 Operating Scale, Capacity & Infrastructure Analysis
- 6.3.1 Global Operating Scale & Supply Capacity
- 6.3.2 Resource Utilization & Operating Efficiency
- 6.3.3 Output, Service Delivery & Activity Metrics
- 6.3.4 Operating Footprint & Infrastructure Map
- 6.3.5 Planned Operational & Capacity Expansion
- 6.4 Vegetable Wax Competitive Benchmarking Matrix
- 6.4.1 Revenue, Growth, Profitability & Operating Metric Comparison
- 6.4.2 Channel Revenue Mix
- 6.4.3 Geographic Revenue Exposure
- 6.4.4 R&D Intensity
- 6.4.5 Sustainability Maturity
- 6.5 Strategic Developments in Vegetable Wax (Last 24 Months)
- 6.5.1 Mergers, Acquisitions & Divestments
- 6.5.2 New Products, Services & Solutions in Vegetable Wax
- 6.5.3 Operational & Infrastructure Expansions
- 6.5.4 Strategic Alliances, Joint Ventures & Partnerships
- 6.5.5 Distribution Expansion & Market Entry
- 6.5.6 Sustainability & ESG Initiatives
- 6.6 Competitive Strategy Mapping
- 6.6.1 Leader, Challenger, Follower & Niche Classification
- 6.6.2 Pricing Strategy Comparison
- 6.6.3 Channel Strategy Matrix
Note: Strategic developments are included based on their materiality and the availability of reliable information.
Chapter 7. Global Vegetable Wax Market – By Sales & Delivery Channel
- 7.1 Segment Overview
- 7.1.1 Volume & Revenue Split by Channel (2024 & 2032) (Volume Where Applicable)
- 7.1.2 Channel Mix Evolution (2024-2032)
Chapter 8. Regional Market Analysis – Global Overview
- 8.1 Global Regional Overview
- 8.1.1 Regional Volume Share (Volume Where Applicable)
- 8.1.2 Regional Revenue Share
- 8.1.3 Regional Volume by Region (Volume Where Applicable)
- 8.1.4 Regional Revenue by Region
- 8.1.5 Regional Forecast Through 2032
- 8.2 Cross-Regional Segment Analysis
- 8.2.1 By Sales & Delivery Channel
- 8.2.2 By Competitive Positioning & Price Tier
Chapter 9. North America Vegetable Wax Market
- 9.1 United States
- 9.2 Canada
- 9.3 Mexico
Chapter 10. Europe Vegetable Wax Market
- 10.1 Germany
- 10.2 France
- 10.3 Italy
- 10.4 United Kingdom
- 10.5 Spain
- 10.6 Poland
- 10.7 Russia
- 10.8 Netherlands
- 10.9 Belgium
- 10.10 Sweden
- 10.11 Denmark
- 10.12 Norway
- 10.13 Rest of Europe
Chapter 11. Asia Pacific Vegetable Wax Market
- 11.1 China
- 11.2 India
- 11.3 Japan
- 11.4 South Korea
- 11.5 Thailand
- 11.6 Indonesia
- 11.7 Vietnam
- 11.8 Malaysia
- 11.9 Australia
- 11.10 Rest of Asia Pacific
Chapter 12. Latin America Vegetable Wax Market
- 12.1 Brazil
- 12.2 Argentina
- 12.3 Colombia
- 12.4 Chile
- 12.5 Rest of Latin America
Chapter 13. Middle East Vegetable Wax Market
- 13.1 Saudi Arabia
- 13.2 United Arab Emirates
- 13.3 Turkey
- 13.4 Israel
- 13.5 Iran
- 13.6 Rest of the Middle East
Chapter 14. Africa Vegetable Wax Market
- 14.1 South Africa
- 14.2 Egypt
- 14.3 Nigeria
- 14.4 Morocco
- 14.5 Rest of Africa
Chapter 15. Vegetable Wax Company Profiles
- 15.1 [Company 01]
- 15.1.1 Company Overview
- 15.1.2 Key Management Personnel
- 15.1.3 Products & Services Portfolio
- 15.1.4 Financial Performance
- 15.1.5 Key Market Focus & Geographic Presence
- 15.1.6 Recent Developments & Strategic Initiatives
Note: The company profile list is preliminary and may change based on research findings, market developments, data availability, and client requirements.
Chapter 16. Appendices
- Appendix A – List of Abbreviations & Acronyms
- Appendix B – Industry Classification Code Reference – Full Series
- Appendix C – Supply, Output & Operating Capacity Data Tables
- Appendix D – End-Use & Demand Base Tables
- Appendix E – Demand, Adoption & Usage Assumptions
- Appendix F – Pricing & Revenue Metric Reference Tables
- Appendix G – Company Operations & Infrastructure Database
- Appendix H – Cross-Border Trade & Activity Data Tables (Where Applicable)
- Appendix I – Regulatory Summary Tables
- Appendix J – Primary Research Participant List (Anonymized)
- Appendix K – Primary Research Questionnaire Framework
- Appendix L – Data Sources & Bibliography
- Appendix M – Market Size Divergence & Source Comparison
Chapter 17. Research Methodology
- 17.1 Research Framework & Philosophy
- 17.2 Secondary Research – Sources, Hierarchy & Data Extraction
- 17.3 Data Modeling – Bottom-Up & Top-Down Market Sizing
- 17.4 Primary Research – Stakeholder Framework, LOI & Sample Sizes
- 17.5 Forecast Methodology – Regression, Scenario & Sensitivity Analysis
- 17.6 Quality Control – Four-Layer Validation Framework
- 17.7 Limitations & Standard Assumptions
- 17.8 Disclaimer
