
Market Overview
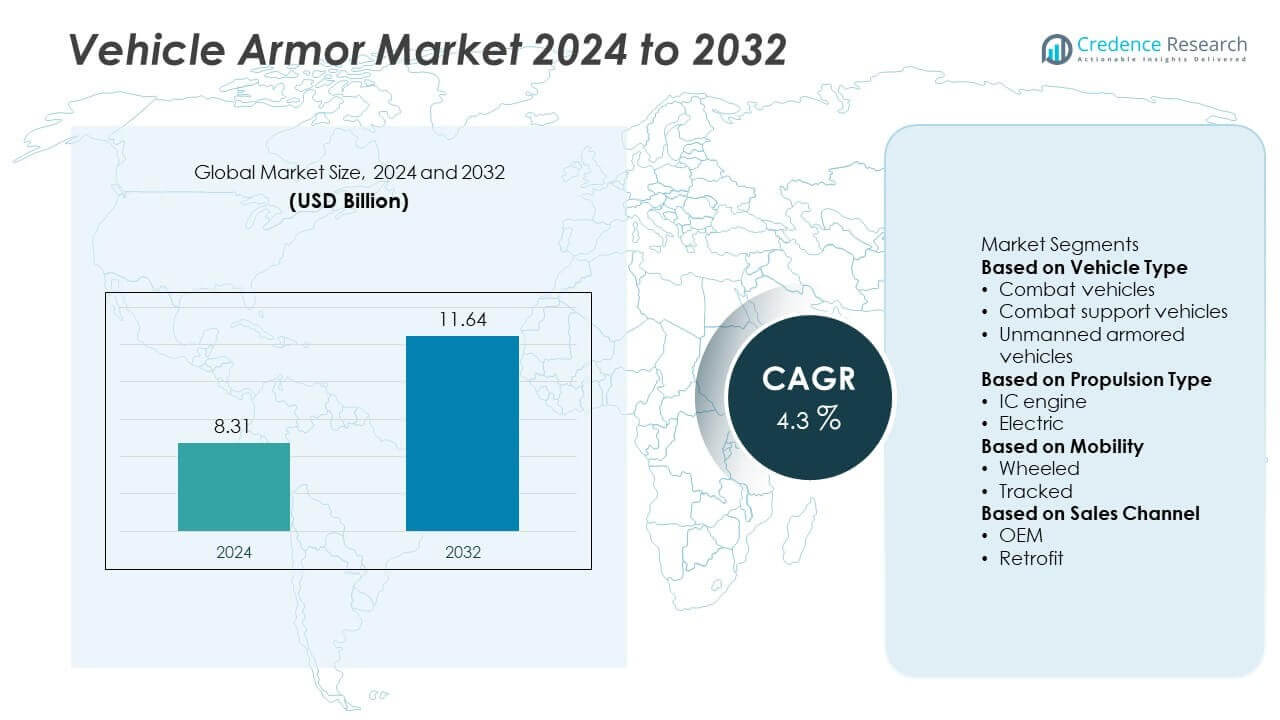
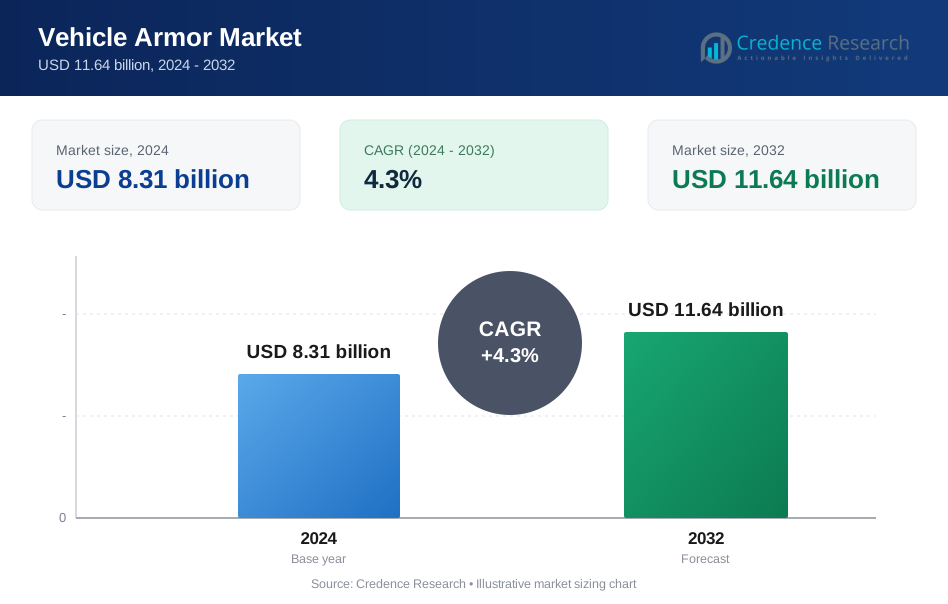
The Vehicle Armor Market was valued at USD 8.31 billion in 2024 and is projected to reach USD 11.64 billion by 2032, growing at a CAGR of 4.3% during the forecast period.
| REPORT ATTRIBUTE | DETAILS |
|---|---|
| Historical Period | 2020-2023 |
| Base Year | 2024 |
| Forecast Period | 2025-2032 |
| Vehicle Armor Market Size 2024 | USD 8.31 Billion |
| Vehicle Armor Market, CAGR | 4.3% |
| Vehicle Armor Market Size 2032 | USD 11.64 Billion |
The vehicle armor market is led by key players such as Oshkosh Corporation, Hanwha Defense, BAE Systems, IVECO Defence Vehicles, Rheinmetall AG, General Dynamics Corporation, Krauss-Maffei Wegmann GmbH & Co., FNSS Defence Systems, L3Harris Technologies, and ST Engineering. These companies dominate through advanced armored vehicle programs, modular armor solutions, and strong global supply chains. North America held 35% share in 2024, driven by high defense spending and modernization programs, while Europe accounted for 28% share, supported by NATO upgrades and collaborative projects. Asia-Pacific captured 25% share, fueled by rising defense budgets and indigenous vehicle production initiatives.
 Market Insights
- The vehicle armor market was valued at USD 8.31 billion in 2024 and is projected to reach USD 11.64 billion by 2032, growing at a CAGR of 4.3% during the forecast period.
- Rising defense budgets and modernization programs are driving demand for advanced armored combat vehicles, which held over 55% share in 2024.
- Market trends include adoption of lightweight composite armor, integration of active protection systems, and development of unmanned armored vehicles to improve survivability and reduce risk to personnel.
- The market is competitive with Oshkosh Corporation, BAE Systems, Rheinmetall AG, and General Dynamics focusing on modular designs, long-term military contracts, and R&D for next-generation protection technologies.
- North America led with 35% share in 2024, followed by Europe at 28% and Asia-Pacific at 25%, with wheeled armored vehicles dominating mobility type with around 60% share due to their cost-effectiveness and operational flexibility.
Market Segmentation Analysis:
By Vehicle Type
Combat vehicles dominated the vehicle armor market in 2024, holding over 55% share due to their extensive deployment in military fleets worldwide. Rising geopolitical tensions and increasing defense budgets are driving procurement of main battle tanks, infantry fighting vehicles, and armored personnel carriers with advanced ballistic protection. Combat support vehicles follow, providing logistics and recovery support in conflict zones, while unmanned armored vehicles are gaining traction for reconnaissance and remote combat missions, driven by the growing need to reduce risks to human soldiers and enhance operational efficiency on the battlefield.
- For instance, Oshkosh Defense delivered military vehicles, including the M-ATV and JLTV platforms, to various defense customers, including the U.S. military and international allies. The JLTV is equipped with a scalable protection system and blast-resistant features designed to withstand improvised explosive devices (IEDs), providing a higher level of crew protection than its predecessors, such as up-armored Humvees.
By Propulsion Type
IC engine-powered vehicles accounted for more than 80% share in 2024, as diesel and gasoline engines remain the primary choice for heavy-duty combat and support vehicles due to their range and reliability. The demand for electric armored vehicles is increasing, supported by advancements in battery technology and the need for silent operation in reconnaissance missions. Militaries are testing hybrid-electric platforms to reduce thermal signatures and improve fuel efficiency, which is expected to gradually expand the share of electric propulsion in the coming years.
- For instance, in 2024, Rheinmetall AG demonstrated its lightweight Ermine family of hybrid-electric vehicles, based on the technology from its subsidiary REEQ, with individual vehicle variants equipped with multiple 30 kW electric motors and a diesel range extender.
By Mobility
Wheeled armored vehicles led the market with around 60% share in 2024, driven by their superior speed, maneuverability, and lower lifecycle costs compared to tracked vehicles. Wheeled platforms are preferred for urban and peacekeeping missions, where rapid deployment and lower road damage are key factors. Tracked vehicles maintain a strong presence in high-intensity combat operations due to their superior off-road mobility and load-bearing capacity. Continuous modernization programs and demand for modular, upgradable platforms are supporting growth in both mobility categories across defense forces worldwide.
Key Growth Drivers
Rising Defense Expenditure and Modernization Programs
Increasing global defense budgets are a major driver for the vehicle armor market. Countries are investing heavily in modernizing armored fleets to address evolving threats, such as asymmetric warfare and cross-border conflicts. Upgrades include advanced composite armor, active protection systems, and modular add-on kits. NATO members, the U.S., India, and China are allocating significant resources to procure and upgrade main battle tanks and infantry fighting vehicles. This spending ensures a steady demand pipeline for manufacturers offering innovative, lightweight, and highly protective armor solutions.
- For instance, in December 2024, BAE Systems secured a contract worth $656.2 million with the U.S. Army to produce additional Bradley M2A4 and M7A4 fighting vehicles by upgrading older versions. The M2A4 variant incorporates an Active Protection System (APS) to enhance crew survivability
Growing Need for Troop Protection in Conflict Zones
The rising frequency of military engagements, peacekeeping missions, and counter-terrorism operations is fueling demand for enhanced armored protection. Vehicle armor systems protect soldiers from ballistic threats, IEDs, and mine blasts, improving survivability in hostile environments. Demand is particularly strong in regions with ongoing conflicts such as the Middle East and Eastern Europe. Armed forces are focusing on solutions that balance protection with mobility, ensuring operational readiness in both urban and rugged terrains, which drives continuous procurement of advanced armored platforms.
- For instance, in early 2025, the Indian Ministry of Defence signed a $248 million contract with Russia's Rosoboronexport for the procurement and licensed domestic production of 1,000-horsepower engines to upgrade its fleet of T-72 tanks, improving their mobility and offensive capabilities.
Technological Advancements in Armor Materials
The market is benefiting from innovations in lightweight composite materials, ceramics, and reactive armor technologies. These advancements improve ballistic protection without significantly increasing vehicle weight, thereby maintaining speed and fuel efficiency. Adoption of modular and scalable armor systems allows for rapid upgrades in response to changing threat levels. Additionally, integration of active protection systems (APS) and stealth technologies is enhancing survivability against modern anti-tank guided missiles and RPGs. These innovations are encouraging defense agencies to invest in next-generation armored vehicles.
Key Trends & Opportunities
Adoption of Hybrid and Electric Armored Vehicles
Militaries are exploring hybrid-electric and fully electric propulsion systems for armored vehicles to reduce thermal and acoustic signatures, improving stealth in combat scenarios. These platforms offer lower operational costs and support sustainability goals. The growing focus on energy-efficient systems presents opportunities for manufacturers to design armor that complements electric drivetrains. Investment in high-capacity batteries and power management systems is expected to accelerate adoption, especially for reconnaissance and light armored vehicles where silent operation provides a tactical advantage.
- For instance, Oshkosh Defense unveiled its hybrid-electric Joint Light Tactical Vehicle (eJLTV) demonstrator in January 2022, integrating a scalable powertrain that can provide up to 115 kilowatts of exportable electric power and enabling silent mobility during reconnaissance missions.
Demand for Modular and Customizable Armor Solutions
There is a rising preference for modular armor kits that allow defense forces to adapt protection levels based on mission requirements. Customizable solutions provide flexibility to upgrade vehicles quickly without complete replacement, reducing lifecycle costs. This trend is creating opportunities for suppliers offering scalable armor technologies and add-on systems. Nations engaged in multiple theaters of operation are prioritizing platforms with interchangeable protection packages to enhance fleet versatility and readiness while keeping procurement budgets under control.
- For instance, Rheinmetall's StrikeShield active protection system, an evolution of its AMAP-ADS technology, was put into series production in 2021 after extensive testing. The modular system is capable of neutralizing threats like rockets and guided missiles within about 10 meters of the vehicle, employing countermeasures with a reaction time measured in microseconds.
Key Challenges
High Development and Procurement Costs
The cost of designing, testing, and deploying advanced vehicle armor systems is significant, which can strain defense budgets, particularly in developing nations. The need for high-performance materials like composites and ceramics adds to overall expenses. Budget limitations can delay procurement cycles or restrict acquisition to only essential units, slowing market growth. Manufacturers must focus on cost optimization and scalable production to make advanced protection systems more affordable for a broader range of military buyers.
Weight and Mobility Constraints
Adding heavy armor to vehicles can compromise speed, maneuverability, and fuel efficiency, limiting operational flexibility. This challenge is critical in scenarios requiring rapid deployment or long-range missions. Balancing protection with mobility remains a key concern for defense forces. Excessive vehicle weight can also strain powertrains and suspension systems, increasing maintenance costs. Continuous innovation in lightweight materials and smart design is essential to overcome these constraints and ensure vehicles remain agile while providing maximum protection.
Regional Analysis
North America
North America held 35% share of the vehicle armor market in 2024, driven by high defense spending and continuous modernization programs. The U.S. Department of Defense is investing in next-generation combat vehicles, active protection systems, and lightweight composite armor solutions. Canada is also upgrading its armored fleets to support NATO commitments and peacekeeping missions. The presence of major defense contractors and research institutions accelerates innovation in advanced ballistic protection technologies. Increasing focus on survivability, troop safety, and multi-role armored platforms continues to strengthen North America’s leading position in global vehicle armor demand.
Europe
Europe accounted for 28% share of the global vehicle armor market in 2024, supported by heightened defense initiatives and regional security challenges. Countries such as Germany, France, and the UK are upgrading main battle tanks and infantry fighting vehicles to meet NATO readiness requirements. Ongoing conflicts in Eastern Europe and rising geopolitical tensions have accelerated procurement of armored vehicles with enhanced protection systems. Collaborative defense programs, including joint research projects, are promoting innovation and cost-sharing. The region’s commitment to military modernization and cross-border defense collaboration is expected to sustain strong demand for vehicle armor solutions.
Asia-Pacific
Asia-Pacific captured 25% share in 2024, making it one of the fastest-growing regions for vehicle armor. China and India are leading with substantial investments in armored vehicle production and fleet expansion. Regional tensions and territorial disputes are driving demand for upgraded protection systems and new-generation combat platforms. Japan, South Korea, and Australia are focusing on strengthening armored capabilities as part of broader defense modernization plans. Local manufacturing initiatives and technology transfer programs are boosting domestic production capacity, while rising defense budgets ensure consistent procurement. Asia-Pacific remains a strategic growth region with significant long-term market potential.
Latin America
Latin America held 7% share of the vehicle armor market in 2024, led by Brazil and Mexico. Demand is fueled by internal security operations, counter-narcotics missions, and modernization of military and police fleets. Armored personnel carriers and tactical vehicles are being increasingly deployed to handle regional security threats and border control. Limited defense budgets constrain large-scale procurement, but international collaborations and government initiatives are helping improve access to advanced vehicle armor technologies. Growth in this region is expected to remain steady as countries enhance domestic defense manufacturing and focus on upgrading security infrastructure.
Middle East & Africa
The Middle East & Africa region accounted for 5% share in 2024, supported by rising investments in defense capabilities and procurement of modern armored vehicles. The UAE and Saudi Arabia are leading adopters, investing heavily in combat vehicle upgrades and ballistic protection technologies. Ongoing regional conflicts and counter-terrorism operations continue to drive demand for mine-resistant, ambush-protected vehicles. In Africa, countries like South Africa and Nigeria are gradually modernizing their armored fleets to improve security and peacekeeping operations. Local assembly partnerships and international defense contracts are helping expand access to advanced armor solutions in this developing market.
Market Segmentations:
By Vehicle Type
- Combat vehicles
- Combat support vehicles
- Unmanned armored vehicles
By Propulsion Type
- IC engine
- Electric
By Mobility
- Wheeled
- Tracked
By Sales Channel
- OEM
- Retrofit
By Geography
- North America
- U.S.
- Canada
- Mexico
- Europe
- Germany
- France
- U.K.
- Italy
- Spain
- Rest of Europe
- Asia Pacific
- China
- Japan
- India
- South Korea
- South-east Asia
- Rest of Asia Pacific
- Latin America
- Brazil
- Argentina
- Rest of Latin America
- Middle East & Africa
- GCC Countries
- South Africa
- Rest of the Middle East and Africa
Competitive Landscape
The competitive landscape of the vehicle armor market is shaped by leading players such as Oshkosh Corporation, Inc., Hanwha Defense, BAE Systems, IVECO Defence Vehicles, Rheinmetall AG, General Dynamics Corporation, Krauss-Maffei Wegmann GmbH & Co., FNSS Defence Systems, L3Harris Technologies, and ST Engineering. These companies focus on developing advanced ballistic protection systems, modular armor kits, and active protection technologies to meet evolving battlefield requirements. Strategic initiatives include long-term contracts with defense ministries, joint ventures, and technology collaborations to expand production capabilities and strengthen global presence. Many players are investing in lightweight composite materials and hybrid vehicle platforms to enhance mobility without compromising protection. R&D efforts are aimed at integrating active protection systems and digital battlefield management tools for improved survivability. Competitive differentiation relies on innovation, cost efficiency, and the ability to deliver customized solutions tailored to specific mission needs and regional defense requirements.
Key Player Analysis
- Oshkosh Corporation, Inc.
- Hanwha Defense
- BAE Systems
- IVECO Defence Vehicles
- Rheinmetall AG
- General Dynamics Corporation
- Krauss-Maffei Wegmann GmbH & Co.
- FNSS Defence Systems
- L3Harris Technologies
- ST Engineering
Recent Developments
- In September 2025, Rheinmetall marked Challenger 3 testing milestones ahead of fielding.
- In September 2025, KNDS confirmed Czech orders for Leopard 2A8 main battle tanks.
- In July 2025, L3Harris unveiled launched-effects vehicles for multidomain operations.
- In 2025, ST Engineering began Terrex-based armored vehicle production in Kazakhstan.
Report Coverage
The research report offers an in-depth analysis based on Vehicle Type, Propulsion Type, Mobility, Sales Channel and Geography. It details leading market players, providing an overview of their business, product offerings, investments, revenue streams, and key applications. Additionally, the report includes insights into the competitive environment, SWOT analysis, current market trends, as well as the primary drivers and constraints. Furthermore, it discusses various factors that have driven market expansion in recent years. The report also explores market dynamics, regulatory scenarios, and technological advancements that are shaping the industry. It assesses the impact of external factors and global economic changes on market growth. Lastly, it provides strategic recommendations for new entrants and established companies to navigate the complexities of the market.
Future Outlook
- Demand for advanced combat vehicles will rise with increasing geopolitical tensions and modernization efforts.
- Lightweight composite materials will see higher adoption to enhance mobility and fuel efficiency.
- Integration of active protection systems will become standard for next-generation armored fleets.
- Hybrid and electric propulsion for armored vehicles will grow to reduce thermal signatures and improve stealth.
- Modular and scalable armor kits will gain popularity for cost-effective fleet upgrades.
- Unmanned armored vehicles will see wider deployment for reconnaissance and high-risk missions.
- Asia-Pacific will experience the fastest growth, driven by rising defense budgets and local production.
- Collaborative defense programs will expand, encouraging joint development of advanced armored platforms.
- Digital battlefield systems and IoT-enabled monitoring will enhance operational readiness.
- Manufacturers will focus on balancing protection, weight, and cost to meet diverse military requirements.
Request a Free Sample
Fill in your details and we'll send you a free sample report.
- Sample data tables & charts
- Research methodology
Need a Custom Version of This Report?
Tailor the scope, geography, or segments to your exact requirements.
- Custom geography or segment scope
- Direct access to our analyst team
Frequently Asked Questions
What is the current market size for Vehicle Armor market, and what is its projected size in 2032?
At what Compound Annual Growth Rate is the Vehicle Armor market projected to grow between 2025 and 2032?
Which Vehicle Armor market segment held the largest share in 2024?
What are the primary factors fueling the growth of the Vehicle Armor market?
Who are the leading companies in the Vehicle Armor market?
Which region commanded the largest share of the Vehicle Armor market in 2024?
Table of Content
Chapter 1. Report Introduction
- 1.1 Report Description & Purpose
- 1.1.1 Report Title & Market Definition
- 1.1.2 Unique Selling Propositions (USP) & Key Differentiators
- 1.1.3 Value Proposition for Stakeholders
- 1.2 Research Objectives
- 1.2.1 Market Sizing Objectives (Volume & Revenue)
- 1.2.2 Segmentation Objectives
- 1.2.3 Competitive Intelligence Objectives
- 1.2.4 Forecast & Scenario Objectives
- 1.3 Report Scope
- 1.3.1 Vehicle Armor Scope – Types & Subtypes Covered
- 1.3.2 Geographic Scope – Regions & Countries Covered
- 1.3.3 Historical Period, Base Year & Forecast Period (2024; forecast to 2032)
- 1.3.4 Inclusions & Exclusions
- 1.4 HS Code & Classification Framework
- 1.5 Currency, Units & Pricing Basis
- 1.6 Target Stakeholders
- 1.7 Limitations & Assumptions
Chapter 2. Executive Summary
- 2.1 Global Vehicle Armor Market Snapshot
- 2.1.1 Market Size – Historical (2024) & Forecast (2024-2032) (2024: USD 8.31 billion → 2032: USD 11.64 billion)
- 2.1.2 Volume & Revenue – Global Totals
- 2.1.3 Key Market Highlights – Top Five Facts
- 2.2 Vehicle Armor Market Segmentation Snapshot
- 2.2.1 Market Split by Region – 2024 vs. 2032
- 2.3 Competitive Snapshot
- 2.3.1 Top 10 Players by Revenue Share – 2024
- 2.3.2 Top 10 Players by Volume Share – 2024
- 2.3.3 Recent Strategic Developments (18-Month Summary)
- 2.4 Key Investment Highlights & Strategic Conclusions
Chapter 3. Vehicle Armor Market Dynamics & Industry Analysis
- 3.1 Market Overview & Context
- 3.1.1 Vehicle Armor Market Position in the Broader Automotive Value Chain
- 3.1.2 OEM vs. Replacement Market Dynamics
- 3.1.3 Market Maturity & Development Stage by Region
- 3.2 Vehicle Armor Market Drivers
- 3.3 Vehicle Armor Market Restraints & Challenges
- 3.4 Vehicle Armor Market Opportunities
- 3.5 Porter's Five Forces Analysis
- 3.5.1 Threat of New Entrants
- 3.5.2 Bargaining Power of Suppliers
- 3.5.3 Bargaining Power of Buyers
- 3.5.4 Threat of Substitutes
- 3.5.5 Competitive Rivalry – Intensity Assessment
- 3.6 Vehicle Armor Value Chain Analysis
- 3.6.1 Upstream – Raw Material/Input Suppliers
- 3.6.1.1 Raw Material/Input 1
- 3.6.1.2 Raw Material/Input 2
- 3.6.1.3 Raw Material/Input 3
- 3.6.2 Midstream – Production/Manufacturing/Service Delivery
- 3.6.2.1 Production/Process Overview
- 3.6.2.2 Key Facility Locations & Capacity by Manufacturer
- 3.6.3 Downstream – Distribution & End Consumer
- 3.6.3.1 Primary Channel – B2B/OEM
- 3.6.3.2 Secondary Channels – Dealer, Retail, Online, Direct
- 3.6.4 Value Chain Profitability Analysis
- 3.6.1 Upstream – Raw Material/Input Suppliers
- 3.7 PESTEL Analysis
- 3.7.1 Political Factors
- 3.7.2 Economic Factors
- 3.7.3 Social Factors
- 3.7.4 Technological Factors
- 3.7.5 Environmental Factors
- 3.7.6 Legal Factors
- 3.8 Vehicle Armor Supply Chain Analysis
- 3.8.1 Raw Material/Input Supply Risk Assessment
- 3.8.2 Manufacturing Concentration Risk (Geographic Exposure)
- 3.8.3 Trade Disruption Impact Analysis
- 3.9 Regulatory & Policy Landscape
Note: The regulatory and policy landscape section covers regulations based on their applicability to the market, Vehicle Armor category, geography, and scope of the study. Only regulatory frameworks with a material impact on operations, compliance, trade, sustainability, or market access are analyzed in detail.
Chapter 4. Key Investment Pockets & Opportunity Analysis
- 4.1 Vehicle Armor Market Attractiveness Analysis
- 4.1.1 By Region – Investment Attractiveness Matrix (Volume × CAGR)
- 4.2 Absolute Revenue Growth Opportunity
- 4.2.1 By Region – Absolute USD Growth Through 2032
- 4.3 Incremental Volume Opportunity
- 4.3.1 By Region – Incremental Volume Through 2032
- 4.3.2 Segment – Incremental Volume
- 4.4 Emerging Submarket Opportunity Deep Dive (Subject to Applicability)
- 4.5 Emerging Market Opportunity Scorecards
- 4.5.1 United States
- 4.5.2 Europe
- 4.5.3 Asia
- 4.5.4 Middle East & Africa
Note: Emerging Market Opportunity Scorecards will be included based on relevance and strategic importance. Regions listed are indicative and may vary depending on data availability and market dynamics.
Chapter 5. Vehicle Armor Import-Export Analysis & Trade Flows
- 5.1 Global Trade Overview
- 5.1.1 Global Export Value by Country (2024)
- 5.1.2 Global Export Volume by Country (2024)
- 5.1.3 Global Import Value by Country (2024)
- 5.1.4 Global Import Volume by Country (2024)
- 5.1.5 Net Trade Balance by Country (2024)
- 5.2 Export Analysis – Segment
- 5.2.1 Type 1 (HS Code)
- 5.2.2 Type 2 (HS Code)
- 5.2.3 Type 3 (HS Code)
- 5.2.4 Type 4 (HS Code)
- 5.2.5 Type 5 (HS Code)
- 5.3 Import Analysis – Segment
- 5.3.1 Type 1 (HS Code)
- 5.3.2 Type 2 (HS Code)
- 5.3.3 Type 3 (HS Code)
- 5.3.4 Type 4 (HS Code)
- 5.3.5 Type 5 (HS Code)
- 5.4 Average Unit Trade Prices
- 5.4.1 Average Export Price – Segment & Country
- 5.4.2 Average Import Price – Segment & Source Country
- 5.4.3 Price Trends (2024)
- 5.5 Key Trade Route Analysis
- 5.5.1 Trade Route 1
- 5.5.2 Trade Route 2
- 5.5.3 Trade Route 3
- 5.5.4 Trade Route 4
- 5.5.5 Trade Route 5
- 5.6 Trade Policy Impact Assessment
- 5.6.1 US Anti-Dumping & Section 301 Tariffs
- 5.6.2 EU Customs Union Impact
- 5.6.3 Major Free Trade Agreements
- 5.6.4 USMCA Rules of Origin
Note: Trade policy analysis will be included only where relevant to the Vehicle Armor market.
Chapter 6. Competitive Landscape & Company Benchmarking
- 6.1 Vehicle Armor Market Concentration & Structure
- 6.1.1 Herfindahl-Hirschman Index (HHI) – vs. 2024
- 6.1.2 Tier 1, Tier 2 & Tier 3 Market Structure
- 6.1.3 Global, Regional & Local Player Dynamics
- 6.2 Vehicle Armor Market Share Analysis – 2024
- 6.2.1 Global Revenue Share by Company
- 6.2.2 Global Volume Share by Company
- 6.2.3 Regional Revenue Share
- 6.2.4 Market Share Evolution ( vs. 2024)
- 6.2.5 OEM Segment Share by Company
- 6.2.6 Replacement Segment Share by Company
- 6.3 Production/Delivery Capacity & Facility Analysis
- 6.3.1 Global Installed Capacity
- 6.3.2 Capacity Utilization Rates
- 6.3.3 Production/Output Volume
- 6.3.4 Facility Locations & Capacity Map
- 6.3.5 Planned Capacity Additions
- 6.4 Vehicle Armor Competitive Benchmarking Matrix
- 6.4.1 Revenue, Volume, CAGR & Profitability Comparison
- 6.4.2 Channel Revenue Mix
- 6.4.3 Geographic Revenue Exposure
- 6.4.4 R&D Intensity
- 6.4.5 Sustainability Maturity
- 6.5 Strategic Developments in Vehicle Armor (Last 24 Months)
- 6.5.1 Mergers, Acquisitions & Divestments
- 6.5.2 New Vehicle Armor Launches
- 6.5.3 Facility Expansions
- 6.5.4 Strategic Alliances, Joint Ventures & Partnerships
- 6.5.5 Distribution Expansion & Market Entry
- 6.5.6 Sustainability & ESG Initiatives
- 6.6 Competitive Strategy Mapping
- 6.6.1 Leader, Challenger, Follower & Niche Classification
- 6.6.2 Pricing Strategy Comparison
- 6.6.3 Channel Strategy Matrix
Note: Strategic developments are included based on their materiality and the availability of reliable information.
Chapter 7. Global Vehicle Armor Market – By Distribution Channel
- 7.1 Segment Overview
- 7.1.1 Volume & Revenue Split by Channel (2024 & 2032)
- 7.1.2 Channel Mix Evolution (2024-2032)
Chapter 8. Regional Market Analysis – Global Overview
- 8.1 Global Regional Overview
- 8.1.1 Regional Volume Share
- 8.1.2 Regional Revenue Share
- 8.1.3 Regional Volume by Region
- 8.1.4 Regional Revenue by Region
- 8.1.5 Regional Forecast Through 2032
- 8.2 Cross-Regional Segment Analysis
- 8.2.1 By Distribution Channel
- 8.2.2 By Brand/Price Tier
Chapter 9. North America Vehicle Armor Market
- 9.1 United States
- 9.2 Canada
- 9.3 Mexico
Chapter 10. Europe Vehicle Armor Market
- 10.1 Germany
- 10.2 France
- 10.3 Italy
- 10.4 United Kingdom
- 10.5 Spain
- 10.6 Poland
- 10.7 Russia
- 10.8 Netherlands
- 10.9 Belgium
- 10.10 Sweden
- 10.11 Denmark
- 10.12 Norway
- 10.13 Rest of Europe
Chapter 11. Asia Pacific Vehicle Armor Market
- 11.1 China
- 11.2 India
- 11.3 Japan
- 11.4 South Korea
- 11.5 Thailand
- 11.6 Indonesia
- 11.7 Vietnam
- 11.8 Malaysia
- 11.9 Australia
- 11.10 Rest of Asia Pacific
Chapter 12. Latin America Vehicle Armor Market
- 12.1 Brazil
- 12.2 Argentina
- 12.3 Colombia
- 12.4 Chile
- 12.5 Rest of Latin America
Chapter 13. Middle East Vehicle Armor Market
- 13.1 Saudi Arabia
- 13.2 United Arab Emirates
- 13.3 Turkey
- 13.4 Israel
- 13.5 Iran
- 13.6 Rest of the Middle East
Chapter 14. Africa Vehicle Armor Market
- 14.1 South Africa
- 14.2 Egypt
- 14.3 Nigeria
- 14.4 Morocco
- 14.5 Rest of Africa
Chapter 15. Vehicle Armor Company Profiles
- 15.1 [Company 01]
- 15.1.1 Company Overview
- 15.1.2 Key Management Personnel
- 15.1.3 Products & Services Portfolio
- 15.1.4 Financial Performance
- 15.1.5 Key Market Focus & Geographic Presence
- 15.1.6 Recent Developments & Strategic Initiatives
Note: The company profile list is preliminary and may change based on research findings, market developments, data availability, and client requirements.
Chapter 16. Appendices
- Appendix A – List of Abbreviations & Acronyms
- Appendix B – Industry Classification Code Reference – Full Series
- Appendix C – Production & Capacity Data Tables
- Appendix D – End-Use & Demand Base Tables
- Appendix E – Consumption & Replacement Rate Assumptions
- Appendix F – ASP Reference Tables
- Appendix G – Manufacturing & Facility Database
- Appendix H – Import-Export Data Tables
- Appendix I – Regulatory Summary Tables
- Appendix J – Primary Research Participant List (Anonymized)
- Appendix K – Primary Research Questionnaire Framework
- Appendix L – Data Sources & Bibliography
- Appendix M – Market Size Divergence & Source Comparison
Chapter 17. Research Methodology
- 17.1 Research Framework & Philosophy
- 17.2 Secondary Research – Sources, Hierarchy & Data Extraction
- 17.3 Data Modeling – Bottom-Up & Top-Down Market Sizing
- 17.4 Primary Research – Stakeholder Framework, LOI & Sample Sizes
- 17.5 Forecast Methodology – Regression, Scenario & Sensitivity Analysis
- 17.6 Quality Control – Four-Layer Validation Framework
- 17.7 Limitations & Standard Assumptions
- 17.8 Disclaimer
