
Market Overview
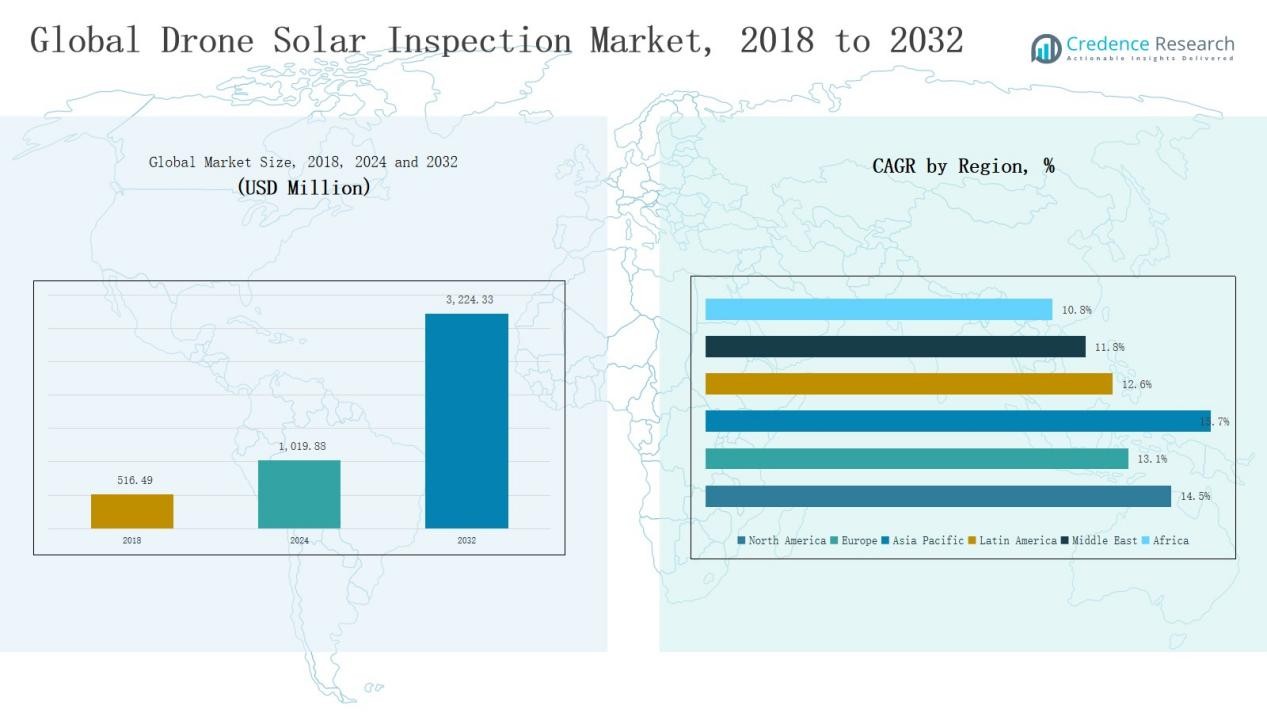
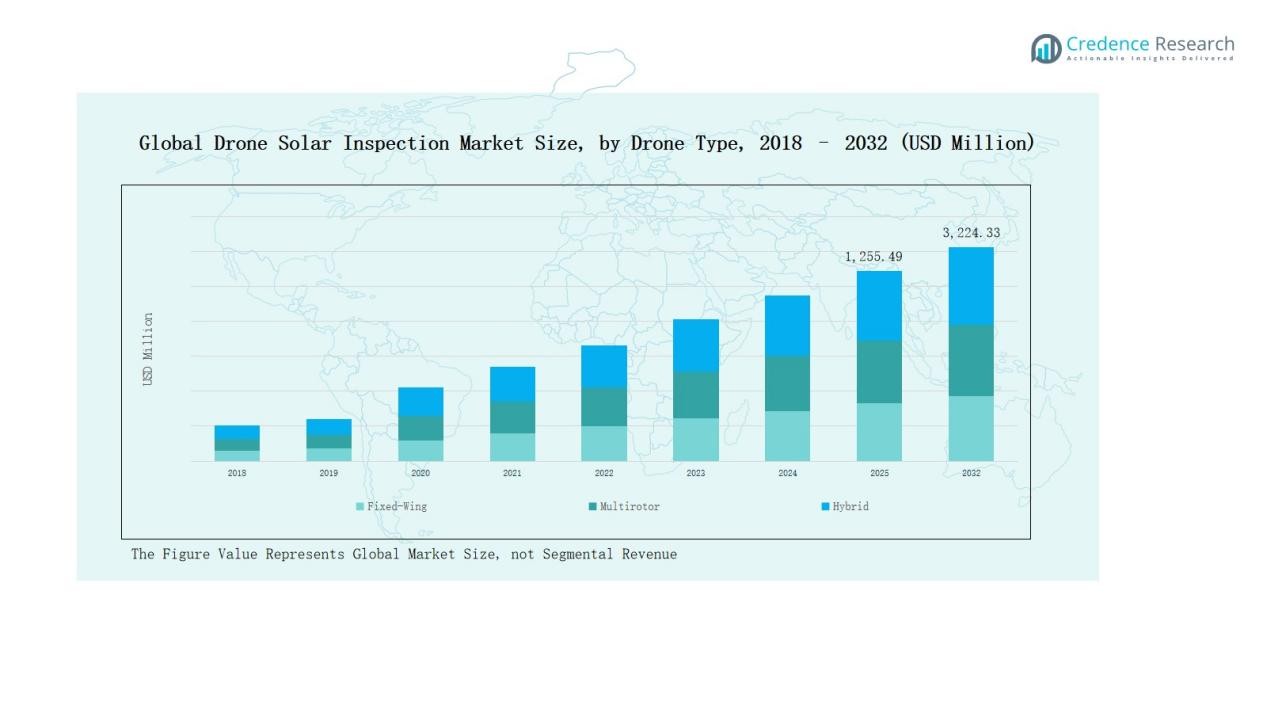
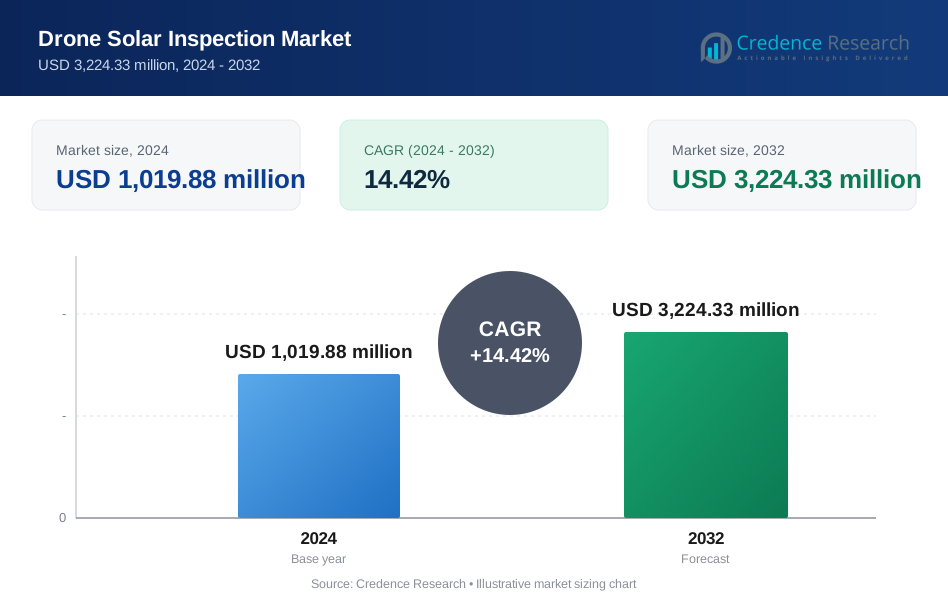
Global Drone Solar Inspection Market size was valued at USD 516.49 million in 2018 to USD 1,019.88 million in 2024 and is anticipated to reach USD 3,224.33 million by 2032, at a CAGR of 14.42% during the forecast period.
| REPORT ATTRIBUTE | DETAILS |
|---|---|
| Historical Period | 2020-2023 |
| Base Year | 2024 |
| Forecast Period | 2025-2032 |
| Drone Solar Inspection Market Size 2024 | USD 1,019.88 Million |
| Drone Solar Inspection Market, CAGR | 14.42% |
| Drone Solar Inspection Market Size 2032 | USD 3,224.33 Million |
The Global Drone Solar Inspection Market is shaped by leading players such as DJI Enterprise, Terra Drone, Aerodyne Measure, DroneDeploy, Parrot Group, ABJ Drones, DRONE VOLT Group, Airpix, Sitemark, Skylark Drones, and PrecisionXYZ. These companies strengthen their positions through advanced drone portfolios, AI-driven analytics, and strategic partnerships with solar operators. They focus on enhancing inspection accuracy, expanding service offerings, and scaling operations across key solar markets. Regionally, North America leads the market with a 38% share in 2024, driven by large-scale solar farm deployments, advanced infrastructure, and early adoption of drone-based predictive maintenance solutions.
Market Insights
- The Global Drone Solar Inspection Market grew from USD 516.49 million in 2018 to USD 1,019.88 million in 2024, expanding at 14.42% CAGR.
- Multirotor drones lead by drone type with a 65% share in 2023, while fixed-wing drones grow fastest due to demand in large-scale solar farms.
- Thermal inspection dominates applications, accounting for 80% of revenue, supported by predictive maintenance needs in PV farms, while panel soiling detection shows rising importance.
- Utility-scale solar farms hold over 56% of market revenue, driven by frequent inspection needs and advanced analytics, followed by commercial rooftops and residential installations.
- North America leads with 38% share in 2024, Asia Pacific grows fastest with 26%, while Europe follows with 16%, supported by strong renewable adoption policies.
Market Segment Insights
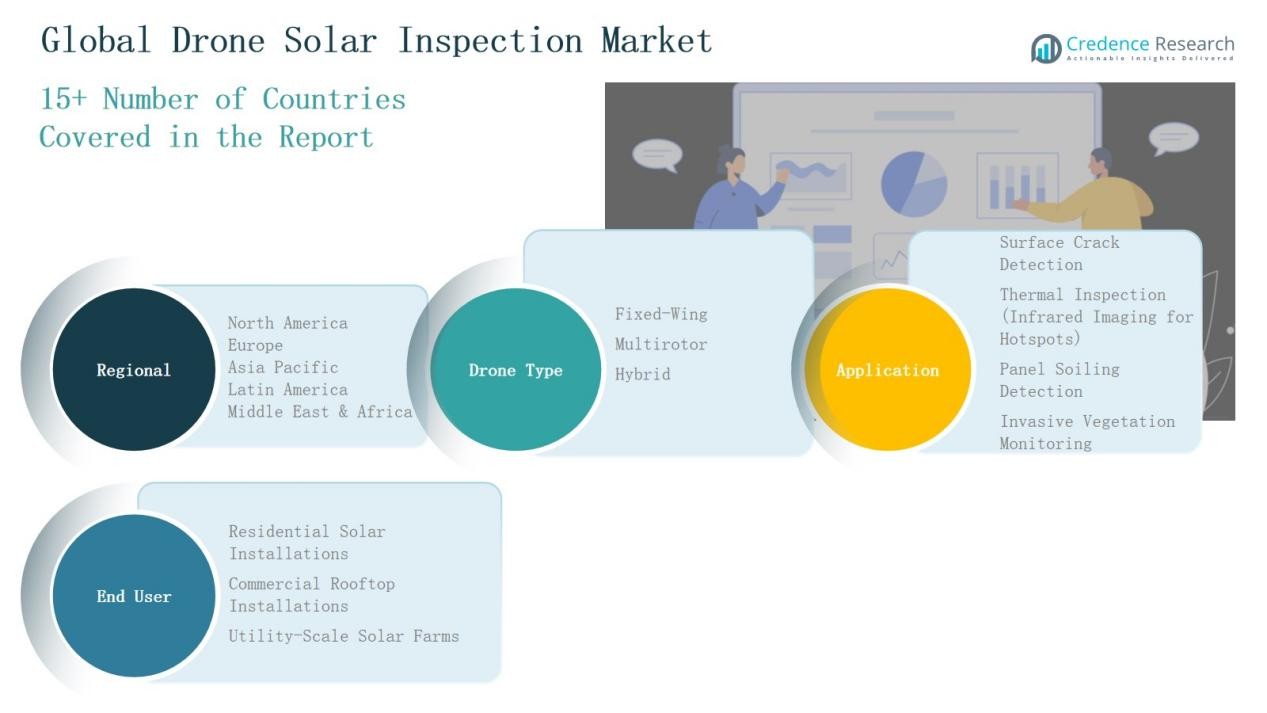
By Drone Type Multirotor drones dominate the global drone solar inspection market with 65% share as of 2023. Fixed-wing drones hold the remaining ~35% but are the fastest-growing sub-segment. Multirotor’s dominance stems from its agility, ability to hover, ease of deployment, and suitability for close-up inspections. Fixed-wing is driven by demand in large solar farms, where long flight duration and coverage per flight matter. Hybrid drones are emerging but constitute a smaller portion currently, due to higher cost and complexity.
- For instance, DJI launched the Mavic 3 Multispectral, integrating a multispectral sensor for precision agricultural and solar panel inspections, reinforcing the dominance of multirotor platforms.
By Application
Thermal inspection (infrared imaging for hotspots) serves as a core driver, especially in large-scale PV farms needing predictive maintenance. Visual methods like surface crack detection and soiling detection follow, but thermal leads due to its ability to detect faults before failure. In terms of share, 80% of drone solar inspection revenue comes from PV-related inspection applications. Panel soiling detection is increasing, driven by efficiency losses from dust and environmental debris. Invasive vegetation monitoring is a niche but growing segment in utility-scale installations. Surface crack detection remains important for warranty, quality control, and maintenance tasks.
- For instance, EVT deployed their EyeCheck Thermo thermal camera system on drones for large-scale solar farms, achieving over 70% reduction in inspection time while detecting early faults like hotspots and defective modules.
By End User Utility-scale solar farms represent the dominant end user segment, capturing the majority of market revenue, often over 56%, thanks to scale, frequent inspection needs, and large installations. Commercial rooftop installations follow, driven by regulatory requirements and efficiency mandates. Residential solar installations are smaller in revenue share but growing quickly due to declining panel costs and incentives. Utility-scale users demand long-flight drones, high throughput data processing, and predictive analytics to minimize downtime. Commercial and residential users emphasize safety, cost, ease of deployment, and smaller drones.
Key Growth Drivers
Rising Demand for Efficient Solar Asset Management
The increasing global solar capacity is creating a strong need for reliable inspection solutions. Drone-based solar inspections enable faster detection of defects compared to manual methods, reducing downtime and improving energy yield. Their ability to cover large-scale solar farms with precision and efficiency makes them a preferred choice among utility operators. Growing focus on predictive maintenance and minimizing operational costs further strengthens adoption. This efficiency factor continues to drive strong demand, particularly in regions with expanding solar infrastructure.
- For instance, Robotics company Percepto received FAA approval for its drone-in-a-box system, enabling fully autonomous solar site inspections in the United States, significantly lowering operational costs for large utility operators.
Advancements in Drone and Imaging Technologies
Rapid improvements in drone hardware, thermal imaging sensors, and AI-powered analytics are boosting inspection accuracy. High-resolution imaging and advanced data processing platforms allow operators to detect surface cracks, hotspots, and soiling with better precision. The integration of autonomous flight features reduces dependency on skilled pilots, lowering operational barriers. These technological enhancements not only optimize inspection quality but also reduce costs. As drone and imaging technology continues to evolve, solar inspection efficiency is expected to increase significantly, reinforcing market growth.
- For instance, GeoWGS84 deployed drone inspections across utility-scale solar farms, utilizing thermal imaging and AI analytics to reduce manual inspection time by 75%, enabling faster detection of panel hotspots and dirt accumulation.
Supportive Regulations and Renewable Energy Policies
Government initiatives promoting renewable energy adoption are indirectly driving demand for drone-based solar inspections. Many countries are implementing ambitious solar capacity targets, which increase the need for efficient monitoring solutions. Supportive regulations around drone usage for industrial applications are also enabling faster market adoption. Subsidies, tax benefits, and renewable energy mandates encourage large-scale solar deployment, where drones become essential for maintenance. With strong policy backing, both developed and emerging economies are witnessing accelerated adoption of drone inspection solutions in solar energy projects.
Key Trends & Opportunities
Integration of Artificial Intelligence and Predictive Analytics
AI-driven platforms are emerging as a major trend in drone solar inspections. Advanced algorithms enable predictive maintenance by analyzing inspection data to forecast potential failures. This reduces downtime and improves solar farm efficiency. AI also enhances defect classification, automates data reporting, and supports decision-making for asset managers. The integration of machine learning into drone systems creates significant opportunities for software developers, analytics providers, and inspection service companies. This trend is expected to transform solar O&M practices globally.
- For instance, Folio3 AI’s drone software uses thermal imaging to identify hotspots, diode failures, shattered panels, and dirt accumulation, enabling rapid and precise defect detection to maximize solar farm efficiency.
Expansion of Utility-Scale Solar Projects in Emerging Markets
The growing adoption of solar energy in countries such as India, China, Brazil, and South Africa presents major opportunities for drone inspection providers. Utility-scale projects in these markets are expanding rapidly, requiring efficient, scalable inspection solutions. Drones help reduce inspection time and ensure higher return on investment for large solar operators. Local governments’ focus on renewable energy expansion and improving grid reliability further boosts demand. This expansion into emerging economies is expected to be a key growth opportunity in the coming decade.
- For instance, Tata Power Solar commissioned a 150 MW solar project in Rajasthan, India, leveraging drone inspections to optimize maintenance and reduce downtime. This large-scale initiative supports India’s growing renewable energy goals.
Key Challenges
High Initial Costs of Advanced Drone Systems
While drones reduce long-term inspection costs, the initial investment in advanced hardware and software remains high. Thermal imaging drones and AI-powered analytics platforms involve significant capital expenditure. Small-scale solar operators, especially in developing countries, may find it challenging to afford such solutions. Limited budgets often restrict adoption, slowing market penetration in cost-sensitive regions. Addressing affordability through leasing models or shared service platforms is crucial to overcoming this challenge.
Regulatory Restrictions and Airspace Limitations
Strict drone regulations in several countries pose hurdles for widespread adoption. Airspace restrictions, licensing requirements, and operational limitations often delay deployment in large solar farms. Compliance with varying international and local regulatory frameworks adds complexity for service providers. These challenges restrict scalability and discourage new entrants in the market. Evolving regulations are expected to gradually ease restrictions, but navigating compliance remains a major challenge for stakeholders in the short term.
Data Management and Security Concerns
Drone solar inspections generate vast amounts of image and thermal data, requiring secure storage and processing. Managing large datasets poses challenges for both operators and clients, particularly in regions with limited digital infrastructure. Concerns around data privacy, cybersecurity, and integration with existing asset management systems also affect adoption. Without robust cloud platforms and security measures, stakeholders face risks of data breaches or loss. Building secure, scalable data management solutions is essential to addressing this challenge effectively.
Regional Analysis
North America
North America leads the global drone solar inspection market with a 38% share in 2024, valued at USD 440.39 million, up from USD 225.37 million in 2018. The market is projected to reach USD 1,396.17 million by 2032, advancing at a CAGR of 14.5%. The region’s growth is supported by advanced solar infrastructure, early adoption of drone analytics, and strong policy incentives. The U.S. dominates due to large utility-scale solar farms and established drone service providers, ensuring continuous demand for efficient inspection solutions.
Europe
Europe accounts for a 16% share in 2024, valued at USD 187.55 million, rising from USD 100.26 million in 2018. The market is forecast to reach USD 541.35 million by 2032 at a CAGR of 13.1%. Growth is driven by stringent energy efficiency regulations, strong renewable targets, and widespread solar adoption across Germany, France, and Spain. Drone inspections are gaining momentum in utility-scale projects to enhance operational efficiency and reduce maintenance costs. Favorable policies and cross-border energy initiatives continue to strengthen Europe’s role in the global market.
Asia Pacific
Asia Pacific is the fastest-growing region, holding a 26% share in 2024, valued at USD 305.21 million, compared to USD 146.23 million in 2018. By 2032, the market is expected to reach USD 1,054.03 million, expanding at a CAGR of 15.7%. Growth is fueled by massive solar expansion in China, India, and Japan, along with large-scale renewable energy targets. Drones provide efficient solutions for monitoring vast installations, optimizing performance, and reducing downtime. Strong government support, coupled with digital transformation in asset management, positions Asia Pacific as the key growth hub globally.
Latin America
Latin America represents a 4% share in 2024, worth USD 46.67 million, up from USD 23.94 million in 2018. The market is projected to grow to USD 130.26 million by 2032, at a CAGR of 12.6%. Brazil and Mexico lead adoption, driven by favorable renewable policies and rapid solar capacity expansion. Drone solutions are increasingly valued for lowering inspection costs and improving efficiency in large solar farms. Rising private investments and regional efforts to diversify energy portfolios beyond fossil fuels are expected to further accelerate adoption.
Middle East
The Middle East holds a 2% share in 2024, valued at USD 24.30 million, up from USD 13.55 million in 2018. The market is expected to reach USD 63.93 million by 2032, registering a CAGR of 11.8%. Countries such as the UAE and Saudi Arabia are spearheading growth with mega solar projects aligned with national energy diversification strategies. Drones are increasingly deployed for inspection in challenging desert environments, reducing downtime and ensuring efficiency. Government commitments to renewable energy expansion support steady adoption in the region.
Africa
Africa contributes a 1% share in 2024, valued at USD 15.76 million, compared to USD 7.14 million in 2018. The market is projected to reach USD 38.60 million by 2032, growing at a CAGR of 10.8%. Adoption remains modest but is gaining traction in South Africa, Egypt, and Kenya. Drones are helping reduce maintenance costs and improve inspection efficiency for both utility-scale and off-grid solar projects. Expanding electrification initiatives, rural solar programs, and international funding are expected to gradually accelerate drone-based solar inspections in the region.
Market Segmentations:
By Drone Type
- Fixed-Wing
- Multirotor
- Hybrid
By Application
- Surface Crack Detection
- Thermal Inspection (Infrared Imaging for Hotspots)
- Panel Soiling Detection
- Invasive Vegetation Monitoring
By End User
- Residential Solar Installations
- Commercial Rooftop Installations
- Utility-Scale Solar Farms
By Region
North America
- U.S.
- Canada
- Mexico
Europe
- UK
- France
- Germany
- Italy
- Spain
- Russia
- Rest of Europe
Asia Pacific
- China
- Japan
- South Korea
- India
- Australia
- Southeast Asia
- Rest of Asia Pacific
Latin America
- Brazil
- Argentina
- Rest of Latin America
Middle East
- GCC Countries
- Israel
- Turkey
- Rest of Middle East
Africa
- South Africa
- Egypt
- Rest of Africa
Competitive Landscape
The global drone solar inspection market is characterized by a moderately consolidated structure, with several leading players leveraging advanced technologies to strengthen market presence. Key companies such as DJI Enterprise, Terra Drone, Aerodyne Measure, DroneDeploy, and Parrot Group dominate through diverse drone portfolios, thermal imaging solutions, and AI-driven analytics platforms. These players emphasize innovation in data processing, predictive maintenance, and autonomous flight systems to enhance inspection efficiency. Regional providers, including ABJ Drones, Skylark Drones, and Airpix, cater to localized demand, offering cost-effective services tailored to utility and commercial solar projects. Strategic partnerships with solar farm operators and renewable energy developers are common, enabling firms to expand service reach and build long-term client networks. Additionally, companies are focusing on acquisitions and R&D investments to diversify offerings and remain competitive. The landscape continues to evolve as new entrants introduce niche inspection services, while established players consolidate through technological advancements and global expansion strategies.
Key Players
- DJI Enterprise
- Terra Drone
- Aerodyne Measure
- DroneDeploy
- Parrot Group
- ABJ Drones
- DRONE VOLT Group
- Airpix
- Sitemark
- Skylark Drones
- PrecisionXYZ
Recent Developments
- In December 2024, Raptor Maps, a solar drone inspection software company, secured $35 million in Series C funding led by Maverix Private Equity. This funding will support enhancements in solar automation, work management, machine-learning insights, and product development aimed at improving solar asset management globally.
- In January 2025, Hylio launched a new drone designed to automate solar panel maintenance, including cleaning panels and treating weeds, marking a product launch in the drone solar inspection and maintenance market.
- In July 2025, Nextracker launched a new AI & Robotics business after acquiring key technologies to strengthen drone-based solar inspection and automation.
- In July 2025, Horizonview Technologies unveiled its new Aerial Inspection Platform (Software 2.0) designed to improve efficiency in solar project inspections.
Report Coverage
The research report offers an in-depth analysis based on Drone Type, Application, End User and Region. It details leading market players, providing an overview of their business, product offerings, investments, revenue streams, and key applications. Additionally, the report includes insights into the competitive environment, SWOT analysis, current market trends, as well as the primary drivers and constraints. Furthermore, it discusses various factors that have driven market expansion in recent years. The report also explores market dynamics, regulatory scenarios, and technological advancements that are shaping the industry. It assesses the impact of external factors and global economic changes on market growth. Lastly, it provides strategic recommendations for new entrants and established companies to navigate the complexities of the market.
Future Outlook
- Adoption of drones will increase as solar projects continue expanding worldwide.
- Multirotor drones will remain the preferred choice for detailed and flexible inspections.
- Fixed-wing and hybrid drones will gain traction in large-scale solar farms requiring long coverage
- AI-driven analytics will transform inspection data into predictive maintenance insights.
- Thermal imaging will remain central for hotspot detection and efficiency monitoring.
- Panel soiling detection will see higher demand as operators focus on performance optimization.
- Utility-scale farms will drive most inspection demand due to operational complexity.
- Service providers will expand offerings through partnerships with solar developers and operators.
- Regional adoption will grow rapidly in Asia Pacific and emerging solar markets.
- Data management and integration with asset monitoring platforms will become a key differentiator.
Request a Free Sample
Fill in your details and we'll send you a free sample report.
- Sample data tables & charts
- Research methodology
Need a Custom Version of This Report?
Tailor the scope, geography, or segments to your exact requirements.
- Custom geography or segment scope
- Direct access to our analyst team
Frequently Asked Questions
What is the current market size for Global Drone Solar Inspection Market, and what is its projected size in 2032?
At what Compound Annual Growth Rate is the Global Drone Solar Inspection Market projected to grow between 2025 and 2032?
Which Global Drone Solar Inspection Market segment held the largest share in 2024?
What are the primary factors fueling the growth of the Global Drone Solar Inspection Market?
Who are the leading companies in the Global Drone Solar Inspection Market?
Which region commanded the largest share of the Global Drone Solar Inspection Market in 2024?
Table of Content
Chapter 1. Report Introduction
- 1.1 Report Description & Purpose
- 1.1.1 Report Title & Market Definition
- 1.1.2 Unique Selling Propositions (USP) & Key Differentiators
- 1.1.3 Value Proposition for Stakeholders
- 1.2 Research Objectives
- 1.2.1 Market Sizing Objectives (Volume & Revenue)
- 1.2.2 Segmentation Objectives
- 1.2.3 Competitive Intelligence Objectives
- 1.2.4 Forecast & Scenario Objectives
- 1.3 Report Scope
- 1.3.1 Drone Solar Inspection Scope – Types & Subtypes Covered
- 1.3.2 Geographic Scope – Regions & Countries Covered
- 1.3.3 Historical Period, Base Year & Forecast Period (2024; forecast to 2032)
- 1.3.4 Inclusions & Exclusions
- 1.4 HS Code & Classification Framework
- 1.5 Currency, Units & Pricing Basis
- 1.6 Target Stakeholders
- 1.7 Limitations & Assumptions
Chapter 2. Executive Summary
- 2.1 Global Drone Solar Inspection Market Snapshot
- 2.1.1 Market Size – Historical (2024) & Forecast (2024-2032) (2024: USD 1,019.88 million → 2032: USD 3,224.33 million)
- 2.1.2 Volume & Revenue – Global Totals
- 2.1.3 Key Market Highlights – Top Five Facts
- 2.2 Drone Solar Inspection Market Segmentation Snapshot
- 2.2.1 Market Split by Region – 2024 vs. 2032
- 2.3 Competitive Snapshot
- 2.3.1 Top 10 Players by Revenue Share – 2024
- 2.3.2 Top 10 Players by Volume Share – 2024
- 2.3.3 Recent Strategic Developments (18-Month Summary)
- 2.4 Key Investment Highlights & Strategic Conclusions
Chapter 3. Drone Solar Inspection Market Dynamics & Industry Analysis
- 3.1 Market Overview & Context
- 3.1.1 Drone Solar Inspection Market Position in the Broader Automotive Value Chain
- 3.1.2 OEM vs. Replacement Market Dynamics
- 3.1.3 Market Maturity & Development Stage by Region
- 3.2 Drone Solar Inspection Market Drivers
- 3.3 Drone Solar Inspection Market Restraints & Challenges
- 3.4 Drone Solar Inspection Market Opportunities
- 3.5 Porter's Five Forces Analysis
- 3.5.1 Threat of New Entrants
- 3.5.2 Bargaining Power of Suppliers
- 3.5.3 Bargaining Power of Buyers
- 3.5.4 Threat of Substitutes
- 3.5.5 Competitive Rivalry – Intensity Assessment
- 3.6 Drone Solar Inspection Value Chain Analysis
- 3.6.1 Upstream – Raw Material/Input Suppliers
- 3.6.1.1 Raw Material/Input 1
- 3.6.1.2 Raw Material/Input 2
- 3.6.1.3 Raw Material/Input 3
- 3.6.2 Midstream – Production/Manufacturing/Service Delivery
- 3.6.2.1 Production/Process Overview
- 3.6.2.2 Key Facility Locations & Capacity by Manufacturer
- 3.6.3 Downstream – Distribution & End Consumer
- 3.6.3.1 Primary Channel – B2B/OEM
- 3.6.3.2 Secondary Channels – Dealer, Retail, Online, Direct
- 3.6.4 Value Chain Profitability Analysis
- 3.6.1 Upstream – Raw Material/Input Suppliers
- 3.7 PESTEL Analysis
- 3.7.1 Political Factors
- 3.7.2 Economic Factors
- 3.7.3 Social Factors
- 3.7.4 Technological Factors
- 3.7.5 Environmental Factors
- 3.7.6 Legal Factors
- 3.8 Drone Solar Inspection Supply Chain Analysis
- 3.8.1 Raw Material/Input Supply Risk Assessment
- 3.8.2 Manufacturing Concentration Risk (Geographic Exposure)
- 3.8.3 Trade Disruption Impact Analysis
- 3.9 Regulatory & Policy Landscape
Note: The regulatory and policy landscape section covers regulations based on their applicability to the market, Drone Solar Inspection category, geography, and scope of the study. Only regulatory frameworks with a material impact on operations, compliance, trade, sustainability, or market access are analyzed in detail.
Chapter 4. Key Investment Pockets & Opportunity Analysis
- 4.1 Drone Solar Inspection Market Attractiveness Analysis
- 4.1.1 By Region – Investment Attractiveness Matrix (Volume × CAGR)
- 4.2 Absolute Revenue Growth Opportunity
- 4.2.1 By Region – Absolute USD Growth Through 2032
- 4.3 Incremental Volume Opportunity
- 4.3.1 By Region – Incremental Volume Through 2032
- 4.3.2 Segment – Incremental Volume
- 4.4 Emerging Submarket Opportunity Deep Dive (Subject to Applicability)
- 4.5 Emerging Market Opportunity Scorecards
- 4.5.1 United States
- 4.5.2 Europe
- 4.5.3 Asia
- 4.5.4 Middle East & Africa
Note: Emerging Market Opportunity Scorecards will be included based on relevance and strategic importance. Regions listed are indicative and may vary depending on data availability and market dynamics.
Chapter 5. Drone Solar Inspection Import-Export Analysis & Trade Flows
- 5.1 Global Trade Overview
- 5.1.1 Global Export Value by Country (2024)
- 5.1.2 Global Export Volume by Country (2024)
- 5.1.3 Global Import Value by Country (2024)
- 5.1.4 Global Import Volume by Country (2024)
- 5.1.5 Net Trade Balance by Country (2024)
- 5.2 Export Analysis – Segment
- 5.2.1 Type 1 (HS Code)
- 5.2.2 Type 2 (HS Code)
- 5.2.3 Type 3 (HS Code)
- 5.2.4 Type 4 (HS Code)
- 5.2.5 Type 5 (HS Code)
- 5.3 Import Analysis – Segment
- 5.3.1 Type 1 (HS Code)
- 5.3.2 Type 2 (HS Code)
- 5.3.3 Type 3 (HS Code)
- 5.3.4 Type 4 (HS Code)
- 5.3.5 Type 5 (HS Code)
- 5.4 Average Unit Trade Prices
- 5.4.1 Average Export Price – Segment & Country
- 5.4.2 Average Import Price – Segment & Source Country
- 5.4.3 Price Trends (2024)
- 5.5 Key Trade Route Analysis
- 5.5.1 Trade Route 1
- 5.5.2 Trade Route 2
- 5.5.3 Trade Route 3
- 5.5.4 Trade Route 4
- 5.5.5 Trade Route 5
- 5.6 Trade Policy Impact Assessment
- 5.6.1 US Anti-Dumping & Section 301 Tariffs
- 5.6.2 EU Customs Union Impact
- 5.6.3 Major Free Trade Agreements
- 5.6.4 USMCA Rules of Origin
Note: Trade policy analysis will be included only where relevant to the Drone Solar Inspection market.
Chapter 6. Competitive Landscape & Company Benchmarking
- 6.1 Drone Solar Inspection Market Concentration & Structure
- 6.1.1 Herfindahl-Hirschman Index (HHI) – vs. 2024
- 6.1.2 Tier 1, Tier 2 & Tier 3 Market Structure
- 6.1.3 Global, Regional & Local Player Dynamics
- 6.2 Drone Solar Inspection Market Share Analysis – 2024
- 6.2.1 Global Revenue Share by Company
- 6.2.2 Global Volume Share by Company
- 6.2.3 Regional Revenue Share
- 6.2.4 Market Share Evolution ( vs. 2024)
- 6.2.5 OEM Segment Share by Company
- 6.2.6 Replacement Segment Share by Company
- 6.3 Production/Delivery Capacity & Facility Analysis
- 6.3.1 Global Installed Capacity
- 6.3.2 Capacity Utilization Rates
- 6.3.3 Production/Output Volume
- 6.3.4 Facility Locations & Capacity Map
- 6.3.5 Planned Capacity Additions
- 6.4 Drone Solar Inspection Competitive Benchmarking Matrix
- 6.4.1 Revenue, Volume, CAGR & Profitability Comparison
- 6.4.2 Channel Revenue Mix
- 6.4.3 Geographic Revenue Exposure
- 6.4.4 R&D Intensity
- 6.4.5 Sustainability Maturity
- 6.5 Strategic Developments in Drone Solar Inspection (Last 24 Months)
- 6.5.1 Mergers, Acquisitions & Divestments
- 6.5.2 New Drone Solar Inspection Launches
- 6.5.3 Facility Expansions
- 6.5.4 Strategic Alliances, Joint Ventures & Partnerships
- 6.5.5 Distribution Expansion & Market Entry
- 6.5.6 Sustainability & ESG Initiatives
- 6.6 Competitive Strategy Mapping
- 6.6.1 Leader, Challenger, Follower & Niche Classification
- 6.6.2 Pricing Strategy Comparison
- 6.6.3 Channel Strategy Matrix
Note: Strategic developments are included based on their materiality and the availability of reliable information.
Chapter 7. Global Drone Solar Inspection Market – By Distribution Channel
- 7.1 Segment Overview
- 7.1.1 Volume & Revenue Split by Channel (2024 & 2032)
- 7.1.2 Channel Mix Evolution (2024-2032)
Chapter 8. Regional Market Analysis – Global Overview
- 8.1 Global Regional Overview
- 8.1.1 Regional Volume Share
- 8.1.2 Regional Revenue Share
- 8.1.3 Regional Volume by Region
- 8.1.4 Regional Revenue by Region
- 8.1.5 Regional Forecast Through 2032
- 8.2 Cross-Regional Segment Analysis
- 8.2.1 By Distribution Channel
- 8.2.2 By Brand/Price Tier
Chapter 9. North America Drone Solar Inspection Market
- 9.1 United States
- 9.2 Canada
- 9.3 Mexico
Chapter 10. Europe Drone Solar Inspection Market
- 10.1 Germany
- 10.2 France
- 10.3 Italy
- 10.4 United Kingdom
- 10.5 Spain
- 10.6 Poland
- 10.7 Russia
- 10.8 Netherlands
- 10.9 Belgium
- 10.10 Sweden
- 10.11 Denmark
- 10.12 Norway
- 10.13 Rest of Europe
Chapter 11. Asia Pacific Drone Solar Inspection Market
- 11.1 China
- 11.2 India
- 11.3 Japan
- 11.4 South Korea
- 11.5 Thailand
- 11.6 Indonesia
- 11.7 Vietnam
- 11.8 Malaysia
- 11.9 Australia
- 11.10 Rest of Asia Pacific
Chapter 12. Latin America Drone Solar Inspection Market
- 12.1 Brazil
- 12.2 Argentina
- 12.3 Colombia
- 12.4 Chile
- 12.5 Rest of Latin America
Chapter 13. Middle East Drone Solar Inspection Market
- 13.1 Saudi Arabia
- 13.2 United Arab Emirates
- 13.3 Turkey
- 13.4 Israel
- 13.5 Iran
- 13.6 Rest of the Middle East
Chapter 14. Africa Drone Solar Inspection Market
- 14.1 South Africa
- 14.2 Egypt
- 14.3 Nigeria
- 14.4 Morocco
- 14.5 Rest of Africa
Chapter 15. Drone Solar Inspection Company Profiles
- 15.1 [Company 01]
- 15.1.1 Company Overview
- 15.1.2 Key Management Personnel
- 15.1.3 Products & Services Portfolio
- 15.1.4 Financial Performance
- 15.1.5 Key Market Focus & Geographic Presence
- 15.1.6 Recent Developments & Strategic Initiatives
Note: The company profile list is preliminary and may change based on research findings, market developments, data availability, and client requirements.
Chapter 16. Appendices
- Appendix A – List of Abbreviations & Acronyms
- Appendix B – Industry Classification Code Reference – Full Series
- Appendix C – Production & Capacity Data Tables
- Appendix D – End-Use & Demand Base Tables
- Appendix E – Consumption & Replacement Rate Assumptions
- Appendix F – ASP Reference Tables
- Appendix G – Manufacturing & Facility Database
- Appendix H – Import-Export Data Tables
- Appendix I – Regulatory Summary Tables
- Appendix J – Primary Research Participant List (Anonymized)
- Appendix K – Primary Research Questionnaire Framework
- Appendix L – Data Sources & Bibliography
- Appendix M – Market Size Divergence & Source Comparison
Chapter 17. Research Methodology
- 17.1 Research Framework & Philosophy
- 17.2 Secondary Research – Sources, Hierarchy & Data Extraction
- 17.3 Data Modeling – Bottom-Up & Top-Down Market Sizing
- 17.4 Primary Research – Stakeholder Framework, LOI & Sample Sizes
- 17.5 Forecast Methodology – Regression, Scenario & Sensitivity Analysis
- 17.6 Quality Control – Four-Layer Validation Framework
- 17.7 Limitations & Standard Assumptions
- 17.8 Disclaimer
