| REPORT ATTRIBUTE |
DETAILS |
| Historical Period |
2020-2023 |
| Base Year |
2024 |
| Forecast Period |
2025-2032 |
| Augmented And Virtual Reality Contact Lens Market Size 2023 |
USD 1,087.30 Million |
| Augmented And Virtual Reality Contact Lens Market, CAGR |
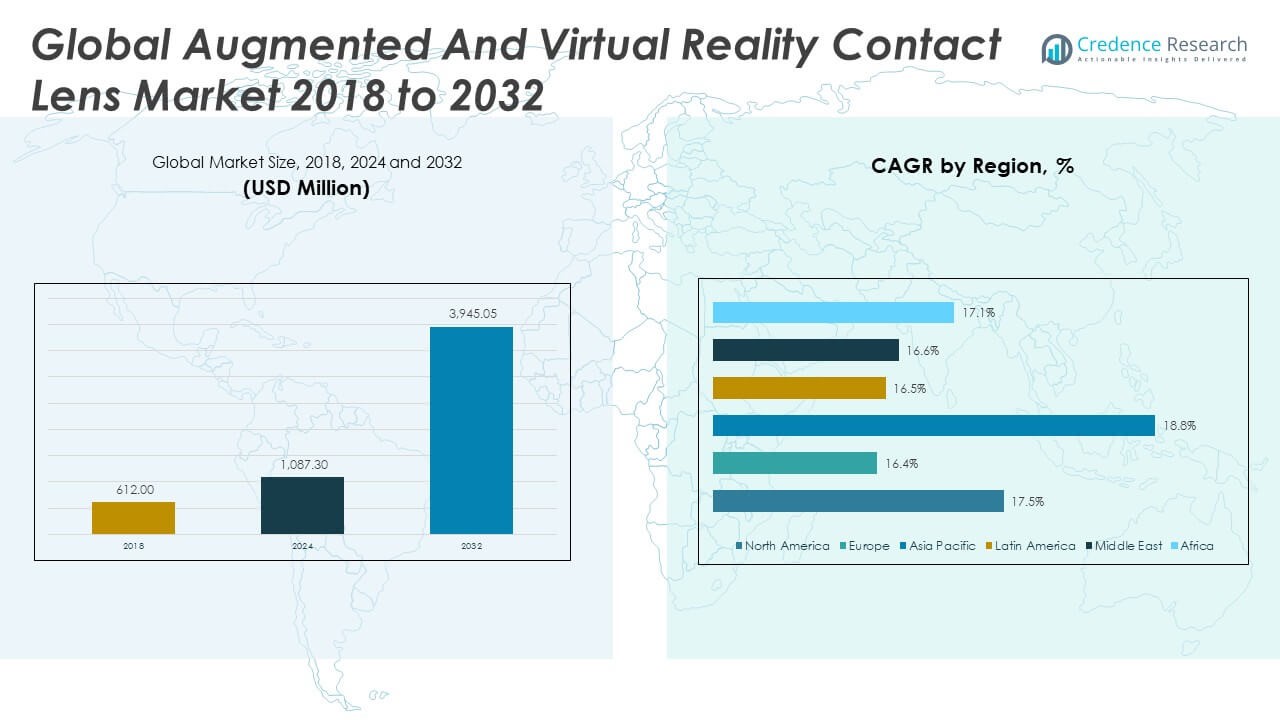
17.54% |
| Augmented And Virtual Reality Contact Lens Market Size 2032 |
USD 3,945.05 Million |
Market Overview:
The Global Augmented And Virtual Reality Contact Lens Market size was valued at USD 612.00 million in 2018 to USD 1,087.30 million in 2024 and is anticipated to reach USD 3,945.05 million by 2032, at a CAGR of 17.54% during the forecast period.
The key driver behind the growth of the Global AR/VR Contact Lens Market is the increasing investment in cutting-edge wearable technologies by major technology companies and start-ups. Companies like Mojo Vision, Innovega, and Samsung are at the forefront of integrating microdisplays, sensors, and wireless connectivity into compact, vision-enhancing lenses. These lenses aim to deliver a fully immersive AR/VR experience without the need for bulky headsets or handheld devices, enabling hands-free access to contextual information, real-time navigation, and immersive media. In addition to consumer applications like gaming, sports, and smart navigation, the market is gaining traction in healthcare, where smart lenses could enable real-time biometric monitoring, including glucose levels, intraocular pressure, and medication adherence. This intersection of health and augmented reality is particularly compelling as it supports the broader trend of personalized, proactive healthcare.
Regionally, North America leads the Global AR/VR Contact Lens Market. This dominance is driven by the presence of key innovators, strong venture capital support, and a favorable regulatory environment for testing and pilot deployments. The United States, in particular, is home to several pioneering companies developing AR/VR lens technology and has been active in securing intellectual property rights and conducting clinical trials. Europe follows with steady growth, particularly in countries like Germany, the United Kingdom, and France, where applications in defense, healthcare, and industrial design are encouraging adoption. However, stricter healthcare and consumer regulations in the EU may slow commercialization compared to the U.S. In the Asia-Pacific region, rapid advancements in electronics manufacturing, government-backed digital initiatives, and strong consumer demand are positioning countries such as Japan, South Korea, China, and India as high-growth markets for AR/VR contact lenses. These countries benefit from established supply chains, increasing R&D investments, and rising interest in wearable healthcare technologies. Meanwhile, regions such as Latin America and the Middle East & Africa remain in the early stages of adoption, constrained by infrastructure limitations and lower consumer readiness, though future growth potential exists as digital health awareness expands.
Access crucial information at unmatched prices!
Request your sample report today & start making informed decisions powered by Credence Research Inc.!
Download Sample
Market Insights:
- The Global Augmented And Virtual Reality Contact Lens Market grew from USD 612.00 million in 2018 to USD 1,087.30 million in 2024 and is expected to reach USD 3,945.05 million by 2032, registering a CAGR of 17.54% during the forecast period.
- Companies such as Mojo Vision, Samsung, and Innovega are accelerating market development through investments in integrated microdisplays, wireless modules, and smart sensors for AR/VR lens applications.
- Smart lenses are gaining traction in healthcare by enabling real-time biometric tracking, including glucose and intraocular pressure monitoring, enhancing chronic disease management and telemedicine services.
- Innovations in micro-LEDs, transparent batteries, edge computing, and wireless communication are making compact and functional AR/VR lenses technically feasible.
- Consumers are increasingly shifting from bulky headsets to discreet, hands-free wearable interfaces, driving demand for contact lens-based AR/VR solutions in daily and professional use.
- High production costs, design complexity, and low manufacturing yields are limiting scalability and delaying widespread availability beyond niche and pilot-stage deployments.
- North America leads the market with strong innovation and early adoption, while Asia-Pacific is emerging as a high-growth region supported by electronics manufacturing, digital health investments, and rising demand.
Market Drivers:
Technological Evolution in Microelectronics, Photonics, and Wireless Communication Systems:
The development of AR/VR contact lenses has become feasible due to rapid advances in microelectronics, photonics, and wireless data transmission. These innovations allow manufacturers to embed miniature displays, sensors, and processors within the thin form factor of a contact lens. It makes it possible to deliver a full augmented or virtual reality experience directly to the user’s eye without bulky external devices. Technologies such as micro-LEDs, transparent batteries, and low-latency wireless protocols are pushing the boundaries of what is achievable in this compact platform. The Global Augmented And Virtual Reality Contact Lens Market is benefiting directly from ongoing breakthroughs in these foundational components.
- For instance, Mojo Vision has developed micro-LED display technology for AR contact lenses that achieves an industry-leading pixel density of up to 28,000 pixels per inch (ppi). The displays are manufactured using proprietary blue micro-LEDs and high-efficiency quantum dot solutions, bonded onto 300mm GaN-on-silicon substrates.
Consumer Preference for Lightweight, Hands-Free Wearable Interfaces:
The market is witnessing a fundamental shift from conventional head-mounted AR/VR devices toward more ergonomic and seamless alternatives. Contact lenses provide an intuitive, hands-free interface that aligns with the evolving consumer expectation for minimalistic and practical wearables. These lenses offer aesthetic advantages by eliminating the need for goggles or glasses, appealing to users in public and professional settings. The Global Augmented And Virtual Reality Contact Lens Market is gaining momentum as consumers increasingly demand devices that blend into daily life without drawing attention or causing discomfort.
- For instance, AI-based eye gesture recognition models that reach up to 99.63% accuracy across a dataset of 20,000 gesture samples from 100 diverse participants. The results were robust across different lighting scenarios and for users wearing both reflective and non-reflective glasses, with only a marginal decrease in accuracy under challenging conditions.
Healthcare Applications Driving Medical Innovation and Adoption:
Medical applications are among the most promising drivers of the AR/VR contact lens market. Smart lenses are being developed to monitor physiological metrics such as intraocular pressure, glucose levels, and dehydration, offering a non-invasive solution for continuous health monitoring. Hospitals, clinics, and research institutions are exploring these technologies for chronic disease management, post-operative care, and diagnostics. It is becoming an attractive tool for telemedicine, remote diagnostics, and preventive healthcare. The Global Augmented And Virtual Reality Contact Lens Market is expected to see strong growth from demand across public and private healthcare systems globally.
Investment Surge from Tech Giants and Startups Alike:
The competitive landscape is being shaped by significant investments from global tech giants, venture capitalists, and innovation-driven startups. Companies such as Mojo Vision and In With Corporation have secured large funding rounds and strategic partnerships to bring their prototypes closer to commercial readiness. This influx of capital is enabling faster innovation cycles, rigorous product testing, and regulatory compliance. It is helping companies refine their value propositions and gain traction in early-adopter markets. The Global Augmented And Virtual Reality Contact Lens Market is evolving rapidly as funding supports advanced R&D, pilot projects, and ecosystem collaborations.
Market Trends:
AI Integration and Contextual Awareness in Smart Lenses:
Artificial intelligence is increasingly being integrated into AR/VR contact lenses to enable real-time interpretation of visual surroundings. These AI-enhanced lenses offer capabilities such as real-time translation, gesture recognition, and spatial mapping. The trend supports more personalized and contextually aware augmented overlays. It is enabling the creation of intelligent visual assistants that can anticipate user needs and deliver data in real time. The Global Augmented And Virtual Reality Contact Lens Market is experiencing rapid adoption of AI to elevate the utility and responsiveness of wearable displays.
- For instance, Smart contact lens prototypes utilizing wireless recharging with printed solid-state supercapacitors and hybrid nanowire antennas have demonstrated continuous operation and stable performance over 300 charging/discharge cycles.
Emergence of Energy Harvesting and Wireless Charging Technologies:
A major challenge for AR/VR lenses is maintaining power without bulky external equipment. Companies are developing innovative solutions such as energy harvesting from blinking or wireless charging via near-field technology. These systems aim to extend battery life and minimize user intervention. The market is seeing prototypes that incorporate micro-energy storage devices and wireless power reception antennas. It is reducing user dependency on recharging routines, enhancing convenience, and opening doors for all-day wearable use. The Global Augmented And Virtual Reality Contact Lens Market is being reshaped by energy autonomy innovations.
- For instance, smart contact lens prototypes have demonstrated wireless recharging capabilities using printed solid-state supercapacitors and hybrid nanowire antennas that sustained both wireless charging and electronic operation over 300 cycles, maintaining electrical stability and wearer comfort during a 7-day biocompatibility trial in human and animal models.
Expansion into Enterprise and Industrial Use Cases:
AR/VR contact lenses are being tested for use in manufacturing, logistics, aviation, and field services. These applications demand real-time hands-free access to instructions, schematics, and diagnostics, especially in safety-critical environments. Workers benefit from heads-up displays without distraction or encumbrance. It supports efficiency and minimizes downtime. The Global Augmented And Virtual Reality Contact Lens Market is diversifying as enterprises adopt wearable displays for operational excellence and workforce enablement.
Innovations in Biocompatible Materials and Lens Design:
To ensure safety and comfort, manufacturers are innovating in lens material science. Hydrophilic polymers, oxygen-permeable coatings, and biocompatible electronics are being combined to make lenses suitable for long-term wear. Lens architecture is being re-engineered to balance functionality, durability, and comfort. It is facilitating wider user acceptance and regulatory approvals. The Global Augmented And Virtual Reality Contact Lens Market is progressing through material innovation that addresses safety, hygiene, and usability challenges.
Market Challenges Analysis:
High Manufacturing Costs and Technological Complexity Limit Scalability:
The Global Augmented And Virtual Reality Contact Lens Market faces significant challenges due to high production costs and complex engineering requirements. Developing microdisplays, sensors, and wireless modules that fit within a contact lens demands advanced fabrication techniques, which are not yet scalable for mass production. Yield rates remain low, and even minor defects can compromise performance or safety, making the manufacturing process both costly and inefficient. Integrating power sources, data processing, and communication systems into a transparent and biocompatible lens further complicates design. Companies must invest heavily in R&D to overcome these constraints, yet few have reached beyond the prototype stage. It currently limits the market to pilot programs and niche applications rather than broad consumer adoption.
Regulatory and Safety Concerns Delay Commercialization:
The Global Augmented And Virtual Reality Contact Lens Market also encounters delays due to regulatory scrutiny and concerns around user safety. Smart lenses fall under medical device and consumer electronics categories, subjecting them to multiple layers of approval. Regulatory bodies require evidence of long-term biocompatibility, optical safety, and wireless emissions compliance, which slows down product certification. It must meet both health-related and data security standards, especially in applications that monitor or transmit biometric data. Any failure in clinical validation or cybersecurity could halt market progress. Without clear regulatory pathways, developers must navigate uncertain timelines, which hinders investment and prolongs time-to-market.
Market Opportunities:
Expanding Applications Across Medical, Industrial, and Consumer Sectors Create New Avenues:
The Global Augmented And Virtual Reality Contact Lens Market is positioned to benefit from rising interest across diverse sectors. Medical professionals are exploring smart lenses for continuous monitoring of intraocular pressure, glucose levels, and hydration, which supports chronic disease management and remote care. Enterprises see potential in industrial training, real-time heads-up displays, and safety alerts delivered through discreet wearables. Consumer electronics companies are preparing for next-generation AR experiences that blend into daily life without visible hardware. It offers unique advantages for seamless user interaction in public and workplace settings. Broader use cases across education, military simulation, and retail visualization continue to emerge.
Integration with AI, IoT, and 5G Will Accelerate Product Capabilities:
The Global Augmented And Virtual Reality Contact Lens Market stands to gain from convergence with AI, IoT ecosystems, and high-speed 5G networks. These technologies enable smart lenses to analyze contextual data in real time, interact with other connected devices, and deliver dynamic content. It opens doors for personalized healthcare insights, real-time environmental overlays, and responsive user interfaces. Advancements in edge computing reduce latency, making user experiences more fluid and immersive. Strategic partnerships between lens manufacturers and telecom, AI, or medical device firms can unlock value and accelerate commercialization. It creates a strong foundation for long-term market expansion.
Market Segmentation Analysis:
By Type
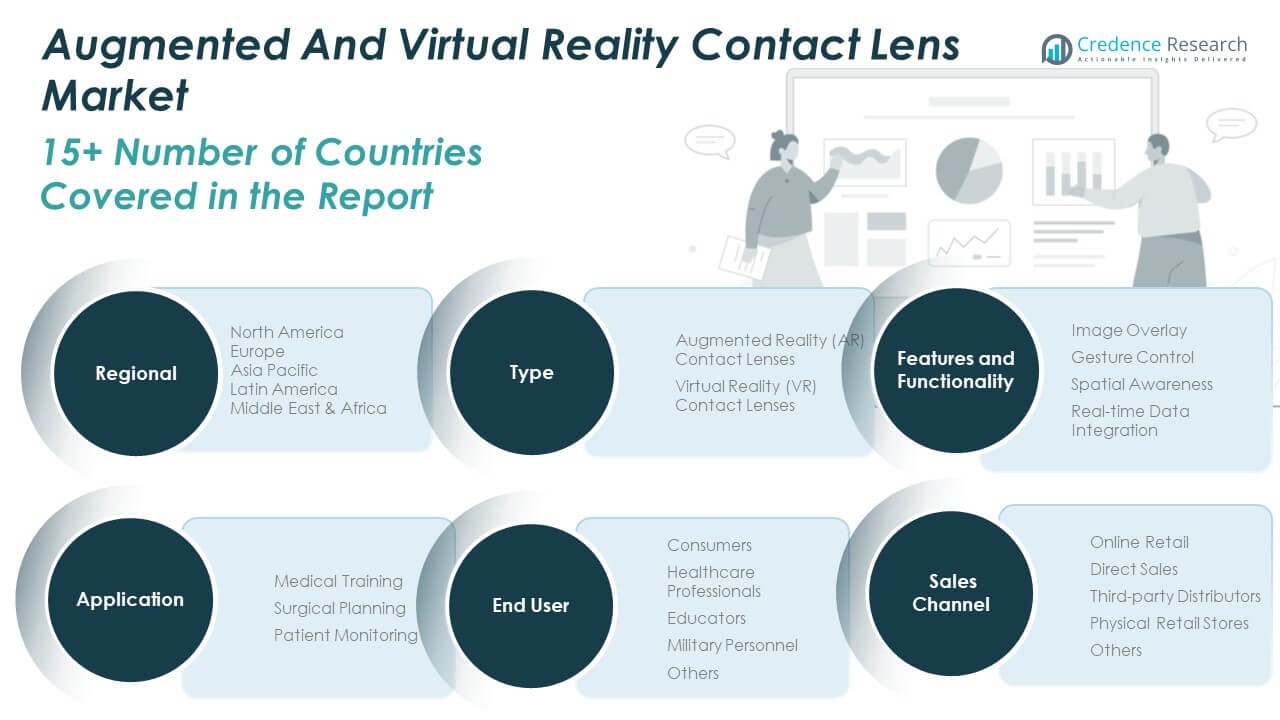
The Global Augmented And Virtual Reality Contact Lens Market includes Augmented Reality (AR) and Virtual Reality (VR) contact lenses. AR contact lenses hold the larger share due to their practical applications in real-world settings like healthcare, navigation, and consumer use. VR lenses are still in the developmental stage, but they show promise for immersive experiences in specialized environments.
By Application
Medical training leads this segment, supported by the growing demand for enhanced visualization and procedural accuracy. Surgical planning follows closely, where AR lenses aid in pre-operative assessments. Patient monitoring is emerging, using smart lenses to track real-time biometric data non-invasively.
By End User
Consumers form the largest user base, driven by interest in lightweight and hands-free wearable technology. Healthcare professionals use these lenses for diagnostics and intraoperative assistance. Educators and military personnel adopt them for training simulations and situational awareness. Others include researchers and niche users in enterprise environments.
By Features and Functionality
Image overlay and real-time data integration are widely adopted, enabling seamless access to contextual information. Gesture control and spatial awareness are advancing with improved sensor technologies, enhancing user interaction and spatial accuracy.
By Sales Channel
Online retail leads in accessibility and reach, especially for tech-savvy consumers. Direct sales and third-party distributors cater to institutional and enterprise clients. Physical retail stores and other channels play a smaller role in early product exposure and hands-on trials.
Segmentation:
By Type
- Augmented Reality (AR) Contact Lenses
- Virtual Reality (VR) Contact Lenses
By Application
- Medical Training
- Surgical Planning
- Patient Monitoring
By End User
- Consumers
- Healthcare Professionals
- Educators
- Military Personnel
- Others
By Features and Functionality
- Image Overlay
- Gesture Control
- Spatial Awareness
- Real-time Data Integration
By Sales Channel
- Online Retail
- Direct Sales
- Third-party Distributors
- Physical Retail Stores
- Others
By Region
- North America (U.S., Canada, Mexico)
- Europe (UK, France, Germany, Italy, Spain, Russia, Rest of Europe)
- Asia Pacific (China, Japan, South Korea, India, Australia, Southeast Asia, Rest of Asia Pacific)
- Latin America (Brazil, Argentina, Rest of Latin America)
- Middle East (GCC Countries, Israel, Turkey, Rest of Middle East)
- Africa (South Africa, Egypt, Rest of Africa)
Regional Analysis:
North America
The North America Augmented And Virtual Reality Contact Lens Market size was valued at USD 243.45 million in 2018 to USD 427.74 million in 2024 and is anticipated to reach USD 1,547.21 million by 2032, at a CAGR of 17.5% during the forecast period. North America currently holds the largest share of the market due to the presence of leading tech companies such as Mojo Vision, Google, and Microsoft. The region benefits from strong venture capital support, government-backed innovation programs, and a high adoption rate of wearable technologies. It is a hub for early trials and product launches, with healthcare providers and defense organizations among the first adopters. The U.S. dominates within the region, driven by its leadership in both consumer electronics and advanced healthcare.
Europe
The Europe Augmented And Virtual Reality Contact Lens Market size was valued at USD 121.05 million in 2018 to USD 203.95 million in 2024 and is anticipated to reach USD 684.67 million by 2032, at a CAGR of 16.4% during the forecast period. Europe is showing robust growth led by Germany, the UK, France, and the Netherlands. The region’s strong emphasis on medical innovation and regulatory compliance encourages the adoption of smart healthcare solutions. It is attracting significant academic and clinical research aimed at validating smart lenses for ophthalmology and chronic disease management. Public-private partnerships and funding programs under the EU Horizon initiative are supporting long-term product development.
Asia Pacific
The Asia Pacific Augmented And Virtual Reality Contact Lens Market size was valued at USD 150.55 million in 2018 to USD 279.27 million in 2024 and is anticipated to reach USD 1,108.24 million by 2032, at a CAGR of 18.8% during the forecast period. Asia Pacific is the fastest-growing regional market. Countries like China, Japan, and South Korea are investing heavily in smart wearable R&D. The region’s vast population, high penetration of smartphones, and increasing demand for consumer AR/VR experiences create a fertile ground for smart lens adoption. It is also seeing adoption in education and industrial training, where real-time overlays enhance productivity. Governments in the region are launching pilot initiatives to promote AR/VR in healthcare diagnostics and remote learning.
Latin America
The Latin America Augmented And Virtual Reality Contact Lens Market size was valued at USD 39.66 million in 2018 to USD 69.79 million in 2024 and is anticipated to reach USD 235.40 million by 2032, at a CAGR of 16.5% during the forecast period. Latin America remains an emerging region with growing interest in healthcare technology and digital transformation. Brazil and Mexico are leading market contributors with pilot programs in smart diagnostics and telemedicine. It is still in an early stage of commercial deployment, but strong demand for mobile healthcare solutions and immersive education platforms presents future opportunities. Regulatory efforts are improving, and local manufacturers are forming partnerships with global tech firms to enable market entry.
Middle East
The Middle East Augmented And Virtual Reality Contact Lens Market size was valued at USD 35.50 million in 2018 to USD 60.45 million in 2024 and is anticipated to reach USD 205.56 million by 2032, at a CAGR of 16.6% during the forecast period. The region is adopting AR/VR lenses in line with smart city development and digital healthcare strategies. Countries like the UAE and Saudi Arabia are investing in pilot projects across defense, remote monitoring, and high-tech public infrastructure. It is also witnessing interest from educational institutions for virtual classroom enhancements. The presence of government-funded innovation zones and technology parks is likely to speed up adoption in the coming years.
Africa
The Africa Augmented And Virtual Reality Contact Lens Market size was valued at USD 21.79 million in 2018 to USD 46.11 million in 2024 and is anticipated to reach USD 163.97 million by 2032, at a CAGR of 17.1% during the forecast period. Africa presents a small but growing opportunity for AR/VR contact lenses. South Africa, Nigeria, and Kenya are emerging as early adopters in telemedicine and mobile diagnostics. The region is facing challenges with affordability and infrastructure, but donor-funded initiatives and partnerships with global health organizations are helping build awareness and accessibility. It is expected to grow steadily as demand rises for decentralized healthcare and low-cost wearable solutions.
Shape Your Report to Specific Countries or Regions & Enjoy 30% Off!
Key Player Analysis:
- Innovega
- Inwith Corp.
- Mojo Vision
- Sony
- Samsung
- Verily Life Sciences
- Sensimed AG
- Medella Health
- Alcon
- Ocumetrics Bionic Lens
Competitive Analysis:
The Global Augmented And Virtual Reality Contact Lens Market features a competitive landscape driven by innovation, intellectual property, and strategic funding. Key players include Mojo Vision, Innovega, Inwith Corp., Samsung, Sony, and Verily Life Sciences. These companies are advancing miniaturized displays, biometric sensors, and wireless integration within soft lens materials. It remains a highly R&D-intensive market, with most firms focused on securing patents and achieving clinical validation. Startups are attracting venture capital to support prototyping and regulatory compliance, while established tech firms leverage cross-sector expertise in optics, electronics, and AI. Strategic partnerships with medical institutions, telecom providers, and semiconductor manufacturers are shaping go-to-market strategies. The pace of commercialization depends on achieving scalability, user safety, and compliance across global markets. Competitive differentiation lies in design reliability, data accuracy, and seamless user experience, making technology leadership a core driver of long-term positioning.
Recent Developments:
- In March 2025, Sony announced the launch of OCELLUS (ASR-CT1), a camera tracking system designed to accelerate spatial content creation in AR and virtual production. OCELLUS delivers marker-free tracking, real-time metadata integration, and cross-compatibility with both Sony and non-Sony cameras for broadcast and cinematic virtual production. This system enhances the company’s toolkit for spatial content, facilitating seamless camera integration in the growing AR production space.
Market Concentration & Characteristics:
The Global Augmented And Virtual Reality Contact Lens Market is moderately concentrated, with a small number of players driving most innovation and early-stage commercialization. It is characterized by high entry barriers, including complex design requirements, regulatory challenges, and significant capital investment. The market remains in a pre-commercial phase, with prototypes undergoing clinical validation and performance testing. Strategic collaborations between tech firms, medical institutions, and component suppliers are critical for development. The pace of advancement is shaped by rapid progress in microelectronics, optics, and wireless systems. It relies heavily on intellectual property, with key players competing through patents and proprietary technologies. Most activity is focused in North America and parts of Asia, where R&D ecosystems support faster iteration and regulatory navigation.
Report Coverage:
The research report offers an in-depth analysis based on type, application, end user, features and functionality, and sales channel.It details leading market players, providing an overview of their business, product offerings, investments, revenue streams, and key applications. Additionally, the report includes insights into the competitive environment, SWOT analysis, current market trends, as well as the primary drivers and constraints. Furthermore, it discusses various factors that have driven market expansion in recent years. The report also explores market dynamics, regulatory scenarios, and technological advancements that are shaping the industry. It assesses the impact of external factors and global economic changes on market growth. Lastly, it provides strategic recommendations for new entrants and established companies to navigate the complexities of the market.
Future Outlook:
- The market will witness accelerated growth driven by rising adoption across healthcare, defense, and consumer electronics sectors.
- Advancements in micro-LED displays, biosensors, and wireless charging will improve device efficiency and wearability.
- Integration with AI and IoT platforms will enhance personalized content delivery and real-time biometric feedback.
- Strategic collaborations among tech firms, medical device companies, and telecom providers will expand market reach.
- Regulatory clarity and standardization will streamline product approvals and support global commercialization.
- Declining manufacturing costs and improved scalability will enable broader consumer access over the next decade.
- Medical use cases, including non-invasive diagnostics and remote monitoring, will gain strong traction.
- AR lenses will remain dominant, while VR applications will emerge in specialized training and simulation environments.
- North America and Asia-Pacific will continue to lead, with Europe showing steady progress under stricter regulations.
- Startups and early movers will play a key role in shaping innovation, patent portfolios, and go-to-market models.


