Market Overview
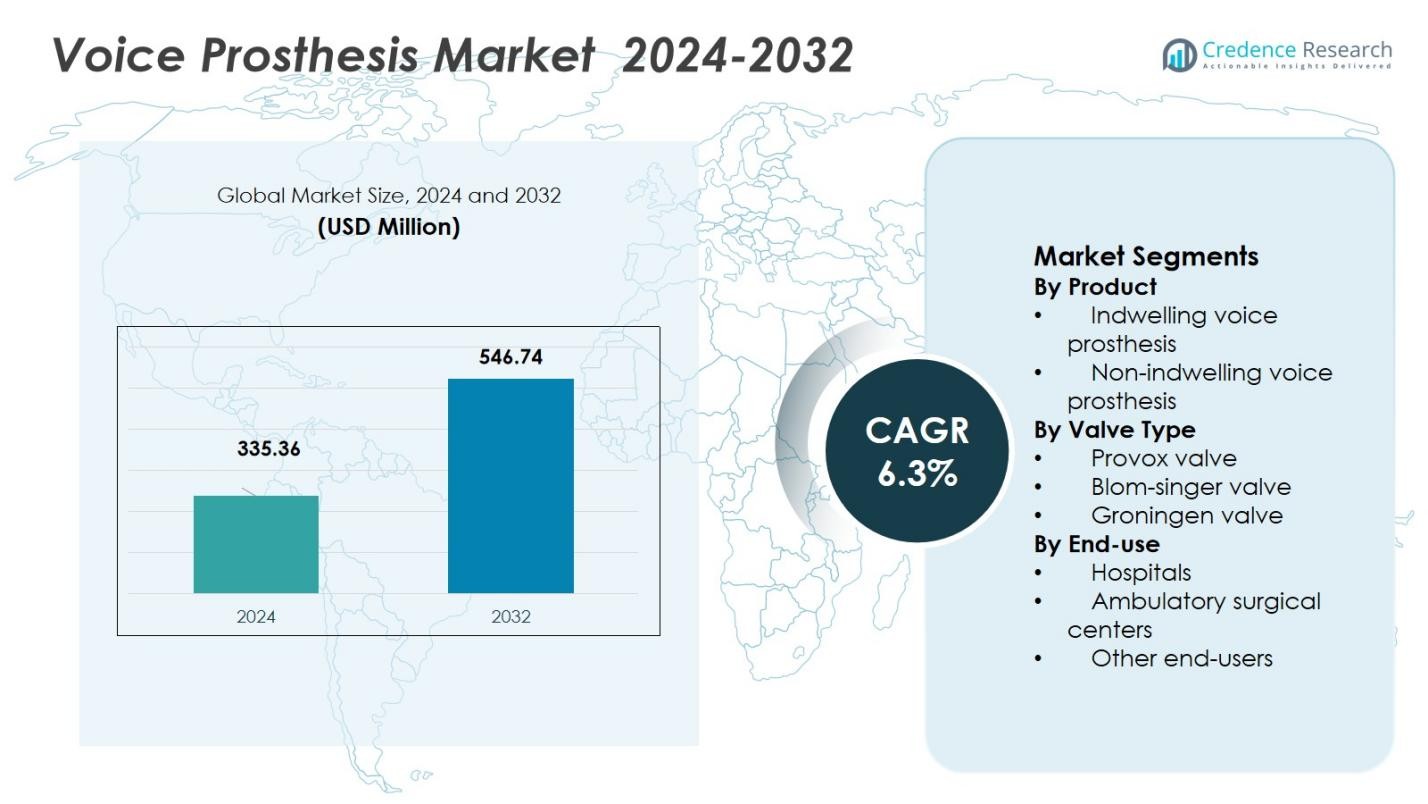
Voice Prosthesis Market size was valued at USD 335.36 million in 2024 and is anticipated to reach USD 546.74 million by 2032, at a CAGR of 6.3% during the forecast period.
| REPORT ATTRIBUTE |
DETAILS |
| Historical Period |
2020-2023 |
| Base Year |
2024 |
| Forecast Period |
2025-2032 |
| Voice Prosthesis Market Size 2024 |
USD 335.36 Million |
| Voice Prosthesis Market, CAGR |
6.3% |
| Voice Prosthesis Market Size 2032 |
USD 546.74 Million |
Voice Prosthesis Market sits at the forefront of vocal rehabilitation, with top players such as Atos Medical, InHealth Technologies, Hood Laboratories, ICU Medical, Inc., HEIMOMED Heinze GmbH & Co. KG, Andreas Fahl Medizintechnik‑Vertrieb GmbH, Innaumation Medical Devices Private Limited, Luminaud, Inc., Servona GmbH and Teleflex Incorporated spearheading product innovation, distribution and global outreach. The market gains its strongest regional foothold in North America, which holds a 41.33 % share of global revenues in 2024. Europe follows with 28.15 %, while Asia‑Pacific captures 17.52 % and is poised for rapid growth as healthcare access expands. Smaller but significant shares lie in Latin America (6.12 %) and Middle East & Africa (6.88 %), signalling broad global penetration. These leading companies and regions collectively shape the market trajectory for voice restoration solutions.
Access crucial information at unmatched prices!
Request your sample report today & start making informed decisions powered by Credence Research Inc.!
Download Sample
Market Insights
- The Voice Prosthesis Market size was valued at USD 335.36 million in 2024 and is projected to reach USD 546.74 million by 2032, growing at a CAGR of 6.3% during the forecast period.
- Rising prevalence of laryngeal cancer and advancements in medical technology, such as improved prosthesis designs and valve mechanisms, are key drivers for market growth.
- The growing shift toward patient‑centric and personalized prosthesis solutions, along with increased awareness of voice restoration options, will further drive adoption in developed and emerging regions.
- Major players like Atos Medical, InHealth Technologies, and ICU Medical, Inc. lead the market, focusing on innovation, expanding product portfolios, and strengthening their regional presence.
- North America dominates the market with a 41.33% share, followed by Europe at 28.15%, Asia‑Pacific at 17.52%, Latin America at 6.12%, and the Middle East & Africa at 6.88%, showing varied regional demand.
 Market Segmentation Analysis:
By Product
In the product-based segmentation of the voice prosthesis market, the indwelling voice prosthesis sub‑segment held a dominant share of 73.75 % in 2024. This dominance is driven by the superior stability, longevity, and lower maintenance burden of indwelling devices, which are replaced only by medical professionals, ensuring better fit and reduced patient intervention. The growing global incidence of laryngeal cancer and rising number of total laryngectomies directly support sustained demand for long-term, clinically managed solutions reinforcing indwelling devices as the backbone of revenues in this segment.
- For instance, Atos Medical’s Provox Vega is designed for ease of maintenance, better voice quality, and durability, with clinical data showing average device life extending beyond 200 days, which supports sustained speaking ability and reduces the frequency of replacement procedures.
By Valve Type
Within valve‑type segmentation, the Provox valve led the market with a 62.30 % revenue share in 2024. Provox’s technical edge manifested in low resistance to airflow, reduced leakage incidents, and a broad range of size/configuration options enabling tailored fit for individual anatomies makes it the preferred choice among clinicians and patients, especially in high-volume oncology centers. Its established clinical performance and widespread clinician familiarity further cement its leadership in valve-type market revenues.
- For instance, the Provox Vega voice prosthesis is recognized for its low speaking effort and ease of maintenance, improving voice quality post-laryngectomy.
By End‑Use
For the end-use segmentation, the hospital sub-segment accounted for 58.31 % of market share in 2024. Hospitals remain the primary settings for initial laryngectomy procedures, postoperative care, and voice‑prosthesis implantation services requiring multidisciplinary surgical, oncological, and rehabilitative capabilities. The concentration of specialized ENT and oncology departments in hospitals, along with the availability of trained professionals to manage prosthesis fitting and follow‑up care, drives this segment’s dominance.
Key Growth Driver
Rising prevalence of laryngeal cancer and related conditions
The increasing global incidence of laryngeal cancer is a primary driver expanding demand for voice prosthesis devices. As more patients undergo laryngectomy or other glottic/laryngeal surgeries, the need for post‑surgical voice restoration grows steadily. This elevated demand directly translates into higher adoption of voice prostheses to restore speech, thereby enlarging the overall market base. As head and neck cancer cases rise owing to risk factors like smoking, alcohol use, and environmental exposure, the voice prosthesis market continues to expand.
- For instance, InHealth Technologies, through its Blom-Singer® brand, pioneered the silicone valved voice prosthesis that has become the international standard for voice restoration, serving thousands of patients diagnosed with laryngeal cancer.
Advances in medical technology and voice rehabilitation innovation
Continuous improvements in prosthesis design, valve mechanisms, and materials, such as silicone-based implants and refined valve systems enhance device reliability, comfort, and voice quality, making adoption increasingly attractive. Innovations allow prostheses to better mimic natural speech and reduce complications, which improves patient outcomes and satisfaction. Concurrently, the trend toward minimally invasive ENT procedures and advanced tracheoesophageal puncture techniques supports broader use of voice prostheses. These technological developments reinforce clinician and patient confidence, driving market growth.
- For instance, Johns Hopkins surgeons have advanced minimally invasive tracheoesophageal puncture techniques that shorten procedure time and reduce postoperative complications.
Rising patient awareness and expanding healthcare infrastructure
Growing awareness among patients, caregivers, and healthcare professionals about voice restoration options after laryngectomy or voice‑box removal is increasing adoption rates. Educational efforts, advocacy, and improved information flow on rehabilitation outcomes encourage earlier and wider use of voice prostheses. Simultaneously, expansion of healthcare infrastructure globally particularly in developing regions and better access to ENT and oncology services increases the availability of voice prosthesis solutions. These combined factors broaden the potential user base, fueling overall market expansion.
Key Trend & Opportunity
Growing demand for personalized and patient‑centric prosthesis solutions
The market is witnessing a shift toward more customized and patient‑specific voice prosthesis solutions, including tailored valve types, sizes, and material choices to match individual anatomy and clinical needs. This patient‑centric approach enables better comfort, improved voice quality, and reduced complication rates, creating a strong value proposition for clinicians and patients alike. As personalized medicine gains prominence in ENT and oncology care, manufacturers offering tailored prostheses are well positioned to capture increased demand presenting a significant growth opportunity.
- For instance, HP partnered with the Limb Kind Foundation to deliver custom 3D-printed pediatric prosthetic sockets to children in underserved regions like Kenya and Sri Lanka, using anatomical scans and advanced Multi Jet Fusion technology to create tailored fits with rapid production and delivery times.
Strategic collaborations, product bundling and emerging market expansion
Collaborations between manufacturers, healthcare institutions, and research entities are enabling the integration of advanced features (e.g., anti-reflux valves, bioengineered materials) and bundled solutions (prosthesis plus surgical kits or accessories). Such alliances accelerate innovation and widen product offerings, making adoption easier and more cost‑effective for providers. Meanwhile, rising demand in emerging markets, spurred by growing incidence of throat cancers, improving healthcare access, and increasing affordability provides significant expansion potential beyond traditional developed‑market strongholds.
- For instance, NIH’s National Institute of Dental and Craniofacial Research expanding partnerships through the Accelerating Medicines Partnership® Program to drive biomedical innovation and new product development with industry and academic collaborators.
Key Challenge
High cost and economic barriers to device adoption
Voice prosthesis devices and associated surgical procedures remain expensive for many patients, particularly in regions with limited reimbursement or lower per‑capita income. High upfront and maintenance costs (for replacement, follow‑up care, or regular cleaning in non‑indwelling devices) can deter adoption or lead patients to forgo prosthesis altogether. This economic barrier constrains market penetration especially in price‑sensitive or under‑insured populations and may slow growth in certain geographies.
Device longevity, complications and need for frequent replacements
Voice prostheses are subject to wear, leakage, microbial/biofilm formation, and valve failure over time, often necessitating frequent replacement or maintenance. Such limitations can reduce patient compliance and satisfaction, impacting overall adoption. Additional complications — such as leakage of saliva or aspiration raise clinical risk and discourage both patients and clinicians, especially where follow‑up care or maintenance support is insufficient. These reliability and durability challenges pose a significant restraint to sustained market growth.
Regional Analysis
North America
North America commanded a leading position in the voice prosthesis market, capturing 41.33% of global revenues in 2024. The region’s dominance stems from its advanced healthcare infrastructure, widespread availability of high‑quality ENT and oncology care, and robust reimbursement mechanisms that facilitate access to voice prosthesis devices. High incidence of laryngeal cancer and a large number of total laryngectomy procedures further reinforce demand. Clinicians and patients benefit from early access to next‑generation prostheses, driving steady uptake of indwelling and advanced valve‑type devices in major hospitals and specialty centers.
Europe
In Europe, the voice prosthesis market holds a substantial share of 28.15%, supported by well‑established healthcare services, standardized post‑laryngectomy care pathways, and growing awareness of voice rehabilitation benefits. Widespread adoption of established valve solutions and prosthesis devices across Western and Northern European countries continues to generate stable demand. European clinicians increasingly emphasize postoperative quality of life, promoting long‑term use of voice prostheses. The presence of leading manufacturers and growing ENT surgical volumes further underpin the region’s significance in the global landscape.
Asia‑Pacific
The Asia‑Pacific region is emerging as the fastest‑growing market segment, driven by rising incidence of laryngeal cancer, expanding healthcare access, and increasing adoption of reconstructive ENT procedures. The region captured 17.52% of the global market in 2024. As patients in countries such as China, India, Japan, and South Korea gain improved access to voice restoration solutions, demand is projected to accelerate. Lower‑cost prosthesis options, increasing awareness of post‑surgical rehabilitation, and expanding hospital and clinical infrastructure are central to growth. This region is poised to progressively widen its share of global voice prosthesis market revenues over the forecast period.
Latin America
Latin America occupies a modest but growing portion of the global voice prosthesis market, with a share of 6.12% in 2024. Supported by increasing prevalence of laryngeal disorders and gradually improving ENT healthcare infrastructure, demand for voice prostheses is slowly rising. Although economic constraints and limited reimbursement in certain countries remain challenges, growing patient awareness and gradual infrastructure investments are enabling incremental uptake of prosthetic devices, particularly in urban centers.
Middle East & Africa
The Middle East & Africa region currently represents 6.88% of the global voice prosthesis market but shows potential for growth as healthcare systems evolve and investments in oncology and ENT care increase. Rising incidence of head and neck cancers, improved diagnostic capabilities, and gradual expansion of hospital-based voice rehabilitation services contribute to a slowly growing demand. Challenges remain related to affordability, access to trained specialists, and regional disparities in care quality, which temper rapid market growth in the near term.
Market Segmentations:
By Product
- Indwelling voice prosthesis
- Non-indwelling voice prosthesis
By Valve Type
- Provox valve
- Blom-singer valve
- Groningen valve
By End-use
- Hospitals
- Ambulatory surgical centers
- Other end-users
By Geography
- North America
- Europe
- Germany
- France
- U.K.
- Italy
- Spain
- Rest of Europe
- Asia Pacific
- China
- Japan
- India
- South Korea
- South-east Asia
- Rest of Asia Pacific
- Latin America
- Brazil
- Argentina
- Rest of Latin America
- Middle East & Africa
- GCC Countries
- South Africa
- Rest of the Middle East and Africa
Competitive Landscape
The global voice prosthesis market is highly competitive, with key players such as Atos Medical, InHealth Technologies, Andreas Fahl Medizintechnik‑Vertrieb GmbH, Hood Laboratories, ICU Medical, Inc., HEIMOMED Heinze GmbH & Co. KG, Innaumation Medical Devices Private Limited, Luminaud, Inc., Servona GmbH, and Teleflex Incorporated driving the market forward. These companies lead the market by focusing on product innovation, reliability, and expanding their distribution networks. Competitive differentiation is achieved through advancements in valve technology, such as the development of indwelling and non‑indwelling prostheses, improved materials for durability and biofilm resistance, and complementary products like cleaning kits. Strategic initiatives, including mergers, acquisitions, and global expansion, further intensify competition, with large players strengthening their presence in both developed and emerging markets. Smaller or niche companies often focus on cost‑effective solutions or unique prosthesis designs, ensuring the market caters to a wide range of patient needs and preferences.
Key Player Analysis
- InHealth Technologies
- Andreas Fahl Medizintechnik‑Vertrieb GmbH
- HEIMOMED Heinze GmbH & Co. KG
- Innaumation Medical Devices Private Limited
- Atos Medical
- Hood Laboratories
- Luminaud, Inc.
- ICU Medical, Inc.
- Servona GmbH
- Teleflex Incorporated
Recent Developments
- In September 2025, Boston Medical Products introduced a new indwelling voice prosthesis designed for greater durability and enhanced patient comfort, targeting outpatient rehabilitation settings.
- In October 2025, Medtronic acquired a startup focused on smart‑sensor integration for voice prostheses a move aimed at enhancing device functionality and enabling real‑time patient monitoring.
- In August 2022, InHealth Technologies announced the commercial release of the Blom-Singer Day&Night HME, a unique device for patients who have undergone total laryngectomy.
Shape Your Report to Specific Countries or Regions & Enjoy 30% Off!
Report Coverage
The research report offers an in-depth analysis based on Product, Valve Type, End Use and Geography. It details leading market players, providing an overview of their business, product offerings, investments, revenue streams, and key applications. Additionally, the report includes insights into the competitive environment, SWOT analysis, current market trends, as well as the primary drivers and constraints. Furthermore, it discusses various factors that have driven market expansion in recent years. The report also explores market dynamics, regulatory scenarios, and technological advancements that are shaping the industry. It assesses the impact of external factors and global economic changes on market growth. Lastly, it provides strategic recommendations for new entrants and established companies to navigate the complexities of the market.
Future Outlook
- Global demand for voice prostheses will grow as the incidence of laryngeal and head-neck cancers continues rising, leading to more laryngectomy procedures and increased need for voice restoration.
- Advances in materials science and prosthesis design will yield more durable, biofilm-resistant, and user-friendly devices, improving patient comfort and reducing maintenance needs, thereby enhancing adoption rates.
- Growing emphasis on quality of life and rehabilitation after laryngectomy will drive integration of voice prostheses into standard post-operative and long-term care protocols.
- Expansion of healthcare infrastructure and ENT/oncology services in emerging markets will open new regional demand pools, extending access to voice prosthesis devices beyond traditional markets.
- Rising awareness among patients, caregivers, and clinicians about voice restoration options will boost acceptance and encourage early adoption of prostheses after voice-box removal.
- Growing geriatric populations in many countries will lead to increased incidence of diseases and surgical interventions affecting voice, expanding the potential patient base for prosthesis devices.
- Integration of voice prostheses with rehabilitation services, including speech therapy and post-surgical follow-up, will improve long-term outcomes and patient satisfaction, driving repeat business and referrals.
- Development of lower-cost, accessible, and simpler-to-use non-indwelling or self-managed prosthesis variants will make voice restoration more feasible in resource-constrained settings, broadening market reach.
- Telehealth and remote rehabilitation services may facilitate follow-up care and device maintenance for voice prosthesis users, increasing compliance and improving long-term device success.
- Manufacturers and healthcare providers may collaborate to offer bundled surgical + rehabilitation + device packages, making voice restoration more standardized and integrated which will accelerate overall market growth.


