
Market Overview:
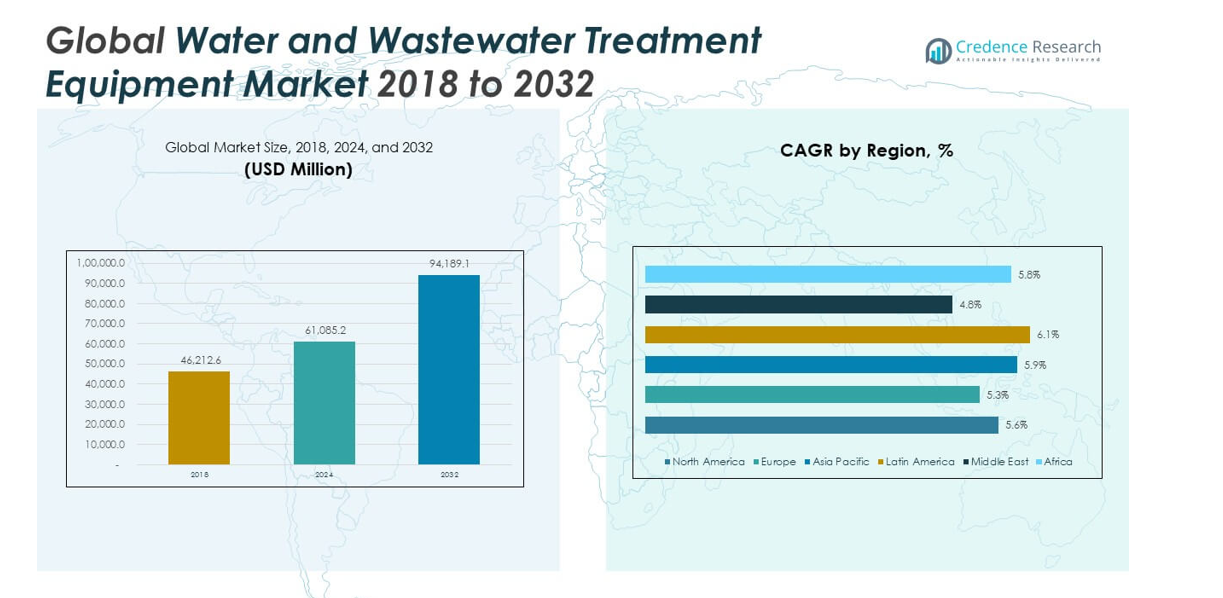
The Global Water and Wastewater Treatment Equipment Market size was valued at USD 46,212.6 million in 2018, reached USD 61,085.2 million in 2024, and is anticipated to reach USD 94,189.1 million by 2032, at a CAGR of 5.62% during the forecast period.
| REPORT ATTRIBUTE | DETAILS |
|---|---|
| Historical Period | 2020-2023 |
| Base Year | 2024 |
| Forecast Period | 2025-2032 |
| Water and Wastewater Treatment Equipment Market Size 2024 | USD 61,085.2 million |
| Water and Wastewater Treatment Equipment Market, CAGR | 5.62% |
| Water and Wastewater Treatment Equipment Market Size 2032 | USD 94,189.1 million |
Growing industrialization, urbanization, and stricter environmental regulations are driving the demand for water and wastewater treatment equipment. Rising concerns over water scarcity and the need for safe drinking water are pushing governments and industries to invest in advanced treatment solutions. Adoption of membrane filtration, UV disinfection, and biological treatment technologies is expanding, supported by increasing awareness about sustainability and public health safety. The market is also witnessing growth due to investments in smart water management systems and technological innovations that improve efficiency.
Regionally, North America and Europe lead the market, driven by strong regulatory frameworks, advanced infrastructure, and high adoption of sustainable treatment technologies. Asia Pacific is emerging as the fastest-growing region, supported by rapid urbanization, population growth, and government initiatives to improve water access and wastewater management in countries such as China and India. Meanwhile, regions like Latin America and the Middle East & Africa are gradually expanding their adoption, fueled by increasing industrial activities and the need to address rising water scarcity challenges.
Market Insights:
- The Global Water and Wastewater Treatment Equipment Market size was valued at USD 46,212.6 million in 2018, reached USD 61,085.2 million in 2024, and is anticipated to reach USD 94,189.1 million by 2032, growing at a CAGR of 5.62% during the forecast period.
- Asia Pacific (35.3%), North America (27.3%), and Europe (21.7%) held the top three regional shares in 2024, driven by strong infrastructure, regulatory compliance, and expanding municipal and industrial projects.
- Latin America is the fastest-growing region with a 9.2% share in 2024, supported by urbanization, industrial expansion, and international funding for water infrastructure.
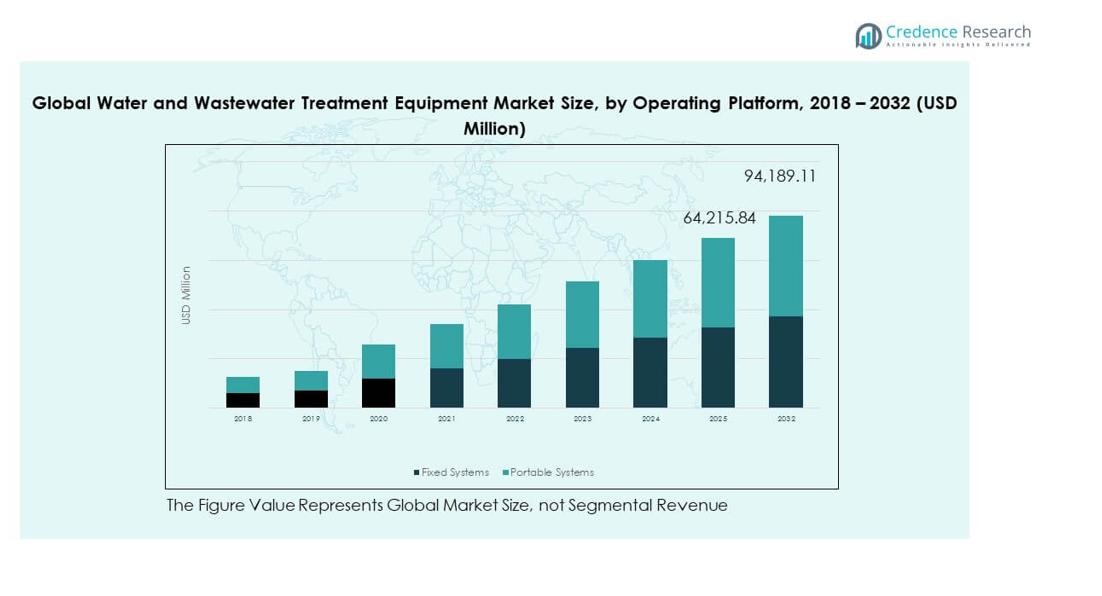
- Fixed systems accounted for 42% of the market share in 2024, supported by their use in large-scale municipal and industrial facilities.
- Portable systems captured the remaining 58% share in 2024, benefiting from flexibility, ease of deployment, and rising adoption in remote and temporary installations.
Market Drivers:
Rising Demand for Clean Water Driven by Population Growth and Urban Expansion
The growing global population has intensified the pressure on freshwater resources. Urban expansion increases demand for reliable drinking water supply and wastewater treatment facilities. Industries and households both contribute to mounting wastewater volumes that require effective solutions. The Global Water and Wastewater Treatment Equipment Market is expanding as governments enforce stricter standards for water quality. Public health concerns reinforce the urgency for advanced treatment technologies. It is supported by international organizations that emphasize access to safe water. Rapid urban migration creates challenges for municipal systems that must adopt efficient equipment. Rising investment ensures that infrastructure keeps pace with population-driven demand.
- For instance, in February 2024, Veolia reported deploying over 250 digital dashboards worldwide, which reduced unplanned maintenance events by 18% in its water treatment operations.
Industrial Growth and Environmental Regulations Driving Equipment Adoption Across Sectors
Industrialization has raised water consumption levels in sectors such as energy, chemicals, and food processing. Wastewater from these industries requires specialized treatment before discharge. Environmental regulations compel industries to install compliant treatment systems. Governments impose penalties for non-compliance, pushing companies toward investment in efficient solutions. The Global Water and Wastewater Treatment Equipment Market benefits from strong enforcement of pollution control rules. It also gains from sustainability goals adopted by leading corporations worldwide. Treatment equipment enables industries to reduce resource wastage and operational costs. Growing awareness of corporate responsibility ensures continued investment in robust treatment infrastructure.
- For instance, throughout 2023, BASF implemented various measures to optimize water use, such as commissioning a membrane bioreactor for wastewater treatment at its Freeport, Texas, site. This project was initiated to improve the plant's wastewater treatment capacity and performance, with plans to recycle the treated water to reduce freshwater demand.
Technological Advancements Enhancing Efficiency and Reducing Lifecycle Costs of Systems
Innovations in membrane filtration, disinfection, and sludge management strengthen market growth. Improved energy efficiency reduces operational costs for municipal and industrial operators. Automation and digital monitoring enhance reliability and allow predictive maintenance. The Global Water and Wastewater Treatment Equipment Market gains from ongoing R&D investments. It is evolving toward equipment that balances high performance with cost optimization. Smart systems provide real-time data that improve process control. Long-term lifecycle costs are reduced by integrating advanced designs. Companies focus on developing solutions that deliver both compliance and resource savings.
Government Support and Infrastructure Investment Expanding Adoption of Treatment Solutions
National and local governments play a critical role in water infrastructure development. Funding for municipal water and wastewater projects ensures steady demand for equipment. The Global Water and Wastewater Treatment Equipment Market expands with public-private partnerships. It benefits from international funding programs that target water security projects. Infrastructure upgrades in emerging economies create significant business opportunities. It is supported by policy frameworks that prioritize sustainable water management. Strong political commitment secures long-term investment in essential facilities. Expansion of wastewater reuse initiatives strengthens the market’s relevance worldwide.
Market Trends:
Integration of Smart Water Management Technologies into Treatment Equipment Systems
Digitalization is reshaping how water and wastewater treatment systems operate globally. Smart monitoring tools provide actionable insights for predictive maintenance. Automation reduces downtime and improves equipment efficiency. The Global Water and Wastewater Treatment Equipment Market is seeing integration of IoT-enabled solutions. It benefits from analytics that optimize energy use and treatment performance. Utilities are adopting digital dashboards for better system visibility. Advanced sensors provide data on water quality in real time. Growing adoption of smart technologies transforms traditional equipment into intelligent systems.
- For instance, in June 2024, India’s Jal Jeevan Mission completed the installation of more than 60 million rural household tap connections, expanding access to safe water by 27% in targeted regions.
Increasing Adoption of Decentralized Treatment Systems for Remote and Rural Areas
Decentralized systems are gaining importance in communities without large treatment facilities. Compact units are being deployed in rural regions and small towns. These systems reduce dependence on central infrastructure and lower distribution costs. The Global Water and Wastewater Treatment Equipment Market sees higher demand for modular units. It benefits from easier installation and quicker deployment timelines. Small-scale treatment plants improve access in areas with limited resources. Governments encourage decentralized models to reach underserved populations. Growing focus on inclusivity expands adoption of localized treatment systems.
- For instance, in May 2024, the World Bank announced its support for a new rural water and sanitation project in Pernambuco, Brazil, aimed at expanding sustainable services for approximately one million people. This initiative focuses on climate resilience and targets underserved rural communities in a state with significant regional disparities in water access.
Sustainability and Circular Economy Principles Shaping Equipment Development Practices
Manufacturers are embedding sustainability into product design and operation. Energy-efficient systems reduce carbon footprint while ensuring compliance. Equipment is designed for water reuse and recycling applications. The Global Water and Wastewater Treatment Equipment Market evolves with circular economy goals. It is influenced by growing corporate commitments to environmental responsibility. Eco-friendly materials and recyclable components are prioritized in equipment design. Sustainable practices improve acceptance in regulated markets. Global emphasis on resource efficiency accelerates adoption of green solutions.
Emergence of Advanced Biological and Hybrid Treatment Technologies for Higher Efficiency
Biological treatment methods are gaining traction for complex wastewater applications. Hybrid solutions combine physical, chemical, and biological processes to improve outcomes. These technologies address challenges related to nutrient removal and sludge management. The Global Water and Wastewater Treatment Equipment Market is adopting innovative hybrids. It is strengthened by demand for systems that deliver better compliance results. R&D investment focuses on scalable and cost-effective biological systems. Operators value hybrid systems for their ability to handle variable loads. Growing focus on efficiency and resilience promotes hybrid adoption across regions.
Market Challenges Analysis:
High Capital and Operating Costs Limiting Adoption in Price-Sensitive Regions
Treatment equipment requires significant upfront investment, creating barriers in developing countries. Operating costs, including energy and chemical inputs, further limit affordability. Municipalities in low-income regions face challenges funding large-scale projects. The Global Water and Wastewater Treatment Equipment Market often struggles with financing gaps. It is particularly evident in countries with competing infrastructure priorities. High costs delay modernization efforts and discourage adoption of advanced technologies. Industrial players in emerging markets also hesitate due to capital constraints. Affordability remains a significant barrier to widespread deployment.
Complex Regulatory Compliance and Infrastructure Limitations Hindering Growth Potential
Regulatory requirements vary widely across regions, complicating global operations. Industries must adapt equipment to meet differing local standards. Inconsistent enforcement undermines adoption in several markets. The Global Water and Wastewater Treatment Equipment Market faces hurdles in aligning solutions to diverse frameworks. It is further challenged by weak infrastructure in rural or remote regions. Lack of skilled operators reduces system efficiency and reliability. Complexities in integrating advanced technologies with outdated infrastructure slow progress. Regulatory and operational obstacles together restrict full market potential.
Market Opportunities:
Growing Demand for Water Reuse and Recycling Creating Long-Term Equipment Opportunities
Water scarcity is intensifying demand for reuse and recycling technologies worldwide. Municipalities adopt advanced equipment to extend the utility of treated water. Industries pursue recycling systems to secure supply and reduce costs. The Global Water and Wastewater Treatment Equipment Market benefits from this structural shift. It is reinforced by sustainability goals and tighter regulations on freshwater withdrawal. Demand for zero-liquid discharge solutions creates additional opportunities. Partnerships between governments and private players expand recycling adoption. Long-term opportunities emerge as reuse becomes central to water management.
Expansion of Emerging Markets Driving Infrastructure Investment and Equipment Deployment
Developing economies are investing heavily in new water infrastructure projects. Rapid industrialization and urbanization raise demand for modern treatment systems. The Global Water and Wastewater Treatment Equipment Market gains momentum in Asia and Africa. It is supported by government initiatives for clean water access. Rising middle-class populations drive investment in municipal facilities. Industrial expansion requires adoption of compliant treatment technologies. International funding accelerates large-scale projects in resource-limited regions. Growth in emerging markets represents a vital opportunity for equipment suppliers.
Market Segmentation Analysis:
By Product
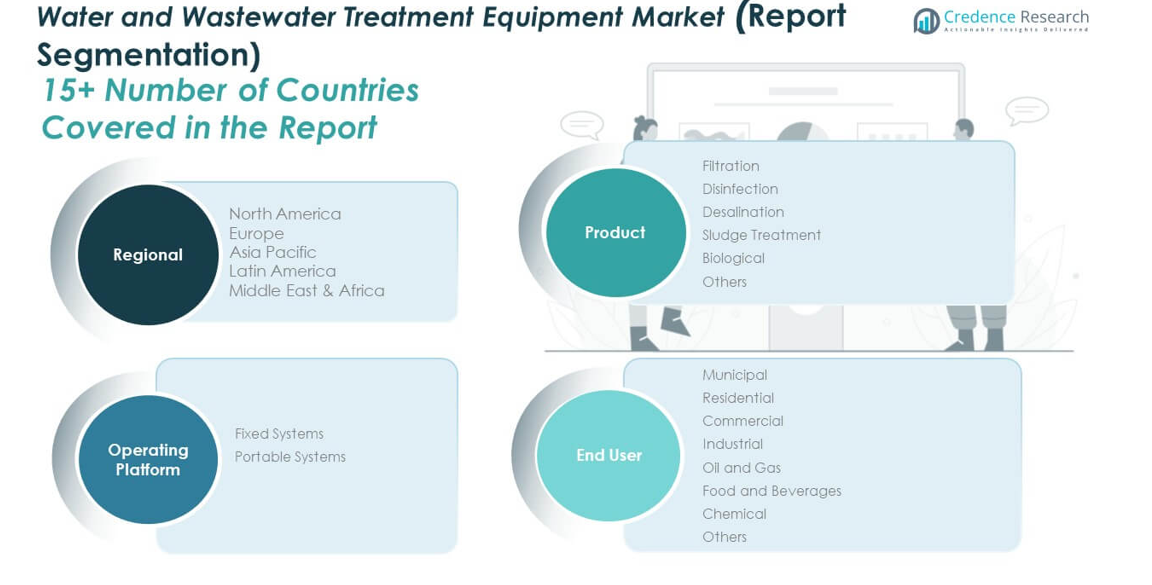
Filtration dominates the Global Water and Wastewater Treatment Equipment Market, supported by wide adoption in municipal and industrial applications. It is valued for its efficiency in removing suspended solids and contaminants. Disinfection holds strong demand due to rising focus on safe drinking water and stringent health standards. Desalination is gaining ground in water-scarce regions, where access to fresh water remains limited. Sludge treatment equipment addresses growing waste management concerns in both municipal and industrial facilities. Biological systems are expanding, driven by demand for eco-friendly processes and compliance with nutrient removal standards. Other product categories provide niche solutions for specialized treatment needs.
- For instance, Sludge treatment equipment demand increased year-on-year in European municipal facilities due to mounting waste management regulations. Biological treatment systems are expanding, especially in Asian markets, where compliance with nutrient removal standards is critical for municipal plant upgrades.
By Operating Platform
Fixed systems account for the larger share due to their extensive use in large-scale municipal and industrial plants. It supports continuous operations and offers long-term cost efficiency. Portable systems are expanding quickly, supported by flexibility in remote sites, temporary installations, and small-scale community projects. Their ease of deployment makes them attractive for disaster management and short-term demand surges.
- For instance, the portable power station market is projected to grow by approximately 18% per year in the near future and has seen growing adoption for emergency power and off-grid applications. Similarly, modular and portable buildings are increasingly used for temporary infrastructure projects like disaster relief shelters due to their rapid deployment and versatile design.
By End User
Municipal applications remain the largest segment, reflecting the rising need for safe water supply and effective wastewater management. Within this category, residential demand is fueled by urban growth, while commercial usage expands with real estate development and service industries. Industrial applications form a critical growth pillar, with oil and gas projects requiring robust treatment for high-contaminant effluents. The food and beverages sector demands hygienic treatment solutions to meet strict safety regulations. Chemical industries require specialized equipment to handle hazardous discharges. Other industrial categories adopt treatment technologies to meet compliance and efficiency goals.
Segmentation:
By Product
- Filtration
- Disinfection
- Desalination
- Sludge Treatment
- Biological
- Others
By Operating Platform
- Fixed Systems
- Portable Systems
By End User
- Municipal
- Residential
- Commercial
- Industrial
- Oil and Gas
- Food and Beverages
- Chemical
- Others
By Region
- North America
- U.S.
- Canada
- Mexico
- Europe
- Germany
- France
- U.K.
- Italy
- Spain
- Rest of Europe
- Asia Pacific
- China
- Japan
- India
- South Korea
- South-east Asia
- Rest of Asia Pacific
- Latin America
- Brazil
- Argentina
- Rest of Latin America
- Middle East & Africa
- GCC Countries
- South Africa
- Rest of the Middle East and Africa
Regional Analysis:
North America
The North America Water and Wastewater Treatment Equipment Market size was valued at USD 12,671.48 million in 2018 to USD 16,691.97 million in 2024 and is anticipated to reach USD 25,619.44 million by 2032, at a CAGR of 5.6% during the forecast period. North America holds a 27.3% market share in 2024, driven by stringent regulatory frameworks, advanced infrastructure, and strong focus on water reuse. The U.S. leads the region with large municipal projects, while Canada modernizes urban water systems and Mexico invests in industrial expansion. It is supported by demand from oil and gas operations requiring advanced treatment. Adoption of smart water management tools enhances operational efficiency, and sustainability programs promote the integration of digital monitoring and energy-efficient solutions.
Europe
The Europe Water and Wastewater Treatment Equipment Market size was valued at USD 10,217.60 million in 2018 to USD 13,241.53 million in 2024 and is anticipated to reach USD 19,873.90 million by 2032, at a CAGR of 5.3% during the forecast period. Europe accounts for 21.7% of the global market in 2024, supported by strict EU directives, sustainability goals, and advanced water reuse initiatives. Germany leads with strong infrastructure, while France and the UK prioritize modernization. Southern and Eastern Europe expand municipal coverage, and industries such as chemicals and food processing adopt specialized equipment. It benefits from innovation in energy-efficient technologies and circular economy practices, keeping Europe competitive.
Asia Pacific
The Asia Pacific Water and Wastewater Treatment Equipment Market size was valued at USD 16,072.73 million in 2018 to USD 21,536.03 million in 2024 and is anticipated to reach USD 33,804.47 million by 2032, at a CAGR of 5.9% during the forecast period. Asia Pacific holds the largest share of 35.3% in 2024, driven by rapid urbanization, industrial growth, and government programs for water security. China leads with heavy investment in municipal and industrial projects, India expands under clean water missions, and Japan and South Korea adopt high-performance technologies. It is supported by growing demand in electronics, food, and beverage industries. Rising desalination projects and water reuse initiatives strengthen regional adoption, making Asia Pacific the fastest-growing market.
Latin America
The Latin America Water and Wastewater Treatment Equipment Market size was valued at USD 4,117.54 million in 2018 to USD 5,584.06 million in 2024 and is anticipated to reach USD 8,900.87 million by 2032, at a CAGR of 6.1% during the forecast period. Latin America represents 9.2% of the global market in 2024, with growth led by Brazil’s municipal and industrial investments. Mexico and Argentina expand infrastructure to meet urban and regulatory needs. It is supported by strong demand from food and beverage industries, while multilateral agencies provide funding for projects. Rising urbanization and water scarcity issues push governments to strengthen infrastructure, and decentralized systems see adoption in underserved areas.
Middle East
The Middle East Water and Wastewater Treatment Equipment Market size was valued at USD 2,208.96 million in 2018 to USD 2,799.45 million in 2024 and is anticipated to reach USD 4,068.97 million by 2032, at a CAGR of 4.8% during the forecast period. The region accounts for 4.6% of the global market in 2024, dominated by desalination projects due to extreme water scarcity. Saudi Arabia and the UAE lead in large-scale investments, while Israel excels in water reuse and recycling. Turkey strengthens municipal networks, and oil and gas industries drive demand for specialized solutions. It benefits from strong government policies, public-private partnerships, and steady infrastructure upgrades.
Africa
The Africa Water and Wastewater Treatment Equipment Market size was valued at USD 924.25 million in 2018 to USD 1,232.18 million in 2024 and is anticipated to reach USD 1,921.46 million by 2032, at a CAGR of 5.8% during the forecast period. Africa holds a 2.0% share in 2024, with South Africa leading adoption, Egypt expanding projects, and Sub-Saharan nations showing early potential. It is supported by international funding and decentralized systems that address rural water needs. Industrial demand from mining and energy strengthens adoption. Urbanization pressures governments to expand municipal networks, while challenges remain in infrastructure and affordability. Long-term opportunities depend on policy support and sustained investment.
Key Player Analysis:
- Water & Process Technologies
- Aquatech International Corporation
- Veolia Water Technologies
- Fluence Corporation Limited
- Napier Reid Ltd.
- WPL Limited
- Calgon Carbon Corporation
- Xylem Inc.
- Kemira Oyj
- Corix Water System
- Other Key Players
Competitive Analysis:
The Global Water and Wastewater Treatment Equipment Market is highly competitive with a blend of global leaders and regional specialists. It features companies such as Veolia, Xylem, Aquatech, Fluence, Kemira, and Calgon Carbon, which compete through technological innovation, product diversity, and service integration. It is driven by strong demand for advanced filtration, disinfection, and desalination solutions. Large firms leverage scale and R&D to expand presence, while regional players focus on customization and cost efficiency. Partnerships, acquisitions, and new product launches remain central to market positioning. Competitive intensity is reinforced by strict regulations that push players toward innovation in energy-efficient and sustainable systems.
Recent Developments:
- In September 2025, Xylem Inc. formed a strategic partnership with Moleaer to scale its nanobubble technology globally. The deal includes a distribution agreement and strategic investment in Moleaer, enhancing water and wastewater treatment capacity and cost efficiency.
- In July 2025, Xylem Inc. acquired EnviroMix, a company in nutrient removal and water treatment solutions, to strengthen its treatment portfolio and broaden its product offering in the wastewater treatment segment.
- In June 2025, Veolia inaugurated one of the largest PFAS treatment plants in the U.S. at Stanton, Delaware. The facility removes regulated PFAS compounds from drinking water for over 100,000 residents, under its “BeyondPFAS” end-to-end solution model.
- In May 2025, Veolia acquired the remaining 30% stake it did not hold in its Water Technologies and Solutions (WTS) subsidiary, gaining full ownership. This move aims to simplify structure and unlock synergies of ~€90 million by 2027.
Report Coverage:
The research report offers an in-depth analysis based on product, operating platform, and end-user segments. It details leading market players, providing an overview of their business, product offerings, investments, revenue streams, and key applications. Additionally, the report includes insights into the competitive environment, SWOT analysis, current market trends, as well as the primary drivers and constraints. Furthermore, it discusses various factors that have driven market expansion in recent years. The report also explores market dynamics, regulatory scenarios, and technological advancements that are shaping the industry. It assesses the impact of external factors and global economic changes on market growth. Lastly, it provides strategic recommendations for new entrants and established companies to navigate the complexities of the market.
Future Outlook:
- Rising investments in water reuse and recycling will shape long-term demand.
- Smart monitoring and automation adoption will expand across municipal projects.
- Industrial compliance requirements will increase reliance on advanced systems.
- Energy-efficient equipment will gain preference in regulated regions.
- Modular and portable systems will see growth in remote and rural areas.
- Strategic partnerships and M&A will drive technology integration.
- Desalination projects will accelerate in water-scarce regions.
- Government funding and PPPs will strengthen infrastructure pipelines.
- Sustainability and circular economy goals will influence equipment design.
- Emerging economies will contribute significantly to global expansion.

Request a Free Sample
Fill in your details and we'll send you a free sample report.
- Sample data tables & charts
- Research methodology
Market Dynamics
Urbanization and Population Growth
Rapid urban expansion and rising global population are increasing the demand for reliable drinking water supply and effective wastewater treatment, driving investments in advanced equipment for municipal and residential applications.
Stricter Environmental Regulations
Governments worldwide are enforcing more stringent water quality and discharge standards, compelling both municipal and industrial sectors to adopt compliant and efficient treatment technologies, thus boosting market growth.
Technological Advancements and Smart Systems
Innovations in membrane filtration, digital monitoring, and automation are enhancing operational efficiency, reducing lifecycle costs, and enabling predictive maintenance, making advanced treatment equipment more attractive to utilities and industries.
Industrial Expansion and Water Scarcity
Growth in water-intensive industries such as energy, chemicals, and food processing, combined with increasing water scarcity, is driving the adoption of specialized treatment and recycling equipment to ensure sustainable operations and regulatory compliance.
Government Funding and Infrastructure Investment
Public and international funding, along with public-private partnerships, are supporting large-scale water infrastructure upgrades, especially in emerging markets, expanding the deployment of modern treatment equipment.
Need a Custom Version of This Report?
Tailor the scope, geography, or segments to your exact requirements.
- Custom geography or segment scope
- Direct access to our analyst team
Frequently Asked Questions
What is the projected market size of the Water and Wastewater Treatment Equipment Market?
At what Compound Annual Growth Rate is the Global Water and Wastewater Treatment Equipment Market projected to grow between 2025 and 2032?
What are the key drivers of growth in the Water and Wastewater Treatment Equipment Market?
Which regions are leading the Water and Wastewater Treatment Equipment Market?
How are regulations influencing the market?
What role do technological advancements play in the market’s growth?
Table of Content
Chapter 1 Market Segmentation
- 1.1 Segmentation Framework
- 1.1.1 Product and Service Classification
- 1.1.2 Application and End-Use Classification
- 1.1.3 Technology and Solution Classification
- 1.1.4 Customer and Distribution Channel Classification
- 1.1.5 Geographic Segmentation
- 1.1.6 Market Segment Definitions and Boundaries
- 1.2 By Product
- 1.2.1 Filtration
- 1.2.2 Disinfection
- 1.2.3 Desalination
- 1.2.4 Sludge Treatment
- 1.2.5 Biological
- 1.2.6 Others
- 1.3 By End User
- 1.3.1 Municipal (Residential, Commercial)
- 1.3.2 Industrial (Oil and Gas, Food and Beverages, Chemical, Others)
- 1.4 By Operating Platform
- 1.4.1 Fixed Systems
- 1.4.2 Portable Systems
Chapter 2 Introduction
- 2.1 Report Objectives and Scope
- 2.2 Product Definition and Industry Terminology
- 2.3 Market Inclusions and Exclusions
- 2.4 Research Process
- 2.4.1 Primary Research and Expert Interviews
- 2.4.2 Secondary Research and Source Review
- 2.4.3 Top-Down and Bottom-Up Estimation
- 2.4.4 Data Triangulation and Verification
- 2.5 Market Size Measurement Basis
- 2.5.1 2018: USD 46,212.6 million → 2032: USD 94,189.1 million
- 2.6 Historical and Forecast Reference Periods
- 2.6.1 Base Year: 2018
- 2.6.2 Forecast Period: 2018-2032
- 2.7 Research Assumptions and Limitations
Chapter 3 Executive Summary
- 3.1 Market Snapshot and Key Findings
- 3.2 Base-Year Market Size, 2018
- 3.3 Forecast Market Size, 2032
- 3.4 Revenue and Volume Growth Outlook
- 3.5 Key Demand and Supply Indicators
- 3.6 Leading Market Segments
- 3.7 Fastest-Growing Market Opportunities
- 3.8 Regional Performance Highlights
- 3.9 Technology and Industry Transformation
- 3.10 Competitive Landscape Summary
- 3.11 Analyst View and Strategic Implications
Chapter 4 Global Water and Wastewater Treatment Equipment Market Trends and Developments
- 4.1 Historical Industry Development
- 4.2 Recent Market Trends and Developments
- 4.3 Demand and Customer Behavior Trends
- 4.4 Technology and Product Innovation
- 4.5 Artificial Intelligence, Automation and Digitalization
- 4.6 Local Manufacturing and Supply Chain Realignment
- 4.7 Industry Partnerships, Mergers and Acquisitions
- 4.8 Sustainability and Circular Economy Developments
- 4.9 Government and Private Sector Investment Trends
- 4.10 Emerging Business Models and Commercialization
- 4.11 Industry Developments and Announcements
Chapter 5 Global Water and Wastewater Treatment Equipment Market Production, Supply and Demand Analysis
- 5.1 Demand Trend and Consumption Analysis
- 5.2 Demand Forecast, 2018-2032
- 5.3 Production and Output Trend
- 5.4 Production and Output Forecast, 2018-2032
- 5.5 Installed Capacity and Capacity Utilization
- 5.6 Company-Wise Production Plants and Statistics
- 5.6.1 Installed Production Capacity
- 5.6.2 Actual Production
- 5.6.3 Planned Capacity and Expansion Targets
- 5.7 Supply Chain Structure and Procurement Trends
- 5.8 Supply-Demand Gap and Bottlenecks
- 5.9 Import Dependence and Sourcing Structure
- 5.10 Contract Manufacturing and Outsourcing
- 5.11 Regional Supply and Demand Concentration
Chapter 6 Global Water and Wastewater Treatment Equipment Market Pricing Analysis
- 6.1 Pricing Structure and Measurement
- 6.2 Historical Pricing Trends
- 6.3 Pricing Outlook, 2018-2032
- 6.4 Average Selling Price and Unit Economics
- 6.5 Pricing by Product and Market Segment
- 6.6 Geographic Pricing Differences
- 6.7 Key Input, Energy, Labor and Logistics Costs
- 6.8 Contract Pricing and Purchasing Models
- 6.9 Pricing Sensitivity and Competitive Positioning
- 6.10 Price, Margin and Profitability Implications
Chapter 7 Global Water and Wastewater Treatment Equipment Market Dynamics
- 7.1 Market Growth Drivers
- 7.1.1 Demand-Side Drivers
- 7.1.2 Technology and Innovation Drivers
- 7.1.3 Infrastructure and Investment Drivers
- 7.1.4 Regulatory and Policy Drivers
- 7.2 Market Restraints
- 7.2.1 Cost and Affordability Constraints
- 7.2.2 Technology and Adoption Barriers
- 7.2.3 Supply Chain and Operational Constraints
- 7.3 Market Challenges
- 7.3.1 Competitive Pressure and Margin Erosion
- 7.3.2 Skills, Infrastructure and Implementation Gaps
- 7.4 Emerging Market Opportunities
- 7.5 Market Dynamics Impact and Time-Horizon Assessment
Chapter 8 Global Water and Wastewater Treatment Equipment Value Chain Analysis
- 8.1 Industry Value Chain Overview
- 8.2 Upstream Suppliers and Critical Inputs
- 8.3 Technology and Component Providers
- 8.4 Manufacturing or Service Delivery
- 8.5 Distribution, Channel Partners and Integrators
- 8.6 Downstream Applications and End Users
- 8.7 Value Addition and Profit Pools
- 8.8 Vertical Integration and Outsourcing
- 8.9 Supplier Concentration and Risk
- 8.10 Supply Chain Localization and Resilience
Chapter 9 Global Water and Wastewater Treatment Equipment Market Regulations and Policies
- 9.1 Relevant Laws, Standards and Compliance Frameworks
- 9.2 Product, Service, Safety and Quality Requirements
- 9.3 Government Policies, Incentives and Subsidies
- 9.4 Imports, Exports and Trade Barriers
- 9.5 Public Procurement and Local Content Requirements
- 9.6 Environmental and Sustainability Compliance
- 9.7 Upcoming Policy Changes and Market Implications
Chapter 10 Global Water and Wastewater Treatment Equipment Market Hotspots and Opportunities
- 10.1 Market Opportunity Mapping and Growth Hotspots
- 10.2 High-Growth Applications and Customer Groups
- 10.3 Underserved Markets and White-Space Opportunities
- 10.4 Emerging Technology and Product Opportunities
- 10.5 New Capacity and Investment Hotspots
- 10.6 Market Entry and Expansion Opportunities
- 10.7 Distribution and Partnership Opportunities
- 10.8 Near-Term and Long-Term Commercial Potential
- 10.9 Opportunity Attractiveness and Execution Risks
Chapter 11 Global Water and Wastewater Treatment Equipment Market Outlook, 2018-2032
- 11.1 Market Size and Analysis
- 11.1.1 Revenue (Market Measurement: 2018: USD 46,212.6 million → 2032: USD 94,189.1 million)
- 11.1.2 Market Volume and Quantity Sold
- 11.1.3 Historical Market Size
- 11.1.4 Base-Year Market Size, 2018
- 11.2 Market Forecast, 2018-2032
- 11.2.1 Revenue Forecast to 2032
- 11.2.2 Volume Forecast to 2032
- 11.2.3 CAGR and Year-on-Year Growth
- 11.2.4 Incremental Revenue Opportunity
- 11.3 Forecast Assumptions and Scenario Analysis
- 11.3.1 Base-Case Forecast
- 11.3.2 Optimistic and Conservative Scenarios
- 11.3.3 Technology, Pricing and Policy Sensitivities
- 11.4 Market Attractiveness and Growth Outlook
Chapter 12 Global Water and Wastewater Treatment Equipment Market Segmentation and Outlook
- 12.1 Segmentation Summary and Market Shares, 2018
- 12.2 Largest and Fastest-Growing Segments
- 12.3 By Product - Market Size and Forecast, 2018-2032
- 12.3.1 Segment Definition and Scope
- 12.3.2 Historical Market Size
- 12.3.3 Revenue Forecast, 2018-2032
- 12.3.4 Volume Forecast, 2018-2032
- 12.3.5 Base-Year Market Share, 2018
- 12.3.6 Segment CAGR and Growth Drivers
- 12.3.7 Subsegment Market Size and Forecast
- 12.3.7.1 Filtration
- 12.3.7.2 Disinfection
- 12.3.7.3 Desalination
- 12.3.7.4 Sludge Treatment
- 12.3.7.5 Biological
- 12.3.7.6 Others
- 12.3.8 Subsegment Pricing and Adoption Trends
- 12.3.9 Leading Suppliers and Competition
- 12.3.10 Regional Demand and Opportunities
- 12.4 By End User - Market Size and Forecast, 2018-2032
- 12.4.1 Segment Definition and Scope
- 12.4.2 Historical Market Size
- 12.4.3 Revenue Forecast, 2018-2032
- 12.4.4 Volume Forecast, 2018-2032
- 12.4.5 Base-Year Market Share, 2018
- 12.4.6 Segment CAGR and Growth Drivers
- 12.4.7 Subsegment Market Size and Forecast
- 12.4.7.1 Municipal (Residential, Commercial)
- 12.4.7.2 Industrial (Oil and Gas, Food and Beverages, Chemical, Others)
- 12.4.8 Subsegment Pricing and Adoption Trends
- 12.4.9 Leading Suppliers and Competition
- 12.4.10 Regional Demand and Opportunities
- 12.5 By Operating Platform - Market Size and Forecast, 2018-2032
- 12.5.1 Segment Definition and Scope
- 12.5.2 Historical Market Size
- 12.5.3 Revenue Forecast, 2018-2032
- 12.5.4 Volume Forecast, 2018-2032
- 12.5.5 Base-Year Market Share, 2018
- 12.5.6 Segment CAGR and Growth Drivers
- 12.5.7 Subsegment Market Size and Forecast
- 12.5.7.1 Fixed Systems
- 12.5.7.2 Portable Systems
- 12.5.8 Subsegment Pricing and Adoption Trends
- 12.5.9 Leading Suppliers and Competition
- 12.5.10 Regional Demand and Opportunities
- 12.6 Segment Growth Comparison
- 12.7 Segment Attractiveness and Priority Matrix
Chapter 13 Global Water and Wastewater Treatment Equipment End-Use and Application Market Outlook
- 13.1 End-Use Industry and Customer Demand Structure
- 13.2 Leading Applications and Customer Groups
- 13.3 End-Use Market Size, Share and Forecast
- 13.4 Major End-Use Industry Deep Dives
- 13.4.1 Customer Requirements and Use Cases
- 13.4.2 Demand and Replacement Cycles
- 13.4.3 Technical and Regulatory Considerations
- 13.4.4 Purchasing and Procurement Models
- 13.4.5 Leading Vendors and Distribution Channels
- 13.4.6 Forecast and Commercial Opportunities
- 13.5 Emerging Applications and Cross-Segment Demand
- 13.6 End-Use Industry Investment Priorities
Chapter 14 Global Water and Wastewater Treatment Equipment Geographic Market Outlook, 2018-2032
- 14.1 Regional Market Size and Share, 2018
- 14.2 Regional Market Forecast, 2018-2032
- 14.3 Regional Pricing, Production and Demand Differences
- 14.4 North America
- 14.4.1 United States
- 14.4.2 Canada
- 14.4.3 Mexico
- 14.5 Europe
- 14.5.1 Germany
- 14.5.2 France
- 14.5.3 Italy
- 14.5.4 United Kingdom
- 14.5.5 Spain
- 14.5.6 Poland
- 14.5.7 Russia
- 14.5.8 Netherlands
- 14.5.9 Belgium
- 14.5.10 Sweden
- 14.5.11 Denmark
- 14.5.12 Norway
- 14.5.13 Rest of Europe
- 14.6 Asia Pacific
- 14.6.1 China
- 14.6.2 India
- 14.6.3 Japan
- 14.6.4 South Korea
- 14.6.5 Thailand
- 14.6.6 Indonesia
- 14.6.7 Vietnam
- 14.6.8 Malaysia
- 14.6.9 Australia
- 14.6.10 Rest of Asia Pacific
- 14.7 Latin America
- 14.7.1 Brazil
- 14.7.2 Argentina
- 14.7.3 Colombia
- 14.7.4 Chile
- 14.7.5 Rest of Latin America
- 14.8 Middle East
- 14.8.1 Saudi Arabia
- 14.8.2 United Arab Emirates
- 14.8.3 Turkey
- 14.8.4 Israel
- 14.8.5 Iran
- 14.8.6 Rest of the Middle East
- 14.9 Africa
- 14.9.1 South Africa
- 14.9.2 Egypt
- 14.9.3 Nigeria
- 14.9.4 Morocco
- 14.9.5 Rest of Africa
- 14.10 Regional Investment, Policy and Supply Chain Differences
- 14.11 Regional Competitive Landscape
- 14.12 Geographic Growth Hotspots
Chapter 15 Global Water and Wastewater Treatment Equipment Technology, Innovation and Sustainability Outlook
- 15.1 Technology Landscape and Maturity
- 15.2 Product, Process and Service Innovation
- 15.3 AI, Automation and Digital Tools in the Industry
- 15.4 Technology Adoption and Performance Benchmarking
- 15.5 Innovation Pipeline and R&D Investment
- 15.6 Patent and Intellectual Property Trends
- 15.7 Energy Efficiency and Resource Management
- 15.8 Sustainability, Recycling and Circularity
- 15.9 Technology Roadmap, 2018-2032
- 15.10 Risks of Obsolescence and Technology Substitution
Chapter 16 Global Water and Wastewater Treatment Equipment Market Key Strategic Imperatives
- 16.1 Growth and Market Entry Priorities
- 16.2 High-Return Products and Segments
- 16.3 Pricing, Profitability and Cost Optimization
- 16.4 Technology Investment and Product Differentiation
- 16.5 Supply Chain Localization and Resilience
- 16.6 Distribution and Customer Acquisition
- 16.7 Partnership, Acquisition and Capacity Strategy
- 16.8 Regional Expansion Priorities
- 16.9 Short-, Medium- and Long-Term Actions
Chapter 17 Competition Outlook
- 17.1 Industry Competition Characteristics
- 17.2 Market Structure and Concentration
- 17.3 Market Share and Competitive Positioning, 2018
- 17.4 Company-Wise Revenue and Product Benchmarking
- 17.5 Production and Service Capacity Benchmarking
- 17.6 Technology, Pricing and Differentiation
- 17.7 Regional Footprint and Distribution Strength
- 17.8 Mergers, Acquisitions and Strategic Alliances
- 17.9 New Entrants and Competitive Threats
- 17.10 Porter's Five Forces and Industry Attractiveness
- 17.11 Competitive Outlook, 2018-2032
Chapter 18 Company Profiles
- 18.1 Company Coverage and Selection Criteria
- 18.2 Veolia Water Technologies
- 18.2.1 Business Description
- 18.2.2 Company Ownership and Geographic Presence
- 18.2.3 Product and Service Portfolio
- 18.2.4 Manufacturing and Operating Footprint
- 18.2.5 Production Capacity and Expansion Plans
- 18.2.6 Financial Performance and Investment
- 18.2.7 Market Share and Competitive Position
- 18.2.8 Technology and Innovation Capabilities
- 18.2.9 Strategic Alliances or Partnerships
- 18.2.10 Recent Developments
- 18.2.11 Growth Strategy and Outlook
- 18.3 Xylem Inc.
- 18.4 Aquatech International Corporation
- 18.5 Fluence Corporation Limited
- 18.6 Kemira Oyj
- 18.7 Calgon Carbon Corporation
- 18.8 Napier Reid Ltd.
- 18.9 WPL Limited
- 18.10 Corix Water System
- 18.11 Suez Water Technologies & Solutions
- 18.12 Other Relevant Market Participants
Note: Every listed company is profiled on the structure shown under the first company. The company list is preliminary and may change based on research findings, market developments, data availability and client requirements.
Chapter 19 Disclaimer
- 19.1 Research and Forecast Disclaimer
- 19.2 Data Source and Estimation Limitations
Note: The depth of individual sections depends on data availability for this market. Volume, capacity, trade and other unit-based metrics are included where applicable.

