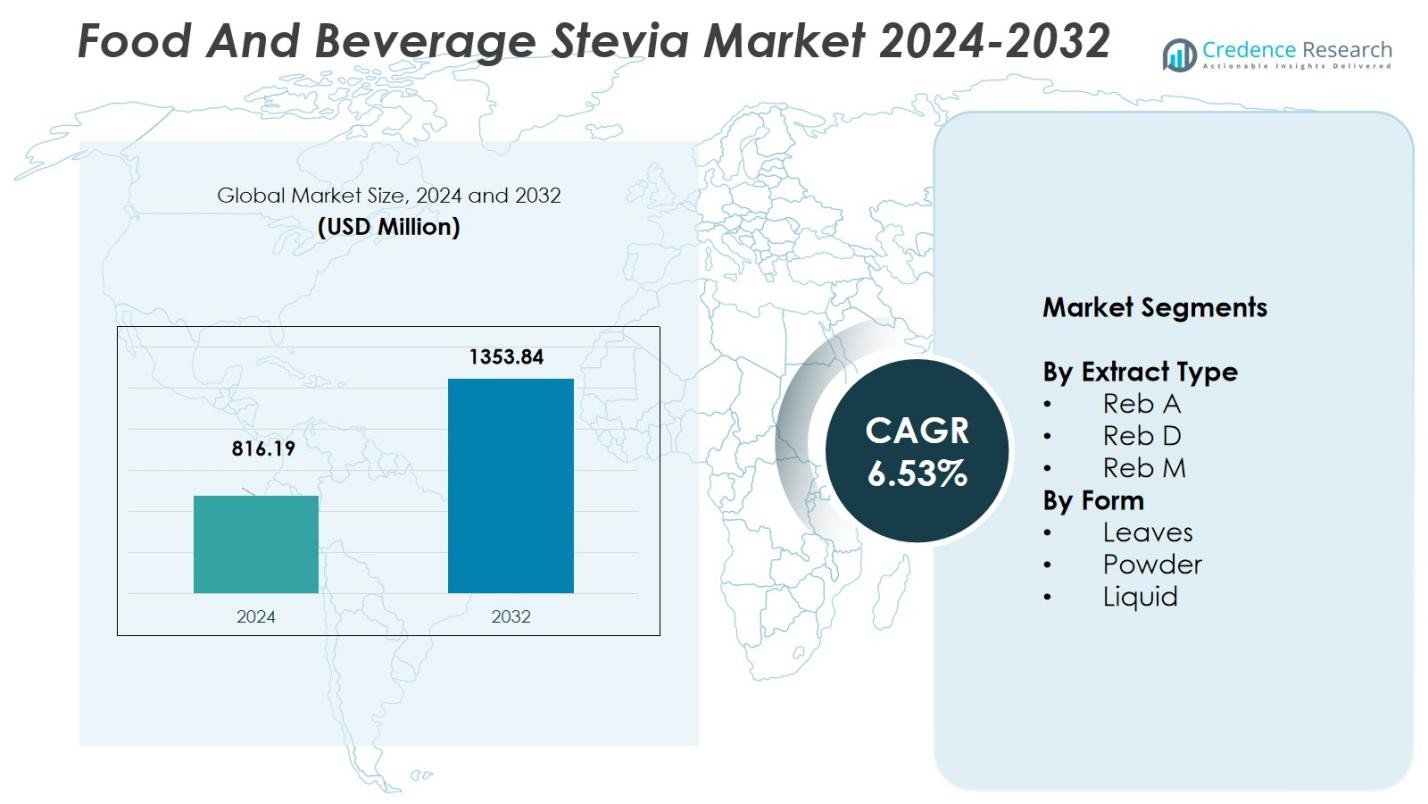
Home » Food & Beverage » Food & Beverage Stevia Market

Food & Beverage Stevia Market By Price (Range, Low, Medium, High)-Growth, Future Prospects & Competitive Analysis, 2016 – 2030

Price: $4999

Published: | Report ID: 5490 | Report Format : PDF

Market Insights

  • The Food & Beverage Stevia marketplace has been experiencing a sizeable increase in recent years.
  • Stevia, derived from the plant Stevia rebaudiana, is a natural, low-calorie sweetener gaining recognition as an alternative to synthetic sweeteners and sugar.
  • Its use within the food and beverage industry has been driven by increasing consumer demand for healthy, natural, and low-calorie products.
  • Stevia gives several benefits, including its ability to enhance taste, improve the dietary profile of products, and assist in reducing the risk of obesity and diabetes.

Food & Beverage Stevia Market

Executive Summary

Market Definition

The international Food & Beverage Stevia marketplace is witnessing significant growth because of various factors, including the increasing call for natural and low-calorie sweeteners, rising fitness awareness among consumers, regulatory support, and the increasing meals and beverage industry.

However, the marketplace also faces challenges: flavor and taste limitations, price issues, and competition from artificial sweeteners. Despite those barriers, there are sufficient opportunities for growth, including product improvements, growing use of natural and organic products, marketplace penetration in emerging economies, and partnerships and collaborations.

Market Overview

The international Food & Beverage Stevia market is expected to grow strong throughout the forecast period. In 2022, the marketplace revenue became USD 375.89 million, projected to attain USD 652.17 million by 2030, growing at a CAGR of 7.13%.

Asia Pacific is the most important Food & Beverage Stevia marketplace, accounting for a vast percentage of the global market. The region’s dominance may be attributed to the increasing client awareness regarding the damaging effects of synthetic sweeteners and the growing desire for natural and healthier options.

Key Highlights of the Report

The international Food & Beverage Stevia marketplace is predicted to attain USD 652.17 million through 2030, growing at a CAGR of 7.13% from 2023 to 2030. Asia Pacific is the most important Food & Beverage Stevia market, driven by growing customer demand for natural and low-calorie sweeteners within the region.

The beverage segment holds over 25% marketplace percentage, indicating the massive adoption of Food & Beverage Stevia in the beverage industry. The whole leaf segment dominates the market, reflecting clients’ preference for minimally processed and natural sweeteners.

What Are the Main Drivers of the Food & Beverage Stevia Market?

Growing demand for natural and low-calorie sweeteners, rising health consciousness, regulatory support, growing diabetic population, and expansion of the food and beverage industry.

What Are The Major Challenges Faced By the Food & Beverage Stevia Market?

Taste and flavor limitations, cost concerns, and competition from artificial sweeteners.

What Are The Growth Opportunities In the Food & Beverage Stevia Market?

Product innovations, increasing use of natural and organic products, market penetration in emerging economics, and partnerships and collaborations.

Design Element 2

Access crucial information at unmatched prices!

Request your free sample report today & start making informed decisions powered by Credence Research!

Download Free Sample
CTA Design Element 3

Growing Demand for Natural and Low-Calorie Sweeteners

The growing customer demand for organic and low-calorie sweeteners is a key driver of the Food & Beverage Stevia market. As consumers emerge as more health-conscious and searching for healthier food options, they’re turning far away from artificial sweeteners and sugar, leading to a rise in demand for Stevia as a natural and healthier option.

Rising Health Consciousness

The growing focus about the unfavorable effects of excessive sugar intake on health has led consumers to adopt healthier lifestyles. Stevia gives a low-calorie, natural sweetening solution that allows consumers to enjoy the sweetness without compromising their health goals, driving its demand in the food and beverage industry.

Regulatory Support

Governments and regulatory bodies throughout the globe are increasingly recognizing Stevia as a safe and natural sweetener. Many countries have authorized the use of Stevia in meals and beverage merchandise, main to its widespread adoption with the aid of producers. Regulatory assistance has played a vital position in boosting the growth of the Food & Beverage Stevia marketplace.

Growing Diabetic Population

The rising incidence of diabetes internationally has created a demand for healthier options for sugar. Stevia has gained a reputation amongst diabetic individuals as it no longer affects blood sugar ranges, making it a suitable choice for managing diabetes while still enjoying sweetened products.

Food & Beverage Stevia Market

Expansion of Food and Beverage Industry

The continuous expansion of the food and beverage industry offers enormous possibilities for the Food & Beverage Stevia marketplace growth. Stevia is extensively used in numerous applications, including liquids, dairy merchandise, confectionery, bakery, and snacks, among others, to fulfill the increasing customer demand for healthier, low-calorie alternatives.

Taste and Flavor Limitations

Despite its many advantages, Stevia may have taste and taste limitations, particularly in contrast to sugar. Some purchasers discover Stevia to have a slightly sour aftertaste, affecting their average perception and attractiveness of Stevia-sweetened merchandise. Overcoming the taste and taste barrier is a challenge the industry needs to overcome to drive wider adoption of Stevia.

Cost Concerns

Stevia is often priced higher than artificial sweeteners and sugar, making it extraordinarily highly priced for manufacturers. The higher cost of Stevia can deter a few food and beverage corporations from using it as a sweetening factor, mainly in price-sensitive markets. Cost reduction techniques and technological advancements are vital to make Stevia more cost-competitive.

Competition from Artificial Sweeteners

Stevia faces competition from synthetic sweeteners and aspartame, sucralose, and saccharin, which have been extensively used in the food and beverage industry for decades. Artificial sweeteners are often inexpensive and might intently mimic the taste of sugar, making them appealing options for producers. Stevia must differentiate itself by emphasizing its natural beginning and health benefits to compete efficiently.

Product Innovations

Continuous product improvements, including the development of recent Stevia-based sweeteners and blends, can increase the application possibilities of Stevia within the food and beverage industry. Improving Stevia-based total sweeteners’ flavor profile, solubility, and flexibility will allow producers to create a wider variety of Stevia-sweetened products catering to different consumer preferences.

Increasing Use of Natural and Organic Products

The growing demand for organic and natural food and beverage products affords a big opportunity for Stevia. As customers are looking for clean-label products, producers are incorporating Stevia to update synthetic sweeteners and enhance the natural appeal of their offerings. Expanding the use of Stevia in natural and organic products can drive marketplace growth.

Market Penetration in Emerging Economies

The Food & Beverage Stevia marketplace has immense potential for growth in emerging economies in which customer awareness regarding natural and low-calorie sweeteners is increasing. Market players can focus on expanding their presence in these markets through strategic partnerships, local manufacturing facilities, and targeted marketing campaigns.

Partnerships and Collaborations

Collaborations among Stevia producers, food and beverage companies, and research institutions can facilitate the development of new Stevia-based products and solutions. Partnerships can leverage the strengths and knowledge of various stakeholders to drive innovation, overcome challenges, and boost market growth.

Key Players

The food and beverage Stevia market is highly competitive, with several key players. Some of the major players in the market and their market share are as follows:

  • PureCircle Ltd
  • Cargill, Incorporated
  • Ingredion Incorporated
  • Tate & Lyle PLC
  • SweeGen Inc.
  • Archer Daniels Midland Company (ADM)
  • GLG Life Tech Corporation

These key players operate globally and feature large distribution networks, letting them serve clients in distinct regions successfully. Apart from those key players, the food and beverage stevia market accommodates several regional and local businesses catering to unique markets or niche applications.

Shape Your Report to Specific Countries or Regions & Enjoy 30% Off!


Ongoing research and development activities, strategic partnerships, and investments in production capability expansion signify the competitive landscape of the food and beverage stevia marketplace. Market players are focused on flavor optimization, modern product improvement, and strengthening their delivery chains to gain a competitive advantage in the industry.

Summary of Key Findings

  • The international Food & Beverage Stevia marketplace is predicted to attain USD 652.17 million through 2030, growing at a CAGR of 7.13% from 2023 to 2030.
  • Asia Pacific is the most important Food & Beverage Stevia market, driven by growing customer demand for natural and low-calorie sweeteners within the region.
  • The beverage segment holds over 25% marketplace percentage, indicating the massive adoption of Food & Beverage Stevia in the beverage industry.
  • The whole leaf segment dominates the market, reflecting clients’ preference for minimally processed and natural sweeteners.

Segmentation

  • By Price Range
    • Low
    • Medium
    • High
  • By Region
    • North America
      • USA
      • Canada
      • Mexico
    • Europe
      • Germany
      • France
      • U.K.
      • Italy
      • Spain
      • Rest of Europe
    • Asia Pacific
      • China
      • Japan
      • India
      • South Korea
      • South-east Asia
      • Rest of Asia Pacific
    • Latin America
      • Brazil
      • Argentina
      • Rest of Latin America
    • Middle East & Africa
      • GCC Countries
      • South Africa
      • Rest of the Middle East and Africa 

CHAPTER NO. 1 : INTRODUCTION 15
1.1. Report Description 15
1.1.1. Purpose of the Report 15
1.1.2. USP & Key Offerings 15
1.2. Key Benefits for Stakeholders 15
1.3. Target Audience 16
1.4. Report Scope 16

CHAPTER NO. 2 : EXECUTIVE SUMMARY 19
2.1. Food & Beverage Stevia Market Snapshot 19
2.2. Global Food & Beverage Stevia Market, 2017 – 2030 (Kilo Tons) (USD Million) 21
2.1. Insights from Primary Respondents 21

CHAPTER NO. 3 : COVID 19 IMPACT ANALYSIS 22
3.1. Impact Assessment of COVID-19 Pandemic, By Region 22

CHAPTER NO. 4 : FOOD & BEVERAGE STEVIA MARKET – INDUSTRY ANALYSIS 23
4.1. Introduction 23
4.2. Market Drivers 24
4.2.1. Growing Demand for Natural and Low-Calorie Sweeteners 24
4.2.2. Rising Health Consciousness 25
4.3. Market Restraints 25
4.3.1. Restraining Factor Analysis 25
4.4. Market Opportunities 26
4.4.1. Market Opportunity Analysis 26
4.5. Porter’s Five Forces Analysis 26
4.6. Value Chain Analysis 27

CHAPTER NO. 5 : KEY INVESTMENT POCKETS ANALYSIS 28
5.1. Top Investment Pockets 28
5.1.1.1. Food & Beverage Stevia Market Attractiveness Analysis, By Type 28
5.1.1.2. Food & Beverage Stevia Market Attractiveness Analysis, By Application 28
5.2. Product Life Cycle Analysis 29
5.3. Incremental Revenue Growth Opportunity, 2023 – 2030 30
5.3.1. Type 30
5.3.2. Application 30

CHAPTER NO. 6 : IMPORT EXPORT ANALYSIS 31
6.1. Import Analysis by Region 31
6.1.1. Global Food & Beverage Stevia Market Import Volume, By Region, 2017 – 2022 (Kilo Tons) 31
6.2. Export Analysis by Region 31
6.2.1. Global Food & Beverage Stevia Market Export Volume, By Region, 2017 – 2022 (Kilo Tons) 31

CHAPTER NO. 7 : DEMAND SUPPLY ANALYSIS 32
7.1. Demand Analysis by Region 32
7.1.1. Global Food & Beverage Stevia Market Demand Volume, By Region, 2017 – 2022 (Kilo Tons) 32
7.2. Supply Analysis by Region 32
7.2.1. Global Food & Beverage Stevia Market Supply Volume, By Region, 2017 – 2022 (Kilo Tons) 32

CHAPTER NO. 8 : MARKET POSITIONING OF KEY PLAYERS 33
8.1. Company Market Share Analysis –2020 and 2022 33
8.1.1. Global Food & Beverage Stevia Market: Company Market Share, 2022 33
8.1.2. Global Food & Beverage Stevia Market: Company Market Share, 2022 33
8.1. Global Food & Beverage Stevia Market Company Volume Market Share, 2022 34
8.2. Global Food & Beverage Stevia Market Company Revenue Market Share, 2022 35
8.3. Market Position of Key Players 2022 36
8.3.1. Market Position of Key Players, 2022 36
8.4. Strategic Developments 37
8.4.1. Acquisitions & Mergers 37
8.4.2. New Product Launch 37
8.4.3. Regional Expansion 37

CHAPTER NO. 9 : FOOD & BEVERAGE STEVIA MARKET – BY TYPE SEGMENT ANALYSIS 38
9.1. Food & Beverage Stevia Market Overview, by Type Segment 38
9.1.1. Global Food & Beverage Stevia Market Volume Share, By Type, 2022 & 2030 39
9.1.2. Global Food & Beverage Stevia Market Revenue Share, By Type, 2022 & 2030 39
9.2. Whole leaf 40
9.2.1. Global Whole leaf Food & Beverage Stevia Market Volume, By Region, 2017 – 2022 (Kilo Tons) 40
9.2.2. Global Whole leaf Food & Beverage Stevia Market Revenue, By Region, 2017 – 2022 (USD Million) 41
9.3. Liquid Stevia 42
9.3.1. Global Liquid Stevia Food & Beverage Stevia Market Volume, By Region, 2017 – 2022 (Kilo Tons) 42
9.3.2. Global Whole leaf Food & Beverage Stevia Market Revenue, By Region, 2017 – 2022 (USD Million) 43
9.4. Powdered Stevia 44
9.4.1. Global Powdered Stevia Food & Beverage Stevia Market Volume, By Region, 2017 – 2022 (Kilo Tons) 44
9.4.2. Global Powdered Stevia Food & Beverage Stevia Market Revenue, By Region, 2017 – 2022 (USD Million) 45
9.5. Stevia Blends 46
9.5.1. Global Stevia Blends Food & Beverage Stevia Market Volume, By Region, 2017 – 2022 (Kilo Tons) 46
9.5.2. Global Stevia Blends Food & Beverage Stevia Market Revenue, By Region, 2017 – 2022 (USD Million) 47
9.6. Others 48
9.6.1. Global Others Food & Beverage Stevia Market Volume, By Region, 2017 – 2022 (Kilo Tons) 48
9.6.2. Global Others Food & Beverage Stevia Market Revenue, By Region, 2017 – 2022 (USD Million) 49

CHAPTER NO. 10 : FOOD & BEVERAGE STEVIA MARKET – BY APPLICATION SEGMENT ANALYSIS 50
10.1. Food & Beverage Stevia Market Overview, by Application Segment 50
10.1.1. Global Food & Beverage Stevia Market Volume Share, By Application, 2022 & 2030 51
10.1.2. Global Food & Beverage Stevia Market Revenue Share, By Application, 2022 & 2030 51
10.2. Beverages 52
10.2.1. Global Food & Beverage Stevia for Beverages Market Volume, By Region, 2017 – 2022 (Kilo Tons) 52
10.2.2. Global Food & Beverage Stevia for Beverages Market Revenue, By Region, 2017 – 2022 (USD Million) 53
10.3. Bakery and Confectionery 54
10.3.1. Global Food & Beverage Stevia for Bakery and Confectionery Market Volume, By Region, 2017 – 2022 (Kilo Tons) 54
10.3.2. Global Food & Beverage Stevia for Bakery and Confectionery Market Revenue, By Region, 2017 – 2022 (USD Million) 55
10.4. Dairy Products 56
10.4.1. Global Food & Beverage Stevia for Dairy Products Market Volume, By Region, 2017 – 2022 (Kilo Tons) 56
10.4.2. Global Food & Beverage Stevia for Dairy Products Market Revenue, By Region, 2017 – 2022 (USD Million) 57
10.5. Snacks and Sweets 58
10.5.1. Global Food & Beverage Stevia for Snacks and Sweets Market Volume, By Region, 2017 – 2022 (Kilo Tons) 58
10.5.2. Global Food & Beverage Stevia for Snacks and Sweets Market Revenue, By Region, 2017 – 2022 (USD Million) 59
10.6. Dietary Supplements & Others 60
10.6.1. Global Food & Beverage Stevia for Dietary Supplements & Others Market Volume, By Region, 2017 – 2022 (Kilo Tons) 60
10.6.2. Global Food & Beverage Stevia for Dietary Supplements & Others Market Revenue, By Region, 2017 – 2022 (USD Million) 61

CHAPTER NO. 11 : FOOD & BEVERAGE STEVIA MARKET – REGIONAL ANALYSIS 62
11.1. Food & Beverage Stevia Market Overview, by Region Segment 62
11.1.1. Global Food & Beverage Stevia Market Volume Share, By Region, 2022 & 2030 63
11.1.2. Global Food & Beverage Stevia Market Revenue Share, By Region, 2022 & 2030 63
11.1.3. Global Food & Beverage Stevia Market Volume, By Region, 2017 – 2022 (Kilo Tons) 64
11.1.4. Global Food & Beverage Stevia Market Revenue, By Region, 2017 – 2022 (USD Million) 65
11.1.5. Global Food & Beverage Stevia Market Volume, By Type, 2017 – 2022 (Kilo Tons) 66
11.1.6. Global Food & Beverage Stevia Market Revenue, By Type, 2017 – 2022 (USD Million) 67
11.1.7. Global Food & Beverage Stevia Market Volume, By Application, 2017 – 2022 (Kilo Tons) 68
11.1.8. Global Food & Beverage Stevia Market Revenue, By Application, 2017 – 2022 (USD Million) 69
11.2. North America 70
11.2.1. North America Food & Beverage Stevia Market Volume, By Country, 2017 – 2022 (Kilo Tons) 71
11.2.2. North America Food & Beverage Stevia Market Revenue, By Country, 2017 – 2022 (USD Million) 71
11.2.2.1. North America Food & Beverage Stevia Market Volume, By Type, 2017 – 2022 (Kilo Tons) 72
11.2.3. North America Food & Beverage Stevia Market Revenue, By Type, 2017 – 2022 (USD Million) 73
11.2.4. North America Food & Beverage Stevia Market Volume, By Application, 2017 – 2022 (Kilo Tons) 74
11.2.5. North America Food & Beverage Stevia Market Revenue, By Application, 2017 – 2022 (USD Million) 75
11.2.6. U.S. 76
11.2.7. Canada 76
11.2.8. Mexico 76
11.3. Europe 77
11.3.1. Europe Food & Beverage Stevia Market Volume, By Country, 2017 – 2022 (Kilo Tons) 78
11.3.2. Europe Food & Beverage Stevia Market Revenue, By Country, 2017 – 2022 (USD Million) 79
11.3.3. Europe Food & Beverage Stevia Market Volume, By Type, 2017 – 2022 (Kilo Tons) 80
11.3.4. Europe Food & Beverage Stevia Market Revenue, By Type, 2017 – 2022 (USD Million) 81
11.3.5. Europe Food & Beverage Stevia Market Volume, By Application, 2017 – 2022 (Kilo Tons) 82
11.3.6. Europe Food & Beverage Stevia Market Revenue, By Application, 2017 – 2022 (USD Million) 83
11.3.7. UK 84
11.3.8. France 84
11.3.9. Germany 84
11.3.10. Italy 84
11.3.11. Spain 84
11.3.12. Russia 84
11.3.13. BENELUX 84
11.3.14. Sweden 84
11.3.15. Denmark 84
11.3.16. Poland 84
11.3.17. Austria 84
11.3.18. Rest of Europe 84
11.4. Asia Pacific 85
11.4.1. Asia Pacific Food & Beverage Stevia Market Volume, By Country, 2017 – 2022 (Kilo Tons) 86
11.4.2. Asia Pacific Food & Beverage Stevia Market Revenue, By Country, 2017 – 2022 (USD Million) 87
11.4.3. Asia Pacific Food & Beverage Stevia Market Volume, By Type, 2017 – 2022 (Kilo Tons) 88
11.4.4. Asia Pacific Food & Beverage Stevia Market Revenue, By Type, 2017 – 2022 (USD Million) 89
11.4.5. Asia Pacific Food & Beverage Stevia Market Volume, By Application, 2017 – 2022 (Kilo Tons) 90
11.4.6. Asia Pacific Food & Beverage Stevia Market Revenue, By Application, 2017 – 2022 (USD Million) 91
11.4.7. China 92
11.4.8. Japan 92
11.4.9. South Korea 92
11.4.10. India 92
11.4.11. Thailand 92
11.4.12. Indonesia 92
11.4.13. Vietnam 92
11.4.14. Malaysia 92
11.4.15. Philippines 92
11.4.16. Taiwan 92
11.4.17. Rest of Asia Pacific 92
11.5. Latin America 93
11.5.1. Latin America Food & Beverage Stevia Market Volume, By Country, 2017 – 2022 (Kilo Tons) 94
11.5.2. Latin America Food & Beverage Stevia Market Revenue, By Country, 2017 – 2022 (USD Million) 95
11.5.3. Latin America Food & Beverage Stevia Market Volume, By Type, 2017 – 2022 (Kilo Tons) 96
11.5.4. Latin America Food & Beverage Stevia Market Revenue, By Type, 2017 – 2022 (USD Million) 97
11.5.5. Latin America Food & Beverage Stevia Market Volume, By Application, 2017 – 2022 (Kilo Tons) 98
11.5.6. Latin America Food & Beverage Stevia Market Revenue, By Application, 2017 – 2022 (USD Million) 99
11.5.7. Brazil 100
11.5.8. Argentina 100
11.5.9. Colombia 100
11.5.10. Chile 100
11.5.11. Peru 100
11.5.12. Rest of Latin America 100
11.6. The Middle-East 101
11.6.1. Middle East Food & Beverage Stevia Market Volume, By Country, 2017 – 2022 (Kilo Tons) 102
11.6.2. Middle East Food & Beverage Stevia Market Revenue, By Country, 2017 – 2022 (USD Million) 103
11.6.3. Middle East Food & Beverage Stevia Market Volume, By Type, 2017 – 2022 (Kilo Tons) 104
11.6.4. Middle East Food & Beverage Stevia Market Revenue, By Type, 2017 – 2022 (USD Million) 105
11.6.5. Middle East Food & Beverage Stevia Market Volume, By Application, 2017 – 2022 (Kilo Tons) 106
11.6.6. Middle East Food & Beverage Stevia Market Revenue, By Application, 2017 – 2022 (USD Million) 107
11.6.7. GCC Countries 108
11.6.8. Israel 108
11.6.9. Turkey 108
11.6.10. Iran 108
11.6.11. Rest of Middle East & Africa 108
11.7. Africa 109
11.7.1. Africa Food & Beverage Stevia Market Volume, By Country, 2017 – 2022 (Kilo Tons) 110
11.7.2. Africa Food & Beverage Stevia Market Revenue, By Country, 2017 – 2022 (USD Million) 111
11.7.3. Africa Food & Beverage Stevia Market Volume, By Type, 2017 – 2022 (Kilo Tons) 112
11.7.4. Africa Food & Beverage Stevia Market Revenue, By Type, 2017 – 2022 (USD Million) 113
11.7.5. Africa Food & Beverage Stevia Market Volume, By Application, 2017 – 2022 (Kilo Tons) 114
11.7.6. Africa Food & Beverage Stevia Market Revenue, By Application, 2017 – 2022 (USD Million) 115
11.7.7. South Africa 116
11.7.8. Egypt 116
11.7.9. Nigeria 116
11.7.10. Algeria 116
11.7.11. Morocco 116
11.7.12. Rest of Africa 116

CHAPTER NO. 12 : COMPANY PROFILES 117
12.1. Cargill, Incorporated 117
12.1.1. Company Overview 117
12.1.2. Product Portfolio 117
12.1.3. Financial Overview 117
12.2. PureCircle Limited 118
12.3. Tate & Lyle PLC 118
12.4. Ingredion Incorporated 118
12.5. GLG Life Tech Corporation 118
12.6. PepsiCo, Inc. 118
12.7. The Coca-Cola Company 118
12.8. Archer Daniels Midland Company 118
12.9. Sunwin Stevia International, Inc. 118
12.10. Stevia Corp. 118
12.11. Stevita Co. 118
12.12. Morita Kagaku Kogyo Co., Ltd. 118
12.13. Zhucheng Haotian Pharm Co., Ltd. 118
12.14. Wisdom Natural Brands 118

CHAPTER NO. 13 : RESEARCH METHODOLOGY 119
13.1. Research Methodology 119
13.2. Phase I – Secondary Research 120
13.3. Phase II – Data Modeling 120
13.3.1. Company Share Analysis Model 121
13.3.2. Revenue Based Modeling 121
13.4. Phase III – Primary Research 122
13.5. Research Limitations 123
13.5.1. Assumptions 123

List of Figures
FIG NO. 1. Global Food & Beverage Stevia Market Volume & Revenue, 2017 – 2030 (Kilo Tons) (USD Million) 22
FIG NO. 2. Porter’s Five Forces Analysis for Global Food & Beverage Stevia Market 27
FIG NO. 3. Value Chain Analysis for Global Food & Beverage Stevia Market 28
FIG NO. 4. Market Attractiveness Analysis, By Type 29
FIG NO. 5. Market Attractiveness Analysis, By Application 29
FIG NO. 6. Product Life Cycle Analysis 30
FIG NO. 7. Incremental Revenue Growth Opportunity by Type 31
FIG NO. 8. Incremental Revenue Growth Opportunity by Application 31
FIG NO. 9. Company Share Analysis, 2020 34
FIG NO. 10. Company Share Analysis, 2022 34
FIG NO. 11. Food & Beverage Stevia Market – Company Volume Market Share, 2022 35
FIG NO. 12. Food & Beverage Stevia Market – Company Revenue Market Share, 2022 36
FIG NO. 13. Market Position of Key Players, 2022 37
FIG NO. 14. Global Food & Beverage Stevia Market Volume Share, By Type, 2022 & 2030 40
FIG NO. 15. Global Food & Beverage Stevia Market Revenue Share, By Type, 2022 & 2030 40
FIG NO. 16. Global Food & Beverage Stevia Market for Whole leaf, Volume & Revenue (Kilo Tons) (USD Million) 2017 – 2030 41
FIG NO. 17. Global Food & Beverage Stevia Market for Liquid Stevia, Volume & Revenue (Kilo Tons) (USD Million) 2017 – 2030 43
FIG NO. 18. Global Food & Beverage Stevia Market for Powdered Stevia, Volume & Revenue (Kilo Tons) (USD Million) 2017 – 2030 45
FIG NO. 19. Global Food & Beverage Stevia Market for Stevia Blends, Volume & Revenue (Kilo Tons) (USD Million) 2017 – 2030 47
FIG NO. 20. Global Food & Beverage Stevia Market for Others, Volume & Revenue (Kilo Tons) (USD Million) 2017 – 2030 49
FIG NO. 21. Global Food & Beverage Stevia Market Volume Share, By Application, 2022 & 2030 52
FIG NO. 22. Global Food & Beverage Stevia Market Revenue Share, By Application, 2022 & 2030 52
FIG NO. 23. Global Food & Beverage Stevia Market for Beverages, Volume & Revenue (Kilo Tons) (USD Million) 2017 – 2030 53
FIG NO. 24. Global Food & Beverage Stevia Market for Bakery and Confectionery, Volume & Revenue (Kilo Tons) (USD Million) 2017 – 2030 55
FIG NO. 25. Global Food & Beverage Stevia Market for Dairy Products, Volume & Revenue (Kilo Tons) (USD Million) 2017 – 2030 57
FIG NO. 26. Global Food & Beverage Stevia Market for Snacks and Sweets, Volume & Revenue (Kilo Tons) (USD Million) 2017 – 2030 59
FIG NO. 27. Global Food & Beverage Stevia Market for Dietary Supplements & Others, Volume & Revenue (Kilo Tons) (USD Million) 2017 – 2030 61
FIG NO. 28. Global Food & Beverage Stevia Market Volume Share, By Region, 2022 & 2030 64
FIG NO. 29. Global Food & Beverage Stevia Market Revenue Share, By Region, 2022 & 2030 64
FIG NO. 30. North America Food & Beverage Stevia Market Volume & Revenue, 2017 – 2022 (Kilo Tons) (USD Million) 71
FIG NO. 31. Europe Food & Beverage Stevia Market Volume & Revenue, 2017 – 2022 (Kilo Tons) (USD Million) 78
FIG NO. 32. Asia Pacific Food & Beverage Stevia Market Volume & Revenue, 2017 – 2022 (Kilo Tons) (USD Million) 86
FIG NO. 33. Latin America Food & Beverage Stevia Market Volume & Revenue, 2017 – 2022 (Kilo Tons) (USD Million) 94
FIG NO. 34. The Middle-East Food & Beverage Stevia Market Volume & Revenue, 2017 – 2022 (Kilo Tons) (USD Million) 102
FIG NO. 35. Africa Food & Beverage Stevia Market Volume & Revenue, 2017 – 2022 (Kilo Tons) (USD Million) 110
FIG NO. 36. Research Methodology – Detailed View 120
FIG NO. 37. Research Methodology 121

List of Tables
TABLE NO. 1. : Global Food & Beverage Stevia Market: Snapshot 20
TABLE NO. 2. : Drivers for the Food & Beverage Stevia Market: Impact Analysis 25
TABLE NO. 3. : Restraints for the Food & Beverage Stevia Market: Impact Analysis 26
TABLE NO. 4. : Global Food & Beverage Stevia Market Import Volume, By End-user, 2017 – 2022 (Kilo Tons) 32
TABLE NO. 5. : Global Food & Beverage Stevia Market Export Volume, By End-user, 2017 – 2022 (Kilo Tons) 32
TABLE NO. 6. : Global Food & Beverage Stevia Market Demand Volume, By End-user, 2017 – 2022 (Kilo Tons) 33
TABLE NO. 7. : Global Food & Beverage Stevia Market Supply Volume, By End-user, 2017 – 2022 (Kilo Tons) 33
TABLE NO. 8. : Global Whole leaf Food & Beverage Stevia Market Volume, By Region, 2017 – 2022 (Kilo Tons) 41
TABLE NO. 9. : Global Whole leaf Food & Beverage Stevia Market Volume, By Region, 2023– 2030 (Kilo Tons) 41
TABLE NO. 10. : Global Whole leaf Food & Beverage Stevia Market Revenue, By Region, 2017 – 2022 (USD Million) 42
TABLE NO. 11. : Global Whole leaf Food & Beverage Stevia Market Revenue, By Region, 2023– 2030 (USD Million) 42
TABLE NO. 12. : Global Liquid Stevia Food & Beverage Stevia Market Volume, By Region, 2017 – 2022 (Kilo Tons) 43
TABLE NO. 13. : Global Liquid Stevia Food & Beverage Stevia Market Volume, By Region, 2023– 2030 (Kilo Tons) 43
TABLE NO. 14. : Global Whole leaf Food & Beverage Stevia Market Revenue, By Region, 2017 – 2022 (USD Million) 44
TABLE NO. 15. : Global Whole leaf Food & Beverage Stevia Market Revenue, By Region, 2023– 2030 (USD Million) 44
TABLE NO. 16. : Global Powdered Stevia Food & Beverage Stevia Market Volume, By Region, 2017 – 2022 (Kilo Tons) 45
TABLE NO. 17. : Global Powdered Stevia Food & Beverage Stevia Market Volume, By Region, 2023– 2030 (Kilo Tons) 45
TABLE NO. 18. : Global Powdered Stevia Food & Beverage Stevia Market Revenue, By Region, 2017 – 2022 (USD Million) 46
TABLE NO. 19. : Global Powdered Stevia Food & Beverage Stevia Market Revenue, By Region, 2023– 2030 (USD Million) 46
TABLE NO. 20. : Global Stevia Blends Food & Beverage Stevia Market Revenue, By Region, 2017 – 2022 (USD Million) 47
TABLE NO. 21. : Global Stevia Blends Food & Beverage Stevia Market Volume, By Region, 2023– 2030 (Kilo Tons) 47
TABLE NO. 22. : Global Stevia Blends Food & Beverage Stevia Market Revenue, By Region, 2017 – 2022 (USD Million) 48
TABLE NO. 23. : Global Stevia Blends Food & Beverage Stevia Market Revenue, By Region, 2023– 2030 (USD Million) 48
TABLE NO. 24. : Global Others Food & Beverage Stevia Market Volume, By Region, 2017 – 2022 (Kilo Tons) 49
TABLE NO. 25. : Global Others Food & Beverage Stevia Market Volume, By Region, 2023– 2030 (Kilo Tons) 49
TABLE NO. 26. : Global Others Food & Beverage Stevia Market Revenue, By Region, 2017 – 2022 (USD Million) 50
TABLE NO. 27. : Global Others Food & Beverage Stevia Market Revenue, By Region, 2023– 2030 (USD Million) 50
TABLE NO. 28. : Global Food & Beverage Stevia for Beverages Market Volume, By Region, 2017 – 2022 (Kilo Tons) 53
TABLE NO. 29. : Global Food & Beverage Stevia for Beverages Market Volume, By Region, 2023– 2030 (Kilo Tons) 53
TABLE NO. 30. : Global Food & Beverage Stevia for Beverages Market Revenue, By Region, 2017 – 2022 (USD Million) 54
TABLE NO. 31. : Global Food & Beverage Stevia for Beverages Market Revenue, By Region, 2023– 2030 (USD Million) 54
TABLE NO. 32. : Global Food & Beverage Stevia for Bakery and Confectionery Market Volume, By Region, 2017 – 2022 (Kilo Tons) 55
TABLE NO. 33. : Global Food & Beverage Stevia for Bakery and Confectionery Market Volume, By Region, 2023– 2030 (Kilo Tons) 55
TABLE NO. 34. : Global Food & Beverage Stevia for Bakery and Confectionery Market Revenue, By Region, 2017 – 2022 (USD Million) 56
TABLE NO. 35. : Global Food & Beverage Stevia for Bakery and Confectionery Market Revenue, By Region, 2023– 2030 (USD Million) 56
TABLE NO. 36. : Global Food & Beverage Stevia for Dairy Products Market Volume, By Region, 2017 – 2022 (Kilo Tons) 57
TABLE NO. 37. : Global Food & Beverage Stevia for Dairy Products Market Volume, By Region, 2023– 2030 (Kilo Tons) 57
TABLE NO. 38. : Global Food & Beverage Stevia for Dairy Products Market Revenue, By Region, 2017 – 2022 (USD Million) 58
TABLE NO. 39. : Global Food & Beverage Stevia for Dairy Products Market Revenue, By Region, 2023– 2030 (USD Million) 58
TABLE NO. 40. : Global Food & Beverage Stevia for Snacks and Sweets Market Volume, By Region, 2017 – 2022 (Kilo Tons) 59
TABLE NO. 41. : Global Food & Beverage Stevia for Snacks and Sweets Market Volume, By Region, 2023– 2030 (Kilo Tons) 59
TABLE NO. 42. : Global Food & Beverage Stevia for Snacks and Sweets Market Revenue, By Region, 2017 – 2022 (USD Million) 60
TABLE NO. 43. : Global Food & Beverage Stevia for Snacks and Sweets Market Revenue, By Region, 2023– 2030 (USD Million) 60
TABLE NO. 44. : Global Food & Beverage Stevia for Dietary Supplements & Others Market Volume, By Region, 2017 – 2022 (Kilo Tons) 61
TABLE NO. 45. : Global Food & Beverage Stevia for Dietary Supplements & Others Market Volume, By Region, 2023– 2030 (Kilo Tons) 61
TABLE NO. 46. : Global Food & Beverage Stevia for Dietary Supplements & Others Market Revenue, By Region, 2017 – 2022 (USD Million) 62
TABLE NO. 47. : Global Food & Beverage Stevia for Dietary Supplements & Others Market Revenue, By Region, 2023– 2030 (USD Million) 62
TABLE NO. 48. : Global Food & Beverage Stevia Market Volume, By Region, 2017 – 2022 (Kilo Tons) 65
TABLE NO. 49. : Global Food & Beverage Stevia Market Volume, By Region, 2023– 2030 (Kilo Tons) 65
TABLE NO. 50. : Global Food & Beverage Stevia Market Revenue, By Region, 2017 – 2022 (USD Million) 66
TABLE NO. 51. : Global Food & Beverage Stevia Market Revenue, By Region, 2023– 2030 (USD Million) 66
TABLE NO. 52. : Global Food & Beverage Stevia Market Volume, By Type, 2017 – 2022 (Kilo Tons) 67
TABLE NO. 53. : Global Food & Beverage Stevia Market Volume, By Type, 2023– 2030 (Kilo Tons) 67
TABLE NO. 54. : Global Food & Beverage Stevia Market Revenue, By Type, 2017 – 2022 (USD Million) 68
TABLE NO. 55. : Global Food & Beverage Stevia Market Revenue, By Type, 2023– 2030 (USD Million) 68
TABLE NO. 56. : Global Food & Beverage Stevia Market Volume, By Application, 2017 – 2022 (Kilo Tons) 69
TABLE NO. 57. : Global Food & Beverage Stevia Market Volume, By Application, 2023– 2030 (Kilo Tons) 69
TABLE NO. 58. : Global Food & Beverage Stevia Market Revenue, By Application, 2017 – 2022 (USD Million) 70
TABLE NO. 59. : Global Food & Beverage Stevia Market Revenue, By Application, 2023– 2030 (USD Million) 70
TABLE NO. 60. : North America Food & Beverage Stevia Market Volume, By Country, 2017 – 2022 (Kilo Tons) 72
TABLE NO. 61. : North America Food & Beverage Stevia Market Volume, By Country, 2023– 2030 (Kilo Tons) 72
TABLE NO. 62. : North America Food & Beverage Stevia Market Revenue, By Country, 2017 – 2022 (USD Million) 72
TABLE NO. 63. : North America Food & Beverage Stevia Market Revenue, By Country, 2023– 2030 (USD Million) 72
TABLE NO. 64. : North America Food & Beverage Stevia Market Volume, By Type, 2017 – 2022 (Kilo Tons) 73
TABLE NO. 65. : North America Food & Beverage Stevia Market Volume, By Type, 2023– 2030 (Kilo Tons) 73
TABLE NO. 66. : North America Food & Beverage Stevia Market Revenue, By Type, 2017 – 2022 (USD Million) 74
TABLE NO. 67. : North America Food & Beverage Stevia Market Revenue, By Type, 2023– 2030 (USD Million) 74
TABLE NO. 68. : North America Food & Beverage Stevia Market Volume, By Application, 2017 – 2022 (Kilo Tons) 75
TABLE NO. 69. : North America Food & Beverage Stevia Market Volume, By Application, 2023– 2030 (Kilo Tons) 75
TABLE NO. 70. : North America Food & Beverage Stevia Market Revenue, By Application, 2017 – 2022 (USD Million) 76
TABLE NO. 71. : North America Food & Beverage Stevia Market Revenue, By Application, 2023– 2030 (USD Million) 76
TABLE NO. 72. : Europe Food & Beverage Stevia Market Volume, By Country, 2017 – 2022 (Kilo Tons) 79
TABLE NO. 73. : Europe Food & Beverage Stevia Market Volume, By Country, 2023– 2030 (Kilo Tons) 79
TABLE NO. 74. : Europe Food & Beverage Stevia Market Revenue, By Country, 2017 – 2022 (USD Million) 80
TABLE NO. 75. : Europe Food & Beverage Stevia Market Revenue, By Country, 2023– 2030 (USD Million) 80
TABLE NO. 76. : Europe Food & Beverage Stevia Market Volume, By Type, 2017 – 2022 (Kilo Tons) 81
TABLE NO. 77. : Europe Food & Beverage Stevia Market Volume, By Type, 2023– 2030 (Kilo Tons) 81
TABLE NO. 78. : Europe Food & Beverage Stevia Market Revenue, By Type, 2017 – 2022 (USD Million) 82
TABLE NO. 79. : Europe Food & Beverage Stevia Market Revenue, By Type, 2023– 2030 (USD Million) 82
TABLE NO. 80. : Europe Food & Beverage Stevia Market Volume, By Application, 2017 – 2022 (Kilo Tons) 83
TABLE NO. 81. : Europe Food & Beverage Stevia Market Volume, By Application, 2023– 2030 (Kilo Tons) 83
TABLE NO. 82. : Europe Food & Beverage Stevia Market Revenue, By Application, 2017 – 2022 (USD Million) 84
TABLE NO. 83. : Europe Food & Beverage Stevia Market Revenue, By Application, 2023– 2030 (USD Million) 84
TABLE NO. 84. : Asia Pacific Food & Beverage Stevia Market Volume, By Country, 2017 – 2022 (Kilo Tons) 87
TABLE NO. 85. : Asia Pacific Food & Beverage Stevia Market Volume, By Country, 2023– 2030 (Kilo Tons) 87
TABLE NO. 86. : Asia Pacific Food & Beverage Stevia Market Revenue, By Country, 2017 – 2022 (USD Million) 88
TABLE NO. 87. : Asia Pacific Food & Beverage Stevia Market Revenue, By Country, 2023– 2030 (USD Million) 88
TABLE NO. 88. : Asia Pacific Food & Beverage Stevia Market Volume, By Type, 2017 – 2022 (Kilo Tons) 89
TABLE NO. 89. : Asia Pacific Food & Beverage Stevia Market Volume, By Type, 2023– 2030 (Kilo Tons) 89
TABLE NO. 90. : Asia Pacific Food & Beverage Stevia Market Revenue, By Type, 2017 – 2022 (USD Million) 90
TABLE NO. 91. : Asia Pacific Food & Beverage Stevia Market Revenue, By Type, 2023– 2030 (USD Million) 90
TABLE NO. 92. : Asia Pacific Food & Beverage Stevia Market Volume, By Application, 2017 – 2022 (Kilo Tons) 91
TABLE NO. 93. : Asia Pacific Food & Beverage Stevia Market Volume, By Application, 2023– 2030 (Kilo Tons) 91
TABLE NO. 94. : Asia Pacific Food & Beverage Stevia Market Revenue, By Application, 2017 – 2022 (USD Million) 92
TABLE NO. 95. : Asia Pacific Food & Beverage Stevia Market Revenue, By Application, 2023– 2030 (USD Million) 92
TABLE NO. 96. : Latin America Food & Beverage Stevia Market Volume, By Country, 2017 – 2022 (Kilo Tons) 95
TABLE NO. 97. : Latin America Food & Beverage Stevia Market Volume, By Country, 2023– 2030 (Kilo Tons) 95
TABLE NO. 98. : Latin America Food & Beverage Stevia Market Revenue, By Country, 2017 – 2022 (USD Million) 96
TABLE NO. 99. : Latin America Food & Beverage Stevia Market Revenue, By Country, 2023– 2030 (USD Million) 96
TABLE NO. 100. : Latin America Food & Beverage Stevia Market Volume, By Type, 2017 – 2022 (Kilo Tons) 97
TABLE NO. 101. : Latin America Food & Beverage Stevia Market Volume, By Type, 2023– 2030 (Kilo Tons) 97
TABLE NO. 102. : Latin America Food & Beverage Stevia Market Revenue, By Type, 2017 – 2022 (USD Million) 98
TABLE NO. 103. : Latin America Food & Beverage Stevia Market Revenue, By Type, 2023– 2030 (USD Million) 98
TABLE NO. 104. : Latin America Food & Beverage Stevia Market Volume, By Application, 2017 – 2022 (Kilo Tons) 99
TABLE NO. 105. : Latin America Food & Beverage Stevia Market Volume, By Application, 2023– 2030 (Kilo Tons) 99
TABLE NO. 106. : Latin America Food & Beverage Stevia Market Revenue, By Application, 2017 – 2022 (USD Million) 100
TABLE NO. 107. : Latin America Food & Beverage Stevia Market Revenue, By Application, 2023– 2030 (USD Million) 100
TABLE NO. 108. : Middle East Food & Beverage Stevia Market Volume, By Country, 2017 – 2022 (Kilo Tons) 103
TABLE NO. 109. : Middle East Food & Beverage Stevia Market Volume, By Country, 2023– 2030 (Kilo Tons) 103
TABLE NO. 110. : Middle East Food & Beverage Stevia Market Revenue, By Country, 2017 – 2022 (USD Million) 104
TABLE NO. 111. : Middle East Food & Beverage Stevia Market Revenue, By Country, 2023– 2030 (USD Million) 104
TABLE NO. 112. : Middle East Food & Beverage Stevia Market Volume, By Type, 2017 – 2022 (Kilo Tons) 105
TABLE NO. 113. : Middle East Food & Beverage Stevia Market Volume, By Type, 2023– 2030 (Kilo Tons) 105
TABLE NO. 114. : Middle East Food & Beverage Stevia Market Revenue, By Type, 2017 – 2022 (USD Million) 106
TABLE NO. 115. : Middle East Food & Beverage Stevia Market Revenue, By Type, 2023– 2030 (USD Million) 106
TABLE NO. 116. : Middle East Food & Beverage Stevia Market Volume, By Application, 2017 – 2022 (Kilo Tons) 107
TABLE NO. 117. : Middle East Food & Beverage Stevia Market Volume, By Application, 2023– 2030 (Kilo Tons) 107
TABLE NO. 118. : Middle East Food & Beverage Stevia Market Revenue, By Application, 2017 – 2022 (USD Million) 108
TABLE NO. 119. : Middle East Food & Beverage Stevia Market Revenue, By Application, 2023– 2030 (USD Million) 108
TABLE NO. 120. : Africa Food & Beverage Stevia Market Volume, By Country, 2017 – 2022 (Kilo Tons) 111
TABLE NO. 121. : Africa Food & Beverage Stevia Market Volume, By Country, 2023– 2030 (Kilo Tons) 111
TABLE NO. 122. : Africa Food & Beverage Stevia Market Revenue, By Country, 2017 – 2022 (USD Million) 112
TABLE NO. 123. : Africa Food & Beverage Stevia Market Revenue, By Country, 2023– 2030 (USD Million) 112
TABLE NO. 124. : Africa Food & Beverage Stevia Market Volume, By Type, 2017 – 2022 (Kilo Tons) 113
TABLE NO. 125. : Africa Food & Beverage Stevia Market Volume, By Type, 2023– 2030 (Kilo Tons) 113
TABLE NO. 126. : Africa Food & Beverage Stevia Market Revenue, By Type, 2017 – 2022 (USD Million) 114
TABLE NO. 127. : Africa Food & Beverage Stevia Market Revenue, By Type, 2023– 2030 (USD Million) 114
TABLE NO. 128. : Africa Food & Beverage Stevia Market Volume, By Application, 2017 – 2022 (Kilo Tons) 115
TABLE NO. 129. : Africa Food & Beverage Stevia Market Volume, By Application, 2023– 2030 (Kilo Tons) 115
TABLE NO. 130. : Africa Food & Beverage Stevia Market Revenue, By Application, 2017 – 2022 (USD Million) 116
TABLE NO. 131. : Africa Food & Beverage Stevia Market Revenue, By Application, 2023– 2030 (USD Million) 116

Frequently Asked Questions

What is the Food & Beverage Stevia Market?

The Food & Beverage Stevia Market refers to the enterprise that produces, distributes, and consumes food and beverage products that contain the natural sweetener called stevia. Stevia is derived from the leaves of the Stevia rebaudiana plant and is known for its high sweetness level without adding calories.

Why is the Food & Beverage Stevia Market growing?

The Food & Beverage Stevia Market is experiencing growth because of numerous elements. Firstly, consumers are increasingly calling for healthier food and beverage alternatives. Stevia is an herbal, plant-based sweetener that offers a sugar-like taste without the added calories, making it an appealing option to synthetic sweeteners. The rising prevalence of diabetes and obesity has led to a shift toward low-calorie and sugar-free products, further driving the demand for stevia based food and beverages.

What are the key product segments within the Food & Beverage Stevia Market?

The Food & Beverage Stevia Market comprises diverse product segments. Some key segments include stevia based sweeteners, stevia based liquids, stevia-infused snacks, and stevia-sweetened confectionery products. These segments cater to different consumer preferences and offer numerous choices for people looking for healthier alternatives to conventional sweetened products.

What are the predominant factors driving the growth of the Food & Beverage Stevia Market?

Several factors contribute to the Food & Beverage Stevia Market growth. These include increasing client attention to the health risks related to excessive sugar intake, the demand for herbal and plant-based ingredients, the developing occurrence of lifestyle diseases, and the desire for sugar reduction in food and beverage products. Additionally, regulatory measures promoting stevia as a sugar replacement have also driven marketplace growth.

Does the Food & Beverage Stevia Market face any challenges?

While the Food & Beverage Stevia Market has experienced sizable growth, it does face challenges. One challenge is stevia’s flavor profile, as a few people have perceived it to have a mild aftertaste compared to standard sugar. However, developments in stevia extraction and method techniques have helped reduce this problem. Additionally, the price of stevia compared to synthetic sweeteners and sugar remains distinctly higher, posing a challenge for price-sensitive clients.

Which regions are witnessing good-sized growth inside the Food & Beverage Stevia Market?

The Food & Beverage Stevia Market is experiencing a growth globally, with numerous regions witnessing substantial expansion. The key regions driving the marketplace growth are North America, Europe, and Asia-Pacific. North America and Europe have increasing consumer demand for natural, healthier food alternatives. At the same time, Asia-Pacific, especially nations like China and India, have widespread marketplace potential because of their big population and changing nutritional behavior.

Who are the key players in the Food & Beverage Stevia Market?

The Food & Beverage Stevia Market has a competitive landscape with several key players working within the enterprise. Some prominent businesses include PureCircle Ltd., Cargill Incorporated, Tate & Lyle PLC, Ingredion Incorporated, GLG Life Tech Corporation, and Sweegen Inc. These businesses are engaged in research and improvement, product innovation, and strategic collaborations to extend their market presence and meet the growing consumer demand for stevia-based products.

Is the Food & Beverage Stevia Market regulated?

The Food & Beverage Stevia Market is regulated in different countries to ensure customer safety and product quality. Regulatory bodies, such as the U.S. Food and Drug Administration (FDA), the European Food Safety Authority (EFSA), and the Food Standards Australia New Zealand (FSANZ), have established guidelines and policies concerning using stevia as a food component. These regulations specify desirable levels of steviol glycosides and the active compounds in stevia and outline labeling necessities for stevia products.

What are the future prospects for the Food & Beverage Stevia Market?

The future prospects for the Food & Beverage Stevia Market are promising. As clients become more health-conscious and search for options for sugar, the demand for stevia-based products is predicted to grow. The market will probably witness similar developments in stevia extraction strategies, flavor enhancement, and product formulation to address current challenges. Expanding distribution channels and increasing client recognition are expected to increase the market in developed and emerging economies.

How does the Food & Beverage Stevia Market contribute to sustainable food manufacturing?

The Food & Beverage Stevia Market contributes to sustainable food production in numerous ways. Firstly, stevia is a natural sweetener that requires fewer resources, including water and land, than sugar cane or sugar beet production. This reduces the environmental effect related to traditional sweeteners. Secondly, stevia-based products often have a lower carbon footprint, as they reduce usual sugar intake, which is linked to environmental issues like deforestation and greenhouse fuel emissions. Lastly, the cultivation of stevia flora can offer monetary opportunities for farmers, especially in regions where stevia is grown, contributing to sustainable agricultural practices.

Food Encapsulation Market

Published:
Report ID: 5663

Gluten-Free Bakery Products Market

Published:
Report ID: 36306

Low Calorie Food Market

Published:
Report ID: 12195

Food Preservatives Market

Published:
Report ID: 5660

Dairy Blends Market

Published:
Report ID: 4452

Sodium Benzoate Market

Published:
Report ID: 10462

Ready to Use Therapeutic Food Market

Published:
Report ID: 8866

Sunflower Oil Market

Published:
Report ID: 10108

Specialty Milk Formula Market

Published:
Report ID: 9566

UK Clean Label Starch Market

Published:
Report ID: 35481

Germany Clean Label Starch Market

Published:
Report ID: 35468

U.S. Clean Label Starch Market

Published:
Report ID: 35460

Purchase Options

$2999
Delivery Format: Excel.
$4999
Designed for the individual purchaser.
$6999
Users located at a single corporate site or regional office.
$7999
Allowed for unlimited sharing globally within one company.
Smallform of Sample request

Have a question?

User Profile

Don’t settle for less – trust Mitul to help you find the best solution.

Report delivery within 24 to 48 hours

– Other Info –

What people say?-

User Review

I am very impressed with the information in this report. The author clearly did their research when they came up with this product and it has already given me a lot of ideas.

Jana Schmidt
CEDAR CX Technologies

– Connect with us –

Phone

+91 6232 49 3207


support

24/7 Research Support


sales@credenceresearch.com

– Research Methodology –

Going beyond the basics: advanced techniques in research methodology

– Trusted By –

Pepshi, LG, Nestle
Motorola, Honeywell, Johnson and johnson
LG Chem, SIEMENS, Pfizer
Unilever, Samsonite, QIAGEN