
Market Overview
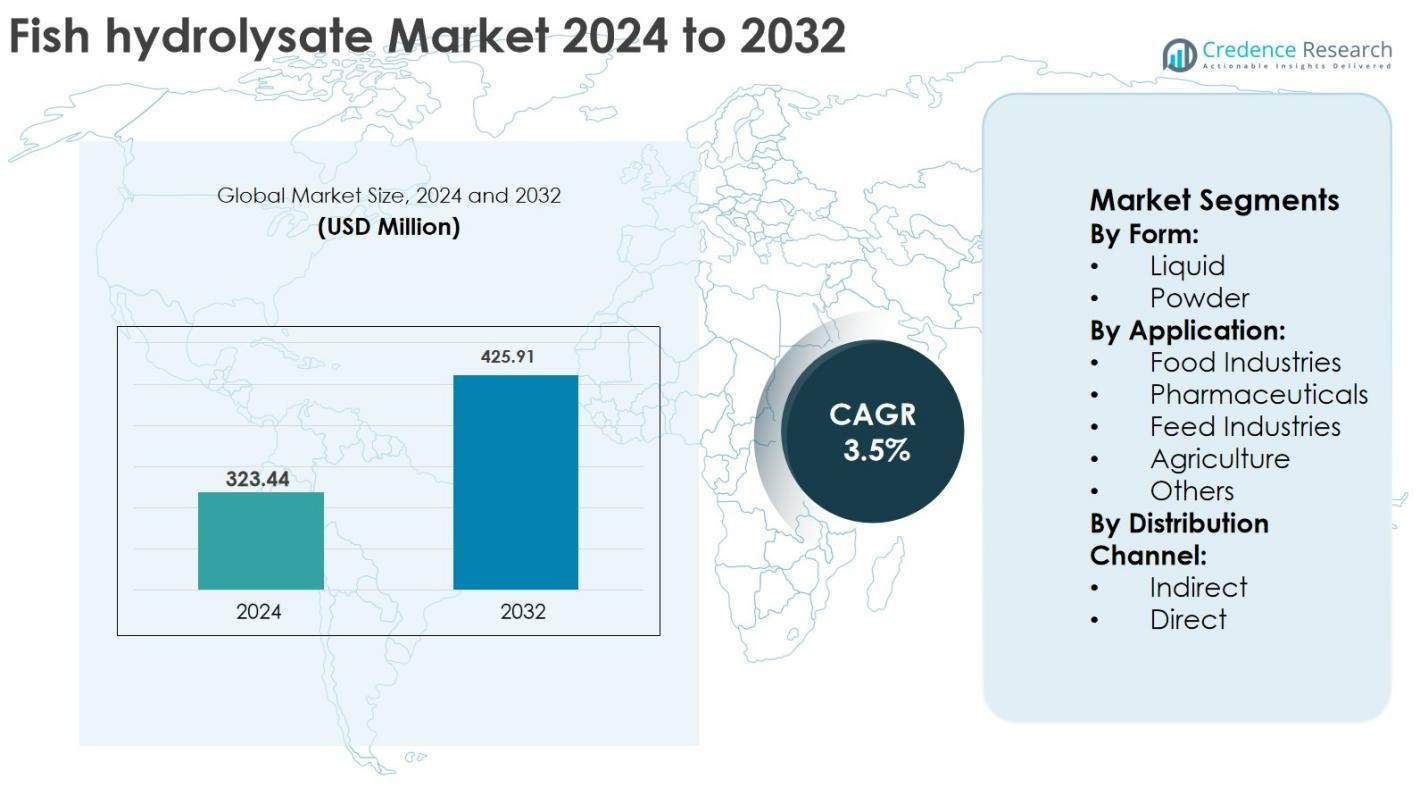
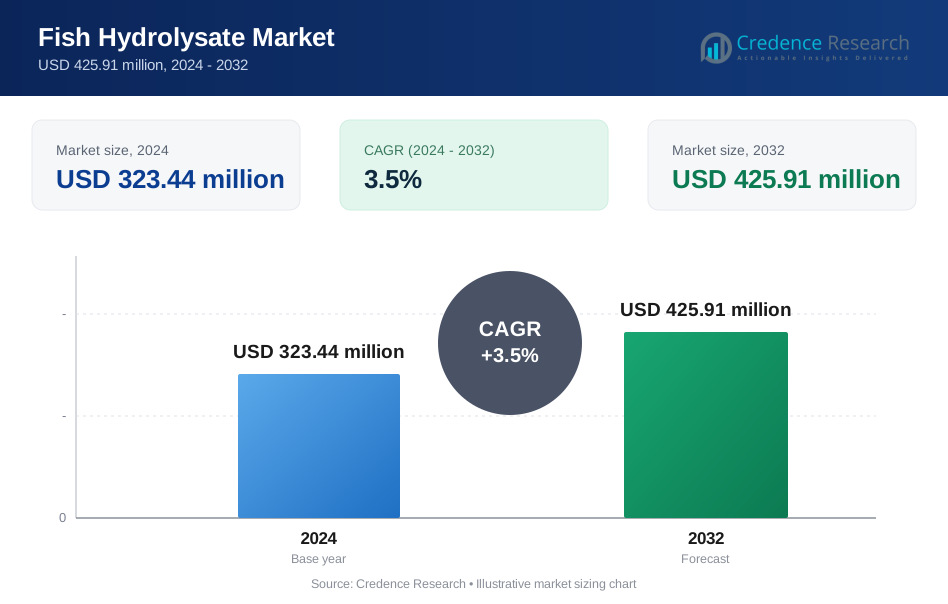
Fish Hydrolysate Market size was valued at USD 323.44 million in 2024 and is anticipated to reach USD 425.91 million by 2032, at a CAGR of 3.5% during the forecast period.
| REPORT ATTRIBUTE | DETAILS |
|---|---|
| Historical Period | 2020-2023 |
| Base Year | 2024 |
| Forecast Period | 2025-2032 |
| Fish Hydrolysate Market Size 2024 | USD 323.44 Million |
| Fish Hydrolysate Market, CAGR | 3.5% |
| Fish Hydrolysate Market Size 2032 | USD 425.91 Million |
Fish hydrolysate market is characterized by the presence of established global and regional players focusing on sustainable sourcing, application-specific formulations, and value-added processing. Leading companies such as Hofseth BioCare ASA, Diana Group S.r.l, Bio-marine Ingredients Ireland, Copalis, Scanbio Marine Group AS, Omega Protein Corporation, Sopropêche, Sociedad Pesquera Landes SA, Janatha Fish Meal & Oil Products, and TC Union Agrotech actively compete through product innovation and diversified end-use offerings across feed, agriculture, and nutraceutical segments. Regionally, North America dominated the Fish hydrolysate market with 32% market share in 2024, supported by strong demand from feed and organic agriculture. Europe followed with 29% share, driven by circular economy practices and aquaculture strength, while Asia Pacific accounted for 26%, reflecting rapid aquaculture expansion and raw material availability.
 Market Insights
- Fish hydrolysate market was valued at USD 323.44 million in 2024 and is projected to reach USD 425.91 million by 2032, growing at a CAGR of 3.5% during the forecast period.
- Market growth is driven by rising demand for sustainable inputs in agriculture and increasing use in aquaculture and animal feed due to high digestibility and bioactive peptide content.
- Key market trends include expanding adoption in organic farming, growing use in nutraceuticals, and technological advancements in enzymatic hydrolysis to improve product consistency and performance.
- The market shows moderate fragmentation, with leading players focusing on sustainable sourcing, customized formulations, and expansion across feed, agriculture, and food applications.
- North America held 32% market share in 2024, followed by Europe with 29% and Asia Pacific with 26%, while the liquid form segment dominated with 58% share due to higher bioavailability and ease of application.
Market Segmentation Analysis:
By Form
The Fish hydrolysate market by form is led by the liquid segment, which accounted for 58% market share in 2024, driven by its high bioavailability, easy absorption, and suitability for direct application in agriculture and animal nutrition. Liquid fish hydrolysates offer faster nutrient uptake, particularly amino acids and peptides, making them highly effective in foliar sprays and liquid feed formulations. The growing adoption of organic farming practices, increasing demand for natural biostimulants, and rising use in aquaculture feed significantly support liquid-form demand, while powder forms gain traction due to longer shelf life and ease of transportation.
- For instance, Ocean Organics’ liquid fish-based biostimulant lines are widely used in specialty crops and turf because they can be applied directly through fertigation and foliar spraying, improving plant vigor and stress tolerance as documented in grower field trials.
By Application
By application, the feed industries segment dominated with 42% market share in 2024, supported by rising demand for protein-rich and digestible feed ingredients in aquaculture, livestock, and pet nutrition. Fish hydrolysates improve feed palatability, nutrient absorption, and gut health, driving their widespread adoption. Expanding aquaculture production, increasing focus on sustainable feed alternatives, and regulatory pressure to reduce synthetic additives are key growth drivers. Food and pharmaceutical applications are also growing steadily, supported by rising interest in bioactive peptides and functional nutrition ingredients.
- For instance, Skretting and Cargill have both reported increased use of marine protein hydrolysates in high-performance aquafeeds to improve palatability and support gut function in species such as salmon and shrimp, as documented in their technical feed guidelines and sustainability reports.
By Distribution Channel
In terms of distribution channel, the indirect channel held 64% market share in 2024, owing to the strong presence of distributors, wholesalers, and regional suppliers that ensure broad market reach. Indirect distribution enables manufacturers to access diverse end-user industries, including agriculture, feed, and food processing, while reducing logistical complexity. Established distributor networks, especially in emerging markets, support consistent product availability and technical assistance. Meanwhile, direct channels are expanding among large buyers seeking cost optimization, customized formulations, and long-term supply agreements.
Key Growth Drivers
Rising Demand for Sustainable and Organic Inputs
The Fish hydrolysate market benefits strongly from the growing global shift toward sustainable, organic, and environmentally responsible products. Fish hydrolysates, derived from fish processing by-products, support circular economy practices by converting waste into high-value inputs. In agriculture, they are increasingly adopted as natural biostimulants that enhance soil health, nutrient uptake, and crop resilience without harming ecosystems. Rising regulatory restrictions on synthetic fertilizers and chemical additives further encourage the use of fish-based alternatives. Additionally, consumer preference for organic food products indirectly drives demand, as farmers seek compliant inputs that improve yields while meeting organic certification standards.
- For instance, companies such as Alaska Sea Grant and Trident Seafoods have promoted the use of liquid fish fertilizer produced from processing by‑products, highlighting its role in reducing waste and creating value‑added agricultural inputs documented in their extension materials and sustainability reports.
Expansion of Aquaculture and Animal Nutrition Industries
Rapid growth in aquaculture and livestock production significantly accelerates demand for fish hydrolysates as functional feed ingredients. Fish hydrolysates offer high digestibility, improved amino acid profiles, and enhanced feed palatability, making them suitable for aquafeed, poultry, swine, and pet nutrition. Increasing global seafood consumption and the need to improve feed efficiency drive adoption, particularly in intensive aquaculture systems. Moreover, the rising focus on animal health, immunity enhancement, and reduced antibiotic usage supports the integration of bioactive peptides present in fish hydrolysates. These benefits position fish hydrolysates as essential inputs for modern, performance-driven feed formulations.
- For instance, Symrise Pet Food uses fish protein hydrolysates as natural palatants in premium dog and cat foods, reporting higher acceptance and intake levels compared with conventional protein meals in their internal palatability trials.
Growing Use in Food and Pharmaceutical Applications
The food and pharmaceutical industries increasingly utilize fish hydrolysates due to their bioactive properties and functional benefits. Rich in peptides, amino acids, and minerals, fish hydrolysates are incorporated into nutraceuticals, dietary supplements, and functional foods targeting gut health, muscle recovery, and immune support. Aging populations, rising health awareness, and demand for natural protein sources strengthen market growth. In pharmaceuticals, ongoing research highlights the antioxidant, anti-inflammatory, and antihypertensive properties of fish-derived peptides, expanding potential therapeutic applications. These developments encourage manufacturers to invest in advanced processing technologies and value-added product development.
Key Trends & Opportunities
Technological Advancements in Enzymatic Hydrolysis
Advancements in enzymatic hydrolysis techniques represent a major trend in the Fish hydrolysate market. Improved enzyme specificity enables the production of consistent, high-quality hydrolysates with targeted peptide profiles. These innovations enhance product efficacy across agriculture, feed, and pharmaceutical applications while reducing processing time and energy consumption. Manufacturers increasingly adopt controlled hydrolysis processes to improve solubility, taste masking, and nutrient bioavailability. This trend creates opportunities for product differentiation, premium formulations, and customized solutions tailored to specific end-use requirements, strengthening competitive positioning and expanding application scope.
- For instance, Hofseth Biocare uses controlled enzymatic hydrolysis of salmon raw material to produce standardized peptide profiles in products like ProGo, reporting high digestibility and specific bioactive properties in its technical documentation and published studies.
Rising Adoption in Organic and Precision Agriculture
Fish hydrolysates are gaining traction in organic and precision agriculture systems as farmers seek inputs that support yield optimization and stress tolerance. Their compatibility with drip irrigation and foliar application aligns well with precision farming practices. Growing awareness of soil regeneration, microbial activity enhancement, and climate-resilient farming creates strong opportunities for market expansion. Emerging economies, in particular, present untapped potential as governments promote sustainable agriculture and reduce dependency on chemical fertilizers. These trends open avenues for partnerships with agribusinesses and expansion into high-growth agricultural regions.
- For instance, OMRI‑listed fish hydrolysate fertilizers from North American manufacturers are widely used by organic growers through fertigation and foliar spraying, helping them comply with USDA National Organic Program requirements while improving crop vigor and soil biological activity.
Key Challenges
Supply Chain Dependence on Raw Material Availability
The Fish hydrolysate market faces challenges related to the availability and consistency of raw fish by-products. Seasonal fishing patterns, regulatory fishing quotas, and environmental factors can disrupt supply chains and affect production stability. Variations in raw material quality also influence hydrolysate composition and performance, requiring strict quality control measures. Dependence on specific fish species and regional processing facilities further increases vulnerability, potentially leading to price volatility and supply constraints for manufacturers.
High Processing Costs and Limited Awareness
High processing costs associated with enzymatic hydrolysis, quality testing, and storage present a barrier to widespread adoption, particularly among small-scale end users. Advanced processing equipment and skilled labor increase production expenses, impacting product pricing. Additionally, limited awareness of fish hydrolysate benefits in certain regions restricts market penetration. In agriculture and feed sectors, knowledge gaps regarding application methods and performance outcomes slow adoption. Addressing these challenges requires targeted education initiatives, cost-effective production innovations, and strategic distribution partnerships.
Regional Analysis
North America
North America accounted for 32% market share in 2024 in the Fish hydrolysate market, driven by strong demand from animal feed, agriculture, and nutraceutical industries. The region benefits from advanced aquaculture practices, high adoption of organic farming inputs, and well-established food and dietary supplement markets. The United States leads regional consumption due to increasing use of fish hydrolysates in pet nutrition and sustainable agriculture. Strong R&D capabilities and the presence of key manufacturers support product innovation. Regulatory support for sustainable by-product utilization further strengthens North America’s market position.
Europe
Europe held 29% market share in 2024, supported by strict environmental regulations and high adoption of circular economy practices. Countries such as Norway, France, and Ireland play a critical role due to strong fisheries, aquaculture operations, and advanced fish processing infrastructure. Fish hydrolysates are widely used in organic agriculture, biostimulants, and aquafeed applications across the region. Growing consumer demand for natural and clean-label food ingredients further supports market growth. Additionally, ongoing research into bioactive peptides for pharmaceutical and nutraceutical applications enhances Europe’s long-term growth outlook.
Asia Pacific
Asia Pacific captured 26% market share in 2024 and represents the fastest-growing regional market for fish hydrolysates. Rapid expansion of aquaculture, particularly in China, India, Vietnam, and Indonesia, drives strong demand for protein-rich and digestible feed ingredients. Increasing agricultural activities and rising awareness of organic inputs further support market expansion. The region benefits from abundant raw material availability due to large-scale fish processing industries. Government initiatives promoting sustainable farming and aquaculture practices, along with growing food and supplement consumption, continue to accelerate regional market growth.
Latin America
Latin America accounted for 8% market share in 2024, supported by expanding aquaculture and agricultural sectors in countries such as Chile, Peru, and Brazil. The region benefits from strong fisheries resources and increasing utilization of fish processing by-products. Fish hydrolysates are gaining traction as natural fertilizers and feed ingredients, particularly in export-oriented aquaculture operations. Growing awareness of sustainable farming practices and improving distribution networks support market development. However, limited processing infrastructure in certain countries slightly restrains faster adoption compared to developed regions.
Middle East & Africa
The Middle East & Africa region held about 5% market share in 2024, reflecting an emerging but steadily growing market. Increasing investments in aquaculture, especially in the Gulf countries, support demand for high-quality feed ingredients such as fish hydrolysates. In Africa, growth is driven by expanding agriculture and rising interest in organic soil enhancers. Limited local processing capacity and lower awareness currently constrain market penetration. However, improving food security initiatives, sustainable farming programs, and gradual development of fisheries infrastructure are expected to support future growth.
Market Segmentations:
By Form:
- Liquid
- Powder
By Application:
- Food Industries
- Pharmaceuticals
- Feed Industries
- Agriculture
- Others
By Distribution Channel:
- Indirect
- Direct
By Geography
- North America
- U.S.
- Canada
- Mexico
- Europe
- Germany
- France
- U.K.
- Italy
- Spain
- Rest of Europe
- Asia Pacific
- China
- Japan
- India
- South Korea
- South-east Asia
- Rest of Asia Pacific
- Latin America
- Brazil
- Argentina
- Rest of Latin America
- Middle East & Africa
- GCC Countries
- South Africa
- Rest of the Middle East and Africa
Competitive Landscape
The Fish hydrolysate market features a moderately fragmented competitive landscape characterized by the presence of both global manufacturers and regional specialists focused on agriculture, feed, and nutraceutical applications. Key players such as Hofseth BioCare ASA, Diana Group S.r.l, Bio-marine Ingredients Ireland, Copalis, Scanbio Marine Group AS, Omega Protein Corporation, Sopropêche, Sociedad Pesquera Landes SA, Janatha Fish Meal & Oil Products, and TC Union Agrotech actively compete through product quality, application-specific formulations, and sustainable sourcing practices. Companies increasingly invest in advanced enzymatic hydrolysis technologies to enhance peptide profiles, improve bioavailability, and ensure consistency. Strategic initiatives include capacity expansions, partnerships with aquaculture and agribusiness firms, and utilization of fish processing by-products to support circular economy objectives. Additionally, players focus on geographic expansion, customized solutions, and regulatory compliance to strengthen market presence and maintain long-term competitiveness.
Key Player Analysis
- Scanbio Marine Group AS
- TC Union Agrotech
- Diana Group S.r.l
- Sociedad Pesquera Landes SA
- Hofseth BioCare ASA
- Janatha Fish Meal & Oil Products
- Omega Protein Corporation
- Sopropêche
- Bio-marine Ingredients Ireland
- Copalis
Recent Developments
- In 2025, BioMar Group completed the acquisition of full ownership of LetSea, enhancing R&D capacity in marine ingredients including functional fish proteins and hydrolysates aimed at improving fish health and performance.
- In February 2025, Hofseth BioCare ASA signed a strategic partnership with Symrise AG to scale its enzymatic hydrolysis capacity and expand market reach for marine-based ingredients in human health and pet nutrition, including financing and exclusive distribution arrangements.
Report Coverage
The research report offers an in-depth analysis based on Form, Application, Distribution Channel and Geography. It details leading market players, providing an overview of their business, product offerings, investments, revenue streams, and key applications. Additionally, the report includes insights into the competitive environment, SWOT analysis, current market trends, as well as the primary drivers and constraints. Furthermore, it discusses various factors that have driven market expansion in recent years. The report also explores market dynamics, regulatory scenarios, and technological advancements that are shaping the industry. It assesses the impact of external factors and global economic changes on market growth. Lastly, it provides strategic recommendations for new entrants and established companies to navigate the complexities of the market.
Future Outlook
- Fish hydrolysate market will witness steady demand growth driven by expanding applications across agriculture, feed, food, and nutraceutical sectors.
- Adoption of fish hydrolysates as natural biostimulants will increase as sustainable and organic farming practices gain wider acceptance.
- Aquaculture and animal nutrition industries will continue to be primary demand generators due to the need for high-digestibility protein sources.
- Advancements in enzymatic hydrolysis technologies will improve product consistency, bioactivity, and application-specific performance.
- Manufacturers will increasingly focus on value-added formulations tailored for precision agriculture and specialty feed applications.
- Utilization of fish processing by-products will strengthen circular economy practices and support sustainability goals.
- Emerging economies will present strong growth opportunities due to expanding aquaculture and agricultural activities.
- Strategic partnerships and capacity expansions will intensify as companies seek to strengthen regional presence.
- Regulatory support for eco-friendly inputs will encourage substitution of synthetic additives with fish-based alternatives.
- Innovation in functional food and nutraceutical applications will broaden the long-term growth potential of the market.
Request a Free Sample
Fill in your details and we'll send you a free sample report.
- Sample data tables & charts
- Research methodology
Need a Custom Version of This Report?
Tailor the scope, geography, or segments to your exact requirements.
- Custom geography or segment scope
- Direct access to our analyst team
Frequently Asked Questions
What is the current market size for Fish hydrolysate market, and what is its projected size in 2032?
At what Compound Annual Growth Rate is the Fish hydrolysate market projected to grow between 2024 and 2032?
Which Fish hydrolysate market segment held the largest share in 2024?
What are the primary factors fueling the growth of the Fish hydrolysate market?
Who are the leading companies in the Fish hydrolysate market?
Which region commanded the largest share of the Fish hydrolysate market in 2024?
Table of Content
Chapter 1. Report Introduction
- 1.1 Report Description & Purpose
- 1.1.1 Report Title & Market Definition
- 1.1.2 Unique Selling Propositions (USP) & Key Differentiators
- 1.1.3 Value Proposition for Stakeholders
- 1.2 Research Objectives
- 1.2.1 Market Sizing Objectives (Volume & Revenue)
- 1.2.2 Segmentation Objectives
- 1.2.3 Competitive Intelligence Objectives
- 1.2.4 Forecast & Scenario Objectives
- 1.3 Report Scope
- 1.3.1 Fish Hydrolysate Scope – Types & Subtypes Covered
- 1.3.2 Geographic Scope – Regions & Countries Covered
- 1.3.3 Historical Period, Base Year & Forecast Period (2024; forecast to 2032)
- 1.3.4 Inclusions & Exclusions
- 1.4 HS Code & Classification Framework
- 1.5 Currency, Units & Pricing Basis
- 1.6 Target Stakeholders
- 1.7 Limitations & Assumptions
Chapter 2. Executive Summary
- 2.1 Global Fish Hydrolysate Market Snapshot
- 2.1.1 Market Size – Historical (2024) & Forecast (2024-2032) (2024: USD 323.44 million → 2032: USD 425.91 million)
- 2.1.2 Volume & Revenue – Global Totals
- 2.1.3 Key Market Highlights – Top Five Facts
- 2.2 Fish Hydrolysate Market Segmentation Snapshot
- 2.2.1 Market Split by Region – 2024 vs. 2032
- 2.3 Competitive Snapshot
- 2.3.1 Top 10 Players by Revenue Share – 2024
- 2.3.2 Top 10 Players by Volume Share – 2024
- 2.3.3 Recent Strategic Developments (18-Month Summary)
- 2.4 Key Investment Highlights & Strategic Conclusions
Chapter 3. Fish Hydrolysate Market Dynamics & Industry Analysis
- 3.1 Market Overview & Context
- 3.1.1 Fish Hydrolysate Market Position in the Broader Automotive Value Chain
- 3.1.2 OEM vs. Replacement Market Dynamics
- 3.1.3 Market Maturity & Development Stage by Region
- 3.2 Fish Hydrolysate Market Drivers
- 3.3 Fish Hydrolysate Market Restraints & Challenges
- 3.4 Fish Hydrolysate Market Opportunities
- 3.5 Porter's Five Forces Analysis
- 3.5.1 Threat of New Entrants
- 3.5.2 Bargaining Power of Suppliers
- 3.5.3 Bargaining Power of Buyers
- 3.5.4 Threat of Substitutes
- 3.5.5 Competitive Rivalry – Intensity Assessment
- 3.6 Fish Hydrolysate Value Chain Analysis
- 3.6.1 Upstream – Raw Material/Input Suppliers
- 3.6.1.1 Raw Material/Input 1
- 3.6.1.2 Raw Material/Input 2
- 3.6.1.3 Raw Material/Input 3
- 3.6.2 Midstream – Production/Manufacturing/Service Delivery
- 3.6.2.1 Production/Process Overview
- 3.6.2.2 Key Facility Locations & Capacity by Manufacturer
- 3.6.3 Downstream – Distribution & End Consumer
- 3.6.3.1 Primary Channel – B2B/OEM
- 3.6.3.2 Secondary Channels – Dealer, Retail, Online, Direct
- 3.6.4 Value Chain Profitability Analysis
- 3.6.1 Upstream – Raw Material/Input Suppliers
- 3.7 PESTEL Analysis
- 3.7.1 Political Factors
- 3.7.2 Economic Factors
- 3.7.3 Social Factors
- 3.7.4 Technological Factors
- 3.7.5 Environmental Factors
- 3.7.6 Legal Factors
- 3.8 Fish Hydrolysate Supply Chain Analysis
- 3.8.1 Raw Material/Input Supply Risk Assessment
- 3.8.2 Manufacturing Concentration Risk (Geographic Exposure)
- 3.8.3 Trade Disruption Impact Analysis
- 3.9 Regulatory & Policy Landscape
Note: The regulatory and policy landscape section covers regulations based on their applicability to the market, Fish Hydrolysate category, geography, and scope of the study. Only regulatory frameworks with a material impact on operations, compliance, trade, sustainability, or market access are analyzed in detail.
Chapter 4. Key Investment Pockets & Opportunity Analysis
- 4.1 Fish Hydrolysate Market Attractiveness Analysis
- 4.1.1 By Region – Investment Attractiveness Matrix (Volume × CAGR)
- 4.2 Absolute Revenue Growth Opportunity
- 4.2.1 By Region – Absolute USD Growth Through 2032
- 4.3 Incremental Volume Opportunity
- 4.3.1 By Region – Incremental Volume Through 2032
- 4.3.2 Segment – Incremental Volume
- 4.4 Emerging Submarket Opportunity Deep Dive (Subject to Applicability)
- 4.5 Emerging Market Opportunity Scorecards
- 4.5.1 United States
- 4.5.2 Europe
- 4.5.3 Asia
- 4.5.4 Middle East & Africa
Note: Emerging Market Opportunity Scorecards will be included based on relevance and strategic importance. Regions listed are indicative and may vary depending on data availability and market dynamics.
Chapter 5. Fish Hydrolysate Import-Export Analysis & Trade Flows
- 5.1 Global Trade Overview
- 5.1.1 Global Export Value by Country (2024)
- 5.1.2 Global Export Volume by Country (2024)
- 5.1.3 Global Import Value by Country (2024)
- 5.1.4 Global Import Volume by Country (2024)
- 5.1.5 Net Trade Balance by Country (2024)
- 5.2 Export Analysis – Segment
- 5.2.1 Type 1 (HS Code)
- 5.2.2 Type 2 (HS Code)
- 5.2.3 Type 3 (HS Code)
- 5.2.4 Type 4 (HS Code)
- 5.2.5 Type 5 (HS Code)
- 5.3 Import Analysis – Segment
- 5.3.1 Type 1 (HS Code)
- 5.3.2 Type 2 (HS Code)
- 5.3.3 Type 3 (HS Code)
- 5.3.4 Type 4 (HS Code)
- 5.3.5 Type 5 (HS Code)
- 5.4 Average Unit Trade Prices
- 5.4.1 Average Export Price – Segment & Country
- 5.4.2 Average Import Price – Segment & Source Country
- 5.4.3 Price Trends (2024)
- 5.5 Key Trade Route Analysis
- 5.5.1 Trade Route 1
- 5.5.2 Trade Route 2
- 5.5.3 Trade Route 3
- 5.5.4 Trade Route 4
- 5.5.5 Trade Route 5
- 5.6 Trade Policy Impact Assessment
- 5.6.1 US Anti-Dumping & Section 301 Tariffs
- 5.6.2 EU Customs Union Impact
- 5.6.3 Major Free Trade Agreements
- 5.6.4 USMCA Rules of Origin
Note: Trade policy analysis will be included only where relevant to the Fish Hydrolysate market.
Chapter 6. Competitive Landscape & Company Benchmarking
- 6.1 Fish Hydrolysate Market Concentration & Structure
- 6.1.1 Herfindahl-Hirschman Index (HHI) – vs. 2024
- 6.1.2 Tier 1, Tier 2 & Tier 3 Market Structure
- 6.1.3 Global, Regional & Local Player Dynamics
- 6.2 Fish Hydrolysate Market Share Analysis – 2024
- 6.2.1 Global Revenue Share by Company
- 6.2.2 Global Volume Share by Company
- 6.2.3 Regional Revenue Share
- 6.2.4 Market Share Evolution ( vs. 2024)
- 6.2.5 OEM Segment Share by Company
- 6.2.6 Replacement Segment Share by Company
- 6.3 Production/Delivery Capacity & Facility Analysis
- 6.3.1 Global Installed Capacity
- 6.3.2 Capacity Utilization Rates
- 6.3.3 Production/Output Volume
- 6.3.4 Facility Locations & Capacity Map
- 6.3.5 Planned Capacity Additions
- 6.4 Fish Hydrolysate Competitive Benchmarking Matrix
- 6.4.1 Revenue, Volume, CAGR & Profitability Comparison
- 6.4.2 Channel Revenue Mix
- 6.4.3 Geographic Revenue Exposure
- 6.4.4 R&D Intensity
- 6.4.5 Sustainability Maturity
- 6.5 Strategic Developments in Fish Hydrolysate (Last 24 Months)
- 6.5.1 Mergers, Acquisitions & Divestments
- 6.5.2 New Fish Hydrolysate Launches
- 6.5.3 Facility Expansions
- 6.5.4 Strategic Alliances, Joint Ventures & Partnerships
- 6.5.5 Distribution Expansion & Market Entry
- 6.5.6 Sustainability & ESG Initiatives
- 6.6 Competitive Strategy Mapping
- 6.6.1 Leader, Challenger, Follower & Niche Classification
- 6.6.2 Pricing Strategy Comparison
- 6.6.3 Channel Strategy Matrix
Note: Strategic developments are included based on their materiality and the availability of reliable information.
Chapter 7. Global Fish Hydrolysate Market – By Distribution Channel
- 7.1 Segment Overview
- 7.1.1 Volume & Revenue Split by Channel (2024 & 2032)
- 7.1.2 Channel Mix Evolution (2024-2032)
Chapter 8. Regional Market Analysis – Global Overview
- 8.1 Global Regional Overview
- 8.1.1 Regional Volume Share
- 8.1.2 Regional Revenue Share
- 8.1.3 Regional Volume by Region
- 8.1.4 Regional Revenue by Region
- 8.1.5 Regional Forecast Through 2032
- 8.2 Cross-Regional Segment Analysis
- 8.2.1 By Distribution Channel
- 8.2.2 By Brand/Price Tier
Chapter 9. North America Fish Hydrolysate Market
- 9.1 United States
- 9.2 Canada
- 9.3 Mexico
Chapter 10. Europe Fish Hydrolysate Market
- 10.1 Germany
- 10.2 France
- 10.3 Italy
- 10.4 United Kingdom
- 10.5 Spain
- 10.6 Poland
- 10.7 Russia
- 10.8 Netherlands
- 10.9 Belgium
- 10.10 Sweden
- 10.11 Denmark
- 10.12 Norway
- 10.13 Rest of Europe
Chapter 11. Asia Pacific Fish Hydrolysate Market
- 11.1 China
- 11.2 India
- 11.3 Japan
- 11.4 South Korea
- 11.5 Thailand
- 11.6 Indonesia
- 11.7 Vietnam
- 11.8 Malaysia
- 11.9 Australia
- 11.10 Rest of Asia Pacific
Chapter 12. Latin America Fish Hydrolysate Market
- 12.1 Brazil
- 12.2 Argentina
- 12.3 Colombia
- 12.4 Chile
- 12.5 Rest of Latin America
Chapter 13. Middle East Fish Hydrolysate Market
- 13.1 Saudi Arabia
- 13.2 United Arab Emirates
- 13.3 Turkey
- 13.4 Israel
- 13.5 Iran
- 13.6 Rest of the Middle East
Chapter 14. Africa Fish Hydrolysate Market
- 14.1 South Africa
- 14.2 Egypt
- 14.3 Nigeria
- 14.4 Morocco
- 14.5 Rest of Africa
Chapter 15. Fish Hydrolysate Company Profiles
- 15.1 [Company 01]
- 15.1.1 Company Overview
- 15.1.2 Key Management Personnel
- 15.1.3 Products & Services Portfolio
- 15.1.4 Financial Performance
- 15.1.5 Key Market Focus & Geographic Presence
- 15.1.6 Recent Developments & Strategic Initiatives
Note: The company profile list is preliminary and may change based on research findings, market developments, data availability, and client requirements.
Chapter 16. Appendices
- Appendix A – List of Abbreviations & Acronyms
- Appendix B – Industry Classification Code Reference – Full Series
- Appendix C – Production & Capacity Data Tables
- Appendix D – End-Use & Demand Base Tables
- Appendix E – Consumption & Replacement Rate Assumptions
- Appendix F – ASP Reference Tables
- Appendix G – Manufacturing & Facility Database
- Appendix H – Import-Export Data Tables
- Appendix I – Regulatory Summary Tables
- Appendix J – Primary Research Participant List (Anonymized)
- Appendix K – Primary Research Questionnaire Framework
- Appendix L – Data Sources & Bibliography
- Appendix M – Market Size Divergence & Source Comparison
Chapter 17. Research Methodology
- 17.1 Research Framework & Philosophy
- 17.2 Secondary Research – Sources, Hierarchy & Data Extraction
- 17.3 Data Modeling – Bottom-Up & Top-Down Market Sizing
- 17.4 Primary Research – Stakeholder Framework, LOI & Sample Sizes
- 17.5 Forecast Methodology – Regression, Scenario & Sensitivity Analysis
- 17.6 Quality Control – Four-Layer Validation Framework
- 17.7 Limitations & Standard Assumptions
- 17.8 Disclaimer
