Market Overview
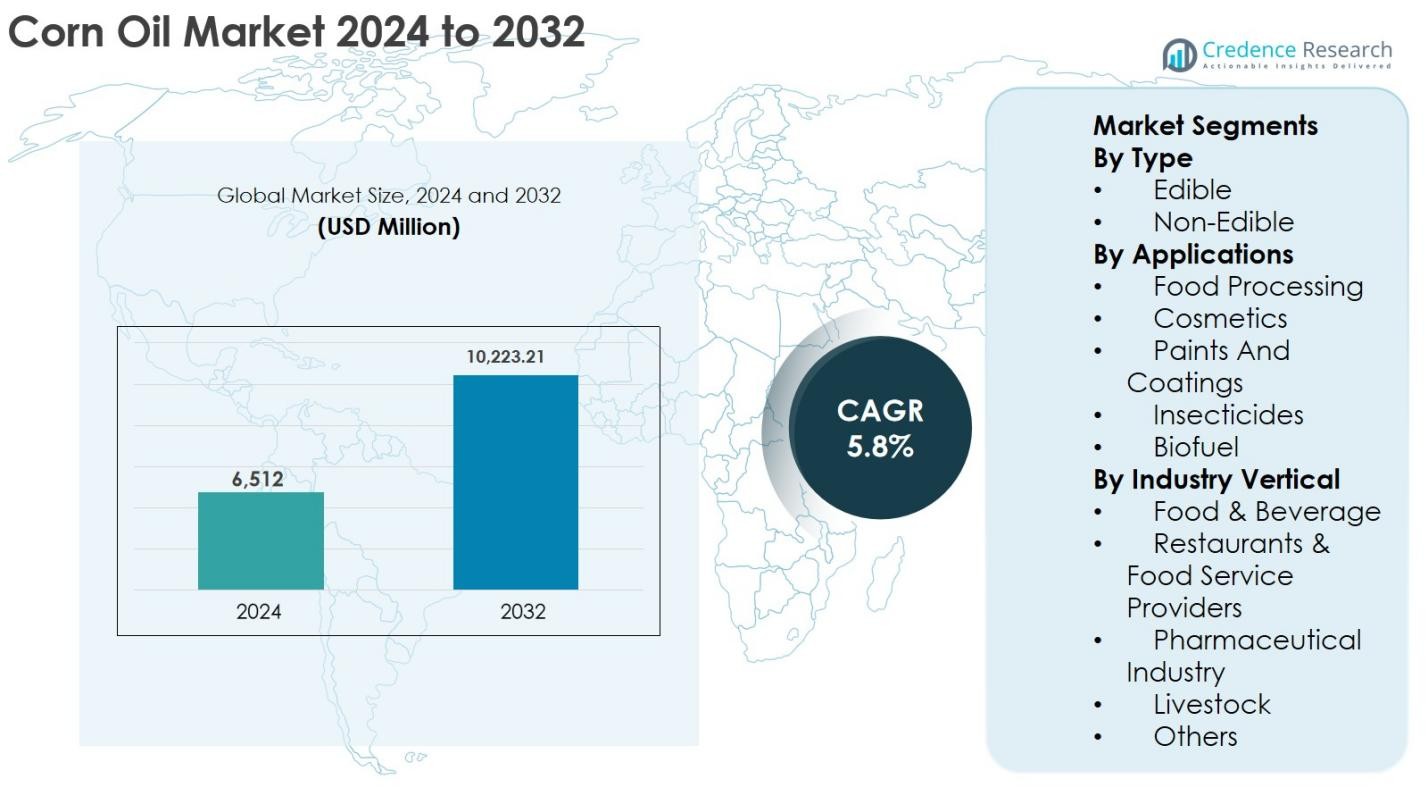
The Corn Oil Market size was valued at USD 6,512 million in 2024 and is anticipated to reach USD 10,223.21 million by 2032, growing at a CAGR of 5.8% during the forecast period.
| REPORT ATTRIBUTE |
DETAILS |
| Historical Period |
2020-2023 |
| Base Year |
2024 |
| Forecast Period |
2025-2032 |
| Corn Oil Market Size 2024 |
USD 6,512 Million |
| Corn Oil Market, CAGR |
5.8% |
| Corn Oil Market Size 2032 |
USD 10,223.21 Million |
The Corn Oil market is led by established agribusiness and edible oil manufacturers including Archer Daniels Midland Company, Cargill Incorporated, Wilmar International Ltd., ConAgra Brands, Inc., ACH Food Companies, Inc., Savola Group, IFFCO, Abu Dhabi Vegetable Oil Company, Qingdao Changsheng Group Co., Ltd., and Elburg Global, all of which compete through integrated supply chains, refining capabilities, and strong distribution networks. These players focus on product quality, clean-label positioning, and regional expansion to strengthen market presence. North America dominated the Corn Oil market with an exact market share of 36.8% in 2024, supported by abundant corn production, advanced processing infrastructure, and strong demand from food processing and biofuel applications, followed by Asia Pacific and Europe as key consumption and growth regions.
Access crucial information at unmatched prices!
Request your sample report today & start making informed decisions powered by Credence Research Inc.!
Download Sample
Market Insights
- The Corn Oil market was valued at USD 6,512 million in 2024 and is projected to reach USD 10,223.21 million by 2032, registering a CAGR of 5.8% during the forecast period.
- Growth in the Corn Oil market is driven by rising demand for plant-based and heart-healthy cooking oils, expanding processed food and foodservice industries, and increasing utilization in biofuel and industrial applications.
- Key trends in the Corn Oil market include growing preference for non-GMO and clean-label products, expanding consumption in emerging economies, and rising adoption of corn oil in biodiesel production and sustainable industrial uses.
- The Corn Oil market shows active competition among global and regional players focusing on vertical integration, refining capacity expansion, and branded retail offerings, while facing restraints from corn price volatility and strong competition from soybean and sunflower oils.
- Regionally, North America led the Corn Oil market with 36.8% share in 2024, followed by Asia Pacific at 27.6% and Europe at 24.1%, while by segment, edible corn oil dominated with 74.6% share, and food processing accounted for 58.2% of total demand.
 Market Segmentation Analysis:
By Type
The Corn Oil market by type is primarily driven by the Edible segment, which accounted for 74.6% market share in 2024, supported by its extensive use in household cooking and commercial food preparation. Edible corn oil benefits from a favorable fatty-acid profile, high smoke point, and cholesterol-lowering properties, making it suitable for frying, baking, and processed foods. Rising consumer preference for plant-based and heart-healthy oils, along with increasing urbanization and disposable income, continues to reinforce demand. The Non-Edible segment grows steadily due to industrial and bio-based applications but remains secondary.
- For instance, ACH Food Companies’ Mazola corn oil, marketed in North America as a heart‑healthy cooking oil, has been promoted for its ability to help lower cholesterol as part of a diet low in saturated fat and cholesterol, and ranks among the leading branded cooking oils in U.S. retail channels.
By Application
By application, Food Processing dominated the Corn Oil market with a market share of 58.2% in 2024, driven by large-scale consumption in snacks, ready-to-eat meals, bakery products, and frying operations. Corn oil’s neutral flavor, oxidative stability, and cost-effectiveness make it a preferred ingredient for food manufacturers. Growth is further supported by expanding packaged food consumption and quick-service restaurant chains. Other applications such as cosmetics, biofuel, insecticides, and paints and coatings are gaining traction due to sustainability initiatives, but food processing remains the core demand driver.
- For instance, Frito-Lay (PepsiCo) has reported using vegetable oils such as corn oil and sunflower oil in many of its potato chips and snack products in North America to improve flavor and frying performance.
By Industry Vertical
The Food & Beverage industry vertical led the Corn Oil market, capturing 61.4% market share in 2024, owing to its extensive use across processed foods, edible oils, and commercial kitchens. Increasing consumption of convenience foods, growth of foodservice outlets, and rising health awareness continue to fuel demand within this vertical. Restaurants and food service providers also contribute significantly due to high frying oil usage. Meanwhile, the pharmaceutical and livestock segments benefit from corn oil’s role as an excipient and energy-rich feed ingredient, supporting diversified end-use expansion.
Key Growth Drivers
Rising Demand for Plant-Based and Healthy Cooking Oils
The Corn Oil market is strongly driven by increasing consumer preference for plant-based and heart-healthy edible oils. Corn oil contains high levels of polyunsaturated fatty acids and phytosterols, which help reduce LDL cholesterol, making it attractive to health-conscious consumers. Growing awareness of cardiovascular health, combined with rising incidences of lifestyle-related diseases, has accelerated the shift away from animal fats toward vegetable oils. Urbanization, changing dietary patterns, and higher disposable incomes further support household and commercial adoption. Additionally, corn oil’s high smoke point and neutral taste enhance its suitability for frying and food processing, reinforcing demand across both retail and foodservice channels globally.
- For instance, Mazola (ACH Food Companies) has long marketed its 100% corn oil in the U.S. with an FDA-authorized heart health claim that it can help reduce cholesterol when replacing saturated fat, emphasizing its plant-based profile and phytosterol content.
Expansion of the Processed Food and Foodservice Industry
Rapid growth in the processed food sector and foodservice industry is a major driver for the Corn Oil market. Increasing consumption of ready-to-eat meals, packaged snacks, bakery products, and fried foods has significantly boosted industrial demand. Corn oil is widely preferred by food manufacturers due to its oxidative stability, cost efficiency, and compatibility with large-scale processing. The expansion of quick-service restaurants, cloud kitchens, and organized food retail chains, particularly in emerging economies, continues to elevate bulk consumption. Rising urban working populations and time-constrained lifestyles further support processed food demand, directly translating into sustained growth for corn oil across commercial applications.
- For instance, major quick-service restaurant suppliers in markets such as India and Southeast Asia procure large volumes of refined vegetable oils, including corn oil, for deep-frying and high-throughput cooking in franchise outlets and delivery-focused cloud kitchens.
Growing Use in Biofuel and Industrial Applications
The increasing adoption of corn oil in biofuel and industrial applications is another key growth driver. Crude corn oil extracted as a by-product of ethanol production is increasingly utilized as a sustainable feedstock for biodiesel manufacturing. Supportive government policies promoting renewable energy and carbon-reduction initiatives have encouraged biodiesel producers to integrate corn oil into fuel blends. Additionally, industrial uses in lubricants, insecticides, and coatings benefit from corn oil’s biodegradability and low toxicity. As sustainability regulations tighten across industries, demand for bio-based raw materials continues to rise, strengthening the long-term growth outlook for corn oil beyond edible applications.
Key Trends & Opportunities
Rising Demand from Emerging Economies
Emerging economies present significant growth opportunities for the Corn Oil market due to rapid population growth, urbanization, and evolving dietary habits. Increasing middle-class income levels and greater exposure to westernized food consumption patterns are driving higher demand for edible oils. Governments and food manufacturers in Asia-Pacific, Latin America, and the Middle East are expanding domestic refining and processing capacities to meet rising consumption. Additionally, improved retail infrastructure and expanding e-commerce platforms are enhancing product accessibility. As awareness of healthier cooking oils increases in these regions, corn oil manufacturers can capitalize on long-term volume growth and localized product offerings.
- For instance, Bunge Loders Croklaan and Cargill have expanded edible oil refining and packaging capabilities across Asia-Pacific and Latin America to serve growing demand from local food processors and consumers.
Product Innovation and Clean-Label Positioning
Product innovation and clean-label positioning represent a key opportunity in the Corn Oil market. Manufacturers are increasingly focusing on non-GMO, organic, and minimally processed corn oil variants to align with clean-label and transparency trends. Demand for traceable sourcing and sustainable production practices is influencing branding and packaging strategies. Fortified corn oil products enriched with vitamins and functional ingredients are also gaining traction. These innovations allow companies to differentiate offerings, command premium pricing, and strengthen brand loyalty. As regulatory scrutiny on food labeling increases, clean-label corn oil products are expected to gain wider acceptance across both retail and industrial segments.
- For instance, brands such as Mazola in North America highlight that their corn oil is cholesterol free and promote simple-ingredient positioning to appeal to label-conscious consumers.
Key Challenges
Price Volatility of Corn and Supply Chain Disruptions
One of the major challenges facing the Corn Oil market is the volatility in corn prices driven by fluctuating agricultural yields, climate conditions, and global trade dynamics. Corn is a key raw material, and price instability directly impacts production costs and profit margins. Weather-related risks, such as droughts and floods, can disrupt corn supply and reduce oil extraction efficiency. Additionally, geopolitical tensions and export restrictions can affect international trade flows. Supply chain disruptions, including transportation constraints and rising logistics costs, further intensify pricing pressures, making cost management and long-term sourcing strategies critical for market participants.
Intense Competition from Alternative Vegetable Oils
The Corn Oil market faces strong competition from alternative vegetable oils such as soybean, sunflower, canola, and palm oil. These oils often benefit from lower production costs, wider availability, or stronger consumer familiarity in certain regions. Price sensitivity among consumers and food manufacturers frequently leads to substitution based on cost advantages. Additionally, ongoing research and marketing around the health benefits of competing oils can dilute corn oil’s value proposition. To remain competitive, corn oil producers must invest in differentiation through quality, sustainability credentials, and functional benefits while managing pricing pressures in an increasingly competitive edible oil landscape.
Regional Analysis
North America
North America held the largest share of the Corn Oil market, accounting for 36.8% of global revenue in 2024, driven by high corn production, well-established processing infrastructure, and strong demand from food processing and biofuel industries. The United States dominates regional consumption due to extensive use of corn oil in packaged foods, frying applications, and ethanol-derived biodiesel. Growing health awareness and preference for plant-based oils further support retail demand. Additionally, favorable government policies promoting renewable fuels and sustainable raw materials continue to strengthen corn oil utilization across industrial and energy applications in the region.
Europe
Europe accounted for 24.1% market share in 2024, supported by steady demand from the food & beverage, pharmaceutical, and industrial sectors. The region emphasizes sustainable sourcing, clean-label products, and non-GMO ingredients, which aligns well with refined corn oil applications. Countries such as Germany, France, and the UK contribute significantly through food processing and bio-based industrial usage. Strict regulations on trans fats and increasing adoption of healthier edible oils have encouraged gradual substitution toward corn oil. However, competition from sunflower and rapeseed oils remains strong, moderating overall growth momentum.
Asia Pacific
Asia Pacific represented 27.6% of the Corn Oil market in 2024, making it the fastest-growing regional segment. Rapid urbanization, population growth, and rising disposable incomes are driving higher consumption of edible oils across China, India, Japan, and Southeast Asia. Expanding food processing industries, increasing demand for packaged foods, and growth of quick-service restaurants are key contributors. Additionally, rising awareness of healthier cooking oils supports corn oil adoption in urban households. Ongoing investments in refining capacity and improving distribution networks further enhance regional market expansion prospects.
Latin America
Latin America captured 7.1% market share in 2024, driven by growing food processing activities and increasing edible oil consumption. Brazil and Argentina lead regional demand due to expanding agricultural output and rising use of corn-based derivatives. The region benefits from improving economic conditions and gradual shifts toward healthier vegetable oils. Corn oil is increasingly utilized in industrial food production and livestock feed applications. However, market growth is partially constrained by strong competition from soybean oil, which is widely available and cost-competitive across Latin American countries.
Middle East & Africa
The Middle East & Africa accounted for 4.4% of the Corn Oil market in 2024, supported by rising food imports, population growth, and expanding foodservice sectors. Urbanization and changing dietary preferences are increasing demand for refined edible oils, particularly in Gulf Cooperation Council countries. Corn oil consumption is growing in food processing and commercial kitchens due to its frying stability. In Africa, gradual improvements in retail infrastructure and rising health awareness support market penetration. However, limited local production and price sensitivity continue to restrain faster adoption.
Market Segmentations:
By Type
By Applications
- Food Processing
- Cosmetics
- Paints And Coatings
- Insecticides
- Biofuel
By Industry Vertical
- Food & Beverage
- Restaurants & Food Service Providers
- Pharmaceutical Industry
- Livestock
- Others
By Geography
- North America
- Europe
- Germany
- France
- U.K.
- Italy
- Spain
- Rest of Europe
- Asia Pacific
- China
- Japan
- India
- South Korea
- South-east Asia
- Rest of Asia Pacific
- Latin America
- Brazil
- Argentina
- Rest of Latin America
- Middle East & Africa
- GCC Countries
- South Africa
- Rest of the Middle East and Africa
Competitive Landscape
The Corn Oil market features a moderately consolidated competitive landscape characterized by the presence of large multinational agribusinesses and regional edible oil producers competing on scale, product quality, and distribution reach. Leading players such as Archer Daniels Midland Company, Cargill Incorporated, Wilmar International Ltd., and ConAgra Brands, Inc. benefit from vertically integrated operations, extensive corn sourcing networks, and advanced refining capabilities, enabling cost efficiency and consistent supply. Companies including ACH Food Companies, Inc., Savola Group, IFFCO, and Abu Dhabi Vegetable Oil Company focus on strengthening regional presence through branded retail offerings and foodservice partnerships. Emerging participants such as Qingdao Changsheng Group Co., Ltd. and Elburg Global are expanding capacity and targeting industrial and export markets. Strategic initiatives across the market include investments in non-GMO and clean-label corn oil variants, expansion of refining facilities, and partnerships with food processors to capture rising demand from both edible and industrial applications.
Key Player Analysis
- Wilmar International Ltd.
- IFFCO
- Archer Daniels Midland Company
- Savola Group
- Qingdao Changsheng Group Co., Ltd.
- ConAgra Brands, Inc.
- Abu Dhabi Vegetable Oil Company
- Elburg Global
- Cargill Incorporated
- ACH Food Companies, Inc.
Recent Developments
- In November 2025, International Flavors & Fragrances Inc. (IFF) launched “OPTIMASH BOOST”, a second-generation enzyme mix designed to increase distillers’ corn oil (DCO) recovery in ethanol plants, improving yield and efficiency over previous solutions.
- In November 2025, Turnspire Capital Partners LLC and AgraMarke Quality Grains launched The LifeLine Group, an independent integrated producer of corn-based food products, renewable fuels and coproducts including corn oil, following their acquisition of LifeLine Foods and ICM Biofuels
- In February 2025, Cargill moved to fully acquire SJC Bioenergia in Brazil, reinforcing its presence in renewable energy and corn processing, including corn oil production, pending regulatory approval.
Shape Your Report to Specific Countries or Regions & Enjoy 30% Off!
Report Coverage
The research report offers an in-depth analysis based on Type, Application, Industry Vertical and Geography. It details leading market players, providing an overview of their business, product offerings, investments, revenue streams, and key applications. Additionally, the report includes insights into the competitive environment, SWOT analysis, current market trends, as well as the primary drivers and constraints. Furthermore, it discusses various factors that have driven market expansion in recent years. The report also explores market dynamics, regulatory scenarios, and technological advancements that are shaping the industry. It assesses the impact of external factors and global economic changes on market growth. Lastly, it provides strategic recommendations for new entrants and established companies to navigate the complexities of the market.
Future Outlook
- The Corn Oil market will witness steady growth supported by rising global consumption of plant-based and edible oils.
- Increasing health awareness will continue to drive preference for corn oil due to its cholesterol-lowering properties.
- Expansion of processed food and foodservice industries will sustain large-scale industrial demand.
- Growing urbanization and changing dietary habits in emerging economies will strengthen retail consumption.
- The biofuel sector will increasingly adopt corn oil as a sustainable feedstock for biodiesel production.
- Manufacturers will focus on non-GMO, clean-label, and organic corn oil variants to meet evolving consumer expectations.
- Investments in refining efficiency and supply chain optimization will improve cost competitiveness.
- Strategic partnerships with food processors and distributors will enhance market penetration.
- Regulatory support for renewable and bio-based products will create long-term growth opportunities.
- Competition from alternative vegetable oils will encourage innovation and differentiation across product offerings.


