
Market Overview
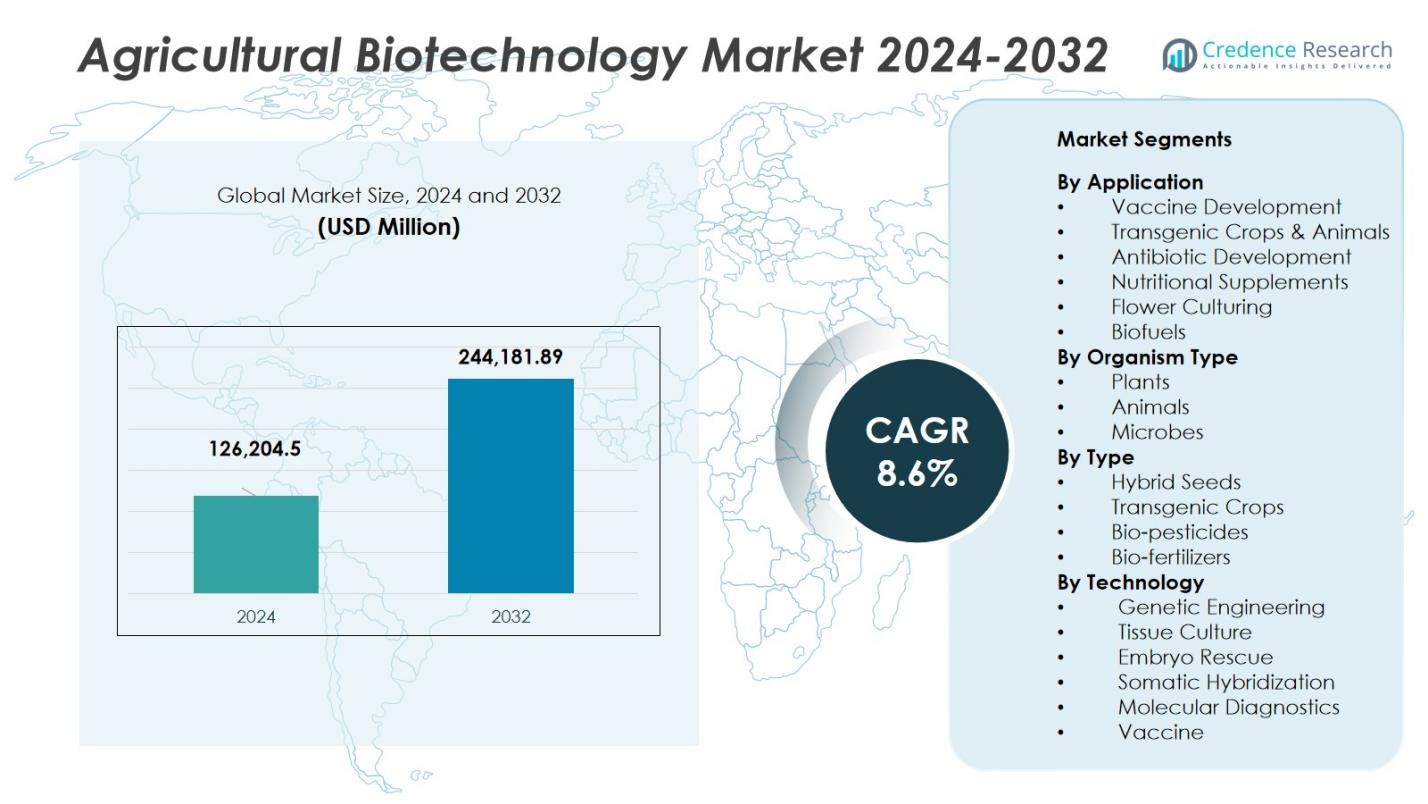
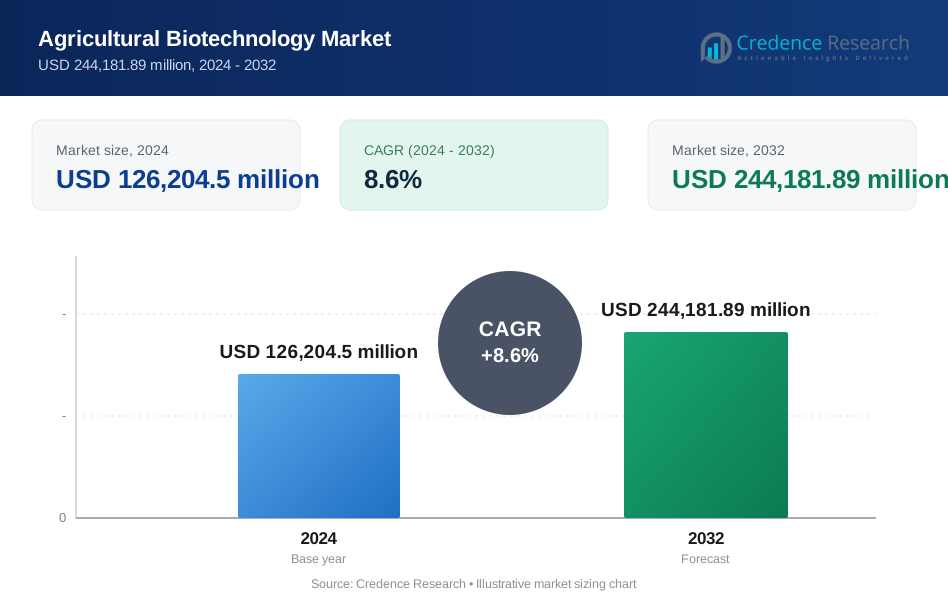
Agricultural Biotechnology Market size was valued at USD 126,204.5 Million in 2024 and is anticipated to reach USD 244,181.89 Million by 2032, at a CAGR of 8.6 % during the forecast period.
| REPORT ATTRIBUTE | DETAILS |
|---|---|
| Historical Period | 2020-2023 |
| Base Year | 2024 |
| Forecast Period | 2025-2032 |
| Agricultural Biotechnology Market Size 2024 | USD 126,204.5 Million |
| Agricultural Biotechnology Market, CAGR | 8.6 % |
| Agricultural Biotechnology Market Size 2032 | USD 244,181.89 Million |
The Agricultural Biotechnology Market is led by prominent companies such as BASF SE, Bayer AG, Corteva, Syngenta, DuPont, and Evogene, which dominate the sector through their extensive research and development capabilities and comprehensive portfolios of genetically modified crops, bio-pesticides, and bio-fertilizers. These companies focus on improving agricultural productivity, sustainability, and resistance to environmental stressors. North America holds the largest market share at 38.6% in 2024, driven by widespread adoption of biotech crops, favorable government policies, and significant investments in agricultural research. Europe and Asia-Pacific follow, with Europe adopting more cautious strategies due to regulatory barriers, while Asia-Pacific sees rapid growth, particularly in China and India, where biotech solutions are increasingly embraced for enhancing food security and crop productivity.
Market Insights
- The Agricultural Biotechnology Market was valued at USD 126,204.5 million in 2024 and is expected to reach USD 244,181.89 million by 2032, growing at a CAGR of 8.6% during the forecast period from 2025 to 2032.
- The rising demand for sustainable farming solutions, such as bio-pesticides, bio-fertilizers, and genetically modified crops, is a key driver of market growth.
- Increasing adoption of gene-editing technologies like CRISPR is one of the prominent trends shaping the market, particularly in improving crop resilience and nutritional value.
- Regulatory hurdles and public perception regarding genetically modified organisms (GMOs) continue to be significant restraints, slowing down the rate of market expansion in certain regions.
- North America dominates the market with a share of 38.6%, followed by Asia-Pacific with 25.1%, driven by rising biotech adoption in China and India, and Europe with 22.4% share.
Market Segmentation Analysis:
By Application
The Transgenic Crops & Animals sub‑segment holds the largest market share at 24.4% in 2024, driven by the widespread adoption of genetically modified crops with traits like herbicide tolerance and insect resistance. This growth is further supported by the demand for higher yields, increased productivity, and reduced reliance on chemical inputs. The Vaccine Development and Antibiotic Development sub-segments are also contributing to market growth, particularly in livestock health and disease resistance.
- For instance, Monsanto’s Roundup Ready soybeans are extensively cultivated for their resistance to glyphosate herbicide, enabling farmers to control weeds more efficiently and reduce crop losses.
By Organism Type
The Plants sub‑segment is the dominant player in the Agricultural Biotechnology Market with a share of 42.1% in 2024. This is largely driven by the use of biotech in staple crops like corn, soy, and cotton to improve yield, resilience, and nutritional content. The Animals sub‑segment is growing significantly as biotechnology helps enhance livestock productivity and reduce disease. The Microbes sub‑segment, although smaller, is emerging rapidly due to the increasing demand for sustainable solutions such as bio-pesticides and bio-fertilizers.
- For instance, NRGene introduced ToBRFV-HR tomato seeds with enhanced disease resistance, while Cibus has advanced canola and rice hybrids for Latin America, improving crop resilience and yield.
By Type
In terms of product type, Hybrid Seeds holds the largest share at 30% in 2023, driven by the demand for high-yield, climate-resistant seeds. The Transgenic Crops sub‑segment follows closely, with its growth underpinned by the adoption of genetically modified traits. Additionally, the Bio-fertilizers sub-segment, which accounts for 26% of the market, is expanding rapidly as farmers increasingly seek environmentally sustainable agricultural practices. Bio-pesticides are also gaining traction due to the growing restrictions on synthetic chemicals.
Key Growth Drivers
Rising Demand for Sustainable Agricultural Practices
One of the major growth drivers in the Agricultural Biotechnology Market is the increasing demand for sustainable farming solutions. With a growing global population and limited arable land, there is a need for high-yielding, climate-resilient crops. Biotech solutions like genetically modified (GM) crops, bio-fertilizers, and bio-pesticides enable farmers to reduce their reliance on chemical inputs and optimize resource use. This shift towards sustainable practices is fueled by environmental concerns, government regulations, and consumer preference for eco-friendly food production methods.
- For instance, Pivot Bio launched microbial strains tailored for cereal crops like maize and wheat that enhance nitrogen fixation, reducing synthetic fertilizer use significantly while maintaining yields.
Advancements in Genetic Engineering Technologies
The continuous advancements in genetic engineering and gene editing technologies are significantly contributing to the growth of the agricultural biotechnology market. Techniques such as CRISPR-Cas9 have opened new avenues for precise gene modification, allowing for the creation of crops with improved nutritional profiles, enhanced pest resistance, and tolerance to environmental stress. These technologies enable the rapid development of high-performing agricultural products, fostering innovation in the sector and attracting substantial investment from both private and public sectors.
- For instance, DuPont has developed novel maize variants using CRISPR that exhibit improved drought tolerance and higher grain yields under field conditions during dry seasons.
Supportive Government Policies and Investments
Government policies and investments in agricultural biotechnology are key drivers of market growth. Many governments worldwide are prioritizing biotechnology as a strategic tool to improve food security, sustainability, and agricultural productivity. Policies supporting research and development in biotech, along with subsidies for bio-based agricultural solutions, have created a favorable environment for market expansion. As governments allocate more funding for agricultural innovation, the adoption of biotech solutions accelerates, particularly in regions with pressing food security concerns and climate challenges.
Key Trends & Opportunities
Growth of Bio-Based Crop Protection Solutions
The shift towards bio-pesticides and bio-fertilizers is one of the key trends shaping the agricultural biotechnology market. As concerns over the harmful effects of chemical pesticides grow, farmers are increasingly turning to biopesticides as an alternative for crop protection. These bio-based solutions offer effective pest control while minimizing environmental damage. The rising consumer demand for organic and sustainably grown produce further drives the adoption of bio-pesticides and bio-fertilizers, presenting a significant opportunity for market growth in the coming years.
- For instance, Corteva Agriscience has introduced several environmentally friendly crop protection products, including microbial strains that naturally protect crops, reflecting a broader industry shift toward biological solutions.
Expanding Use of Biotechnology in Livestock Farming
Biotechnology's applications in livestock farming are gaining significant traction. Genetic modifications and advancements in animal health solutions, such as vaccines and disease-resistant breeds, are improving livestock productivity and reducing the need for antibiotics. This is particularly relevant with rising consumer demand for antibiotic-free meat and dairy products. The ability to develop genetically enhanced animals for higher yields and better disease resistance presents a promising opportunity for the agricultural biotechnology market to expand, especially in the meat production sector.
- For instance, Cellecta, Inc. designs CRISPR libraries for livestock, enabling genome-wide knockout screens to identify key genetic traits related to disease resistance and productivity, assisting in precise genetic modifications.
Key Challenges
Regulatory Hurdles and Public Perception
One of the primary challenges facing the agricultural biotechnology market is regulatory approval and public perception. The commercialization of genetically modified organisms (GMOs) and biotech products often faces stringent regulatory processes, particularly in regions like Europe. Public skepticism and concerns about the safety of GMOs also present barriers to widespread adoption. These challenges slow down market entry for new biotech products and may limit growth opportunities in certain regions, requiring companies to invest in educational campaigns and more transparent regulatory processes.
High Research and Development Costs
The high costs associated with research and development (R&D) in agricultural biotechnology pose a significant challenge to market expansion. Developing new biotech products, especially genetically modified crops and innovative biotech solutions, requires substantial investment in time, expertise, and financial resources. Smaller companies may struggle to bear these costs, which could hinder innovation and the introduction of affordable solutions in the market. Additionally, long timelines for regulatory approval further compound these financial challenges, potentially delaying returns on investment for biotech firms.
Regional Analysis
North America
North America holds a dominant position in the Agricultural Biotechnology Market, with a market share of 38.6% in 2024. The region’s leadership is primarily attributed to the United States, where biotech crops and genetically modified seeds are widely adopted. Strong research and development infrastructure, along with significant investments in agricultural biotechnology by leading companies, contribute to this growth. Additionally, favorable government policies and high consumer demand for sustainable and organic farming solutions further boost market expansion in the region. North America is expected to maintain its leadership throughout the forecast period, driven by technological innovations and regulatory support.
Europe
Europe represents a significant share of the Agricultural Biotechnology Market, with a market share of 22.4% in 2024. The region has a cautious approach to biotechnology, driven by stringent regulations and consumer skepticism towards genetically modified organisms (GMOs). However, certain countries like Spain and the UK have seen increased adoption of biotech crops, particularly in the areas of bio-pesticides and bio-fertilizers. While regulatory barriers limit full market potential, Europe’s focus on sustainable agricultural practices and environmental concerns is expected to foster growth in biotech solutions that align with eco-friendly farming practices.
Asia-Pacific
Asia-Pacific is witnessing rapid growth in the Agricultural Biotechnology Market, with a market share of 25.1% in 2024. The region’s growth is fueled by increasing agricultural demands in countries like China, India, and Japan, where the adoption of biotech crops such as Bt cotton and genetically modified rice is growing steadily. The rising need for food security, combined with government-backed initiatives to promote biotech solutions, is propelling market expansion. Furthermore, Asia-Pacific is becoming a key region for R&D activities, with several biotech startups emerging to cater to the region’s evolving agricultural needs.
Latin America
Latin America holds a significant share of the Agricultural Biotechnology Market, accounting for 8.7% in 2024. The region is a major adopter of genetically modified crops, particularly in countries like Brazil and Argentina, where biotech crops such as soybeans and corn are widely cultivated. The region benefits from favorable climatic conditions and government policies that support biotech farming. Additionally, the demand for sustainable agricultural practices and the growing need for increased crop yields are key factors driving the adoption of agricultural biotechnology. Latin America is expected to see continued market growth, especially in crop protection and bio-pesticide solutions.
Middle East & Africa
The Middle East & Africa region holds a market share of 5.2% in 2024 within the Agricultural Biotechnology Market. The market here is primarily driven by increasing efforts to enhance food security in water-scarce regions, where biotechnology can play a crucial role in developing drought-resistant and high-yield crops. While adoption of biotechnology is still emerging, countries like South Africa have seen early success with biotech crops. Government initiatives aimed at boosting agricultural productivity, along with growing interest in sustainable farming, are expected to drive market growth in the region, particularly in bio-fertilizers and crop protection.
Market Segmentations:
By Application
- Vaccine Development
- Transgenic Crops & Animals
- Antibiotic Development
- Nutritional Supplements
- Flower Culturing
- Biofuels
By Organism Type
- Plants
- Animals
- Microbes
By Type
- Hybrid Seeds
- Transgenic Crops
- Bio-pesticides
- Bio-fertilizers
By Technology
- Genetic Engineering
- Tissue Culture
- Embryo Rescue
- Somatic Hybridization
- Molecular Diagnostics
- Vaccine
By Region
- North America
- U.S.
- Canada
- Mexico
- Europe
- Germany
- France
- U.K.
- Italy
- Spain
- Rest of Europe
- Asia Pacific
- China
- Japan
- India
- South Korea
- South-east Asia
- Rest of Asia Pacific
- Latin America
- Brazil
- Argentina
- Rest of Latin America
- Middle East & Africa
- GCC Countries
- South Africa
- Rest of the Middle East and Africa
Competitive Landscape
The Agricultural Biotechnology Market is highly competitive, with major players such as BASF SE, Bayer AG, Corteva, Syngenta, and DuPont leading the industry. These companies dominate the market through extensive research and development capabilities, strategic partnerships, and product innovation. BASF SE, for instance, focuses on enhancing crop protection and seed treatment technologies, while Bayer AG leads in genetic crop improvements and sustainable farming solutions. Corteva specializes in hybrid seeds and agricultural chemicals, aiming to improve crop yields and reduce environmental impact. Syngenta focuses on biotech solutions for pest control and plant health, while DuPont offers advanced biotech solutions through its subsidiary Pioneer. In addition to these established players, there is a growing presence of smaller biotech firms focused on innovative solutions like bio-pesticides, bio-fertilizers, and gene editing technologies. The competitive landscape is further shaped by collaborations between public research institutions and private companies, as well as an increasing number of startups targeting niche markets in sustainable agriculture and environmental protection.
Key Player Analysis
- DuPont
- BASF SE
- Syngenta
- Corteva
- Bayer AG
- Isagro SPA
- Benson Hill
- Evogene
- ADAMA Agriculture Solution
- Vilmorin
Recent Developments
- In November 2025, Rallis India Limited launched NuCode™, a dedicated brand for advanced biological solutions aimed at improving soil and plant health.
- In November 2025, Valent BioSciences LLC and Seipasa formed a strategic partnership to commercialize Seipasa’s biostimulant Sweetsei™ in the U.S. market.
- In November 2025, Ginkgo Bioworks extended its multi‑year strategic partnership with Bayer AG to continue developing microbial nitrogen‑fixation and agricultural biologicals.
Report Coverage
The research report offers an in-depth analysis based on Application, Organism Type, Type, Technology and Region. It details leading market players, providing an overview of their business, product offerings, investments, revenue streams, and key applications. Additionally, the report includes insights into the competitive environment, SWOT analysis, current market trends, as well as the primary drivers and constraints. Furthermore, it discusses various factors that have driven market expansion in recent years. The report also explores market dynamics, regulatory scenarios, and technological advancements that are shaping the industry. It assesses the impact of external factors and global economic changes on market growth. Lastly, it provides strategic recommendations for new entrants and established companies to navigate the complexities of the market.
Future Outlook
- The Agricultural Biotechnology Market is expected to continue growing due to increasing demand for sustainable farming solutions and higher crop yields.
- Advances in gene editing technologies, such as CRISPR, will drive innovation in crop improvement, enabling the development of more resilient and nutrient-rich crops.
- Biotech applications in livestock farming, including disease resistance and improved productivity, will gain significant traction, boosting the market’s overall growth.
- The rising focus on reducing chemical use in agriculture will accelerate the adoption of bio-pesticides, bio-fertilizers, and other eco-friendly biotech solutions.
- Increased government support and funding for agricultural biotech research will contribute to the development of new solutions to address global food security challenges.
- Consumer preferences for organic and sustainably grown produce will push the demand for biotech solutions that align with these trends.
- Regulatory frameworks in key markets will evolve to accommodate more biotech innovations, particularly in the areas of genetically modified crops and gene-edited organisms.
- The Asia-Pacific region will continue to be a key growth driver, with countries like China and India adopting biotechnology to enhance crop productivity and food security.
- Collaboration between private companies and public research institutions will foster more rapid advancements and commercialization of biotech products.
- As biotechnology in agriculture matures, the market will see increased consolidation, with large players expanding their portfolios through acquisitions and partnerships.
Request a Free Sample
Fill in your details and we'll send you a free sample report.
- Sample data tables & charts
- Research methodology
Need a Custom Version of This Report?
Tailor the scope, geography, or segments to your exact requirements.
- Custom geography or segment scope
- Direct access to our analyst team
Frequently Asked Questions
What is the current market size for the Agricultural Biotechnology Market, and what is its projected size in 2032?
At what Compound Annual Growth Rate is the Agricultural Biotechnology Market projected to grow between 2025 and 2032?
Which Agricultural Biotechnology Market segment held the largest share in 2024?
What are the primary factors fueling the growth of the Agricultural Biotechnology Market?
Who are the leading companies in the Agricultural Biotechnology Market?
Which region commanded the largest share of the Agricultural Biotechnology Market in 2024?
Table of Content
Chapter 1. Report Introduction
- 1.1 Report Description & Purpose
- 1.1.1 Report Title & Market Definition
- 1.1.2 Unique Selling Propositions (USP) & Key Differentiators
- 1.1.3 Value Proposition for Stakeholders
- 1.2 Research Objectives
- 1.2.1 Market Sizing Objectives (Volume & Revenue)
- 1.2.2 Segmentation Objectives
- 1.2.3 Competitive Intelligence Objectives
- 1.2.4 Forecast & Scenario Objectives
- 1.3 Report Scope
- 1.3.1 Agricultural Biotechnology Scope – Types & Subtypes Covered
- 1.3.2 Geographic Scope – Regions & Countries Covered
- 1.3.3 Historical Period, Base Year & Forecast Period (2024; forecast to 2032)
- 1.3.4 Inclusions & Exclusions
- 1.4 HS Code & Classification Framework
- 1.5 Currency, Units & Pricing Basis
- 1.6 Target Stakeholders
- 1.7 Limitations & Assumptions
Chapter 2. Executive Summary
- 2.1 Global Agricultural Biotechnology Market Snapshot
- 2.1.1 Market Size – Historical (2024) & Forecast (2024-2032) (2024: USD 126,204.5 million → 2032: USD 244,181.89 million)
- 2.1.2 Volume & Revenue – Global Totals
- 2.1.3 Key Market Highlights – Top Five Facts
- 2.2 Agricultural Biotechnology Market Segmentation Snapshot
- 2.2.1 Market Split by Region – 2024 vs. 2032
- 2.3 Competitive Snapshot
- 2.3.1 Top 10 Players by Revenue Share – 2024
- 2.3.2 Top 10 Players by Volume Share – 2024
- 2.3.3 Recent Strategic Developments (18-Month Summary)
- 2.4 Key Investment Highlights & Strategic Conclusions
Chapter 3. Agricultural Biotechnology Market Dynamics & Industry Analysis
- 3.1 Market Overview & Context
- 3.1.1 Agricultural Biotechnology Market Position in the Broader Automotive Value Chain
- 3.1.2 OEM vs. Replacement Market Dynamics
- 3.1.3 Market Maturity & Development Stage by Region
- 3.2 Agricultural Biotechnology Market Drivers
- 3.3 Agricultural Biotechnology Market Restraints & Challenges
- 3.4 Agricultural Biotechnology Market Opportunities
- 3.5 Porter's Five Forces Analysis
- 3.5.1 Threat of New Entrants
- 3.5.2 Bargaining Power of Suppliers
- 3.5.3 Bargaining Power of Buyers
- 3.5.4 Threat of Substitutes
- 3.5.5 Competitive Rivalry – Intensity Assessment
- 3.6 Agricultural Biotechnology Value Chain Analysis
- 3.6.1 Upstream – Raw Material/Input Suppliers
- 3.6.1.1 Raw Material/Input 1
- 3.6.1.2 Raw Material/Input 2
- 3.6.1.3 Raw Material/Input 3
- 3.6.2 Midstream – Production/Manufacturing/Service Delivery
- 3.6.2.1 Production/Process Overview
- 3.6.2.2 Key Facility Locations & Capacity by Manufacturer
- 3.6.3 Downstream – Distribution & End Consumer
- 3.6.3.1 Primary Channel – B2B/OEM
- 3.6.3.2 Secondary Channels – Dealer, Retail, Online, Direct
- 3.6.4 Value Chain Profitability Analysis
- 3.6.1 Upstream – Raw Material/Input Suppliers
- 3.7 PESTEL Analysis
- 3.7.1 Political Factors
- 3.7.2 Economic Factors
- 3.7.3 Social Factors
- 3.7.4 Technological Factors
- 3.7.5 Environmental Factors
- 3.7.6 Legal Factors
- 3.8 Agricultural Biotechnology Supply Chain Analysis
- 3.8.1 Raw Material/Input Supply Risk Assessment
- 3.8.2 Manufacturing Concentration Risk (Geographic Exposure)
- 3.8.3 Trade Disruption Impact Analysis
- 3.9 Regulatory & Policy Landscape
Note: The regulatory and policy landscape section covers regulations based on their applicability to the market, Agricultural Biotechnology category, geography, and scope of the study. Only regulatory frameworks with a material impact on operations, compliance, trade, sustainability, or market access are analyzed in detail.
Chapter 4. Key Investment Pockets & Opportunity Analysis
- 4.1 Agricultural Biotechnology Market Attractiveness Analysis
- 4.1.1 By Region – Investment Attractiveness Matrix (Volume × CAGR)
- 4.2 Absolute Revenue Growth Opportunity
- 4.2.1 By Region – Absolute USD Growth Through 2032
- 4.3 Incremental Volume Opportunity
- 4.3.1 By Region – Incremental Volume Through 2032
- 4.3.2 Segment – Incremental Volume
- 4.4 Emerging Submarket Opportunity Deep Dive (Subject to Applicability)
- 4.5 Emerging Market Opportunity Scorecards
- 4.5.1 United States
- 4.5.2 Europe
- 4.5.3 Asia
- 4.5.4 Middle East & Africa
Note: Emerging Market Opportunity Scorecards will be included based on relevance and strategic importance. Regions listed are indicative and may vary depending on data availability and market dynamics.
Chapter 5. Agricultural Biotechnology Import-Export Analysis & Trade Flows
- 5.1 Global Trade Overview
- 5.1.1 Global Export Value by Country (2024)
- 5.1.2 Global Export Volume by Country (2024)
- 5.1.3 Global Import Value by Country (2024)
- 5.1.4 Global Import Volume by Country (2024)
- 5.1.5 Net Trade Balance by Country (2024)
- 5.2 Export Analysis – Segment
- 5.2.1 Type 1 (HS Code)
- 5.2.2 Type 2 (HS Code)
- 5.2.3 Type 3 (HS Code)
- 5.2.4 Type 4 (HS Code)
- 5.2.5 Type 5 (HS Code)
- 5.3 Import Analysis – Segment
- 5.3.1 Type 1 (HS Code)
- 5.3.2 Type 2 (HS Code)
- 5.3.3 Type 3 (HS Code)
- 5.3.4 Type 4 (HS Code)
- 5.3.5 Type 5 (HS Code)
- 5.4 Average Unit Trade Prices
- 5.4.1 Average Export Price – Segment & Country
- 5.4.2 Average Import Price – Segment & Source Country
- 5.4.3 Price Trends (2024)
- 5.5 Key Trade Route Analysis
- 5.5.1 Trade Route 1
- 5.5.2 Trade Route 2
- 5.5.3 Trade Route 3
- 5.5.4 Trade Route 4
- 5.5.5 Trade Route 5
- 5.6 Trade Policy Impact Assessment
- 5.6.1 US Anti-Dumping & Section 301 Tariffs
- 5.6.2 EU Customs Union Impact
- 5.6.3 Major Free Trade Agreements
- 5.6.4 USMCA Rules of Origin
Note: Trade policy analysis will be included only where relevant to the Agricultural Biotechnology market.
Chapter 6. Competitive Landscape & Company Benchmarking
- 6.1 Agricultural Biotechnology Market Concentration & Structure
- 6.1.1 Herfindahl-Hirschman Index (HHI) – vs. 2024
- 6.1.2 Tier 1, Tier 2 & Tier 3 Market Structure
- 6.1.3 Global, Regional & Local Player Dynamics
- 6.2 Agricultural Biotechnology Market Share Analysis – 2024
- 6.2.1 Global Revenue Share by Company
- 6.2.2 Global Volume Share by Company
- 6.2.3 Regional Revenue Share
- 6.2.4 Market Share Evolution ( vs. 2024)
- 6.2.5 OEM Segment Share by Company
- 6.2.6 Replacement Segment Share by Company
- 6.3 Production/Delivery Capacity & Facility Analysis
- 6.3.1 Global Installed Capacity
- 6.3.2 Capacity Utilization Rates
- 6.3.3 Production/Output Volume
- 6.3.4 Facility Locations & Capacity Map
- 6.3.5 Planned Capacity Additions
- 6.4 Agricultural Biotechnology Competitive Benchmarking Matrix
- 6.4.1 Revenue, Volume, CAGR & Profitability Comparison
- 6.4.2 Channel Revenue Mix
- 6.4.3 Geographic Revenue Exposure
- 6.4.4 R&D Intensity
- 6.4.5 Sustainability Maturity
- 6.5 Strategic Developments in Agricultural Biotechnology (Last 24 Months)
- 6.5.1 Mergers, Acquisitions & Divestments
- 6.5.2 New Agricultural Biotechnology Launches
- 6.5.3 Facility Expansions
- 6.5.4 Strategic Alliances, Joint Ventures & Partnerships
- 6.5.5 Distribution Expansion & Market Entry
- 6.5.6 Sustainability & ESG Initiatives
- 6.6 Competitive Strategy Mapping
- 6.6.1 Leader, Challenger, Follower & Niche Classification
- 6.6.2 Pricing Strategy Comparison
- 6.6.3 Channel Strategy Matrix
Note: Strategic developments are included based on their materiality and the availability of reliable information.
Chapter 7. Global Agricultural Biotechnology Market – By Distribution Channel
- 7.1 Segment Overview
- 7.1.1 Volume & Revenue Split by Channel (2024 & 2032)
- 7.1.2 Channel Mix Evolution (2024-2032)
Chapter 8. Regional Market Analysis – Global Overview
- 8.1 Global Regional Overview
- 8.1.1 Regional Volume Share
- 8.1.2 Regional Revenue Share
- 8.1.3 Regional Volume by Region
- 8.1.4 Regional Revenue by Region
- 8.1.5 Regional Forecast Through 2032
- 8.2 Cross-Regional Segment Analysis
- 8.2.1 By Distribution Channel
- 8.2.2 By Brand/Price Tier
Chapter 9. North America Agricultural Biotechnology Market
- 9.1 United States
- 9.2 Canada
- 9.3 Mexico
Chapter 10. Europe Agricultural Biotechnology Market
- 10.1 Germany
- 10.2 France
- 10.3 Italy
- 10.4 United Kingdom
- 10.5 Spain
- 10.6 Poland
- 10.7 Russia
- 10.8 Netherlands
- 10.9 Belgium
- 10.10 Sweden
- 10.11 Denmark
- 10.12 Norway
- 10.13 Rest of Europe
Chapter 11. Asia Pacific Agricultural Biotechnology Market
- 11.1 China
- 11.2 India
- 11.3 Japan
- 11.4 South Korea
- 11.5 Thailand
- 11.6 Indonesia
- 11.7 Vietnam
- 11.8 Malaysia
- 11.9 Australia
- 11.10 Rest of Asia Pacific
Chapter 12. Latin America Agricultural Biotechnology Market
- 12.1 Brazil
- 12.2 Argentina
- 12.3 Colombia
- 12.4 Chile
- 12.5 Rest of Latin America
Chapter 13. Middle East Agricultural Biotechnology Market
- 13.1 Saudi Arabia
- 13.2 United Arab Emirates
- 13.3 Turkey
- 13.4 Israel
- 13.5 Iran
- 13.6 Rest of the Middle East
Chapter 14. Africa Agricultural Biotechnology Market
- 14.1 South Africa
- 14.2 Egypt
- 14.3 Nigeria
- 14.4 Morocco
- 14.5 Rest of Africa
Chapter 15. Agricultural Biotechnology Company Profiles
- 15.1 [Company 01]
- 15.1.1 Company Overview
- 15.1.2 Key Management Personnel
- 15.1.3 Products & Services Portfolio
- 15.1.4 Financial Performance
- 15.1.5 Key Market Focus & Geographic Presence
- 15.1.6 Recent Developments & Strategic Initiatives
Note: The company profile list is preliminary and may change based on research findings, market developments, data availability, and client requirements.
Chapter 16. Appendices
- Appendix A – List of Abbreviations & Acronyms
- Appendix B – Industry Classification Code Reference – Full Series
- Appendix C – Production & Capacity Data Tables
- Appendix D – End-Use & Demand Base Tables
- Appendix E – Consumption & Replacement Rate Assumptions
- Appendix F – ASP Reference Tables
- Appendix G – Manufacturing & Facility Database
- Appendix H – Import-Export Data Tables
- Appendix I – Regulatory Summary Tables
- Appendix J – Primary Research Participant List (Anonymized)
- Appendix K – Primary Research Questionnaire Framework
- Appendix L – Data Sources & Bibliography
- Appendix M – Market Size Divergence & Source Comparison
Chapter 17. Research Methodology
- 17.1 Research Framework & Philosophy
- 17.2 Secondary Research – Sources, Hierarchy & Data Extraction
- 17.3 Data Modeling – Bottom-Up & Top-Down Market Sizing
- 17.4 Primary Research – Stakeholder Framework, LOI & Sample Sizes
- 17.5 Forecast Methodology – Regression, Scenario & Sensitivity Analysis
- 17.6 Quality Control – Four-Layer Validation Framework
- 17.7 Limitations & Standard Assumptions
- 17.8 Disclaimer
