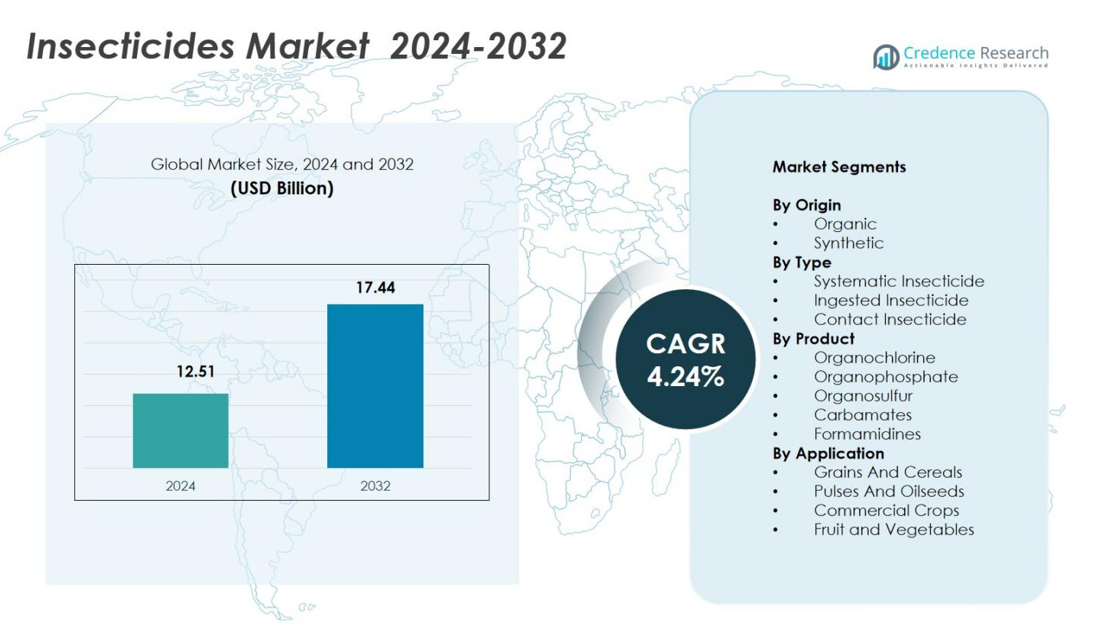
Home » Chemicals » Insecticides Market

Insecticides Market By Crop Type (Cereals & grains, Oilseeds & pulses, Fruits & vegetables, Other crop types) By Formulation (Wettable Powder, Emulsifiable concentrate, Suspension concentrate, Oil emulsion in water, Microencapsulated suspension, Granules, Other formulations) By Form (Sprays, Bailts, Strips)-Growth, Future Prospects & Competitive Analysis, 2016 – 2030

Price: $4999

Published: | Report ID: 6695 | Report Format : PDF

Key Highlights of the Report

The global insecticides market is segmented by type, crop type, formulation, form, and region. Organophosphorus-based insecticides category is the most popular, while the cereals & grains category is the primary crop type segment. In addition, the emulsifiable concentrate category held the largest share in the formulation segment. The sprays category is the most common form of insecticides, with Asia Pacific leading the market growth.

During the forecast period, the agriculture sector is anticipated to expand due to the rising global food demand. The increasing rise in food consumption brought on by the expanding population drives considerable insecticide market growth.

Nonetheless, the Asia Pacific insecticide market is predicted to grow at the greatest CAGR because of the rise in resistant pests, the need for more food, and the region’s need for higher agricultural production.

Market Overview

The global insecticides market has witnessed steady growth in recent years and is expected to continue growing at a CAGR of 4.80% between 2023 and 2030. The market was valued at USD 8.9 billion in 2022 and is expected to reach USD 12.4 billion in 2030.

What Are The Main Drivers Of The Global Insecticides Market?

One of the main factors propelling the expansion of the insecticides industry is the increase in pressure to meet rising consumer food demand as a result of the vast global population.

What Are The Major Challenges Faced By The Global Insecticides Market?

Insecticide market growth is anticipated to be hampered by the implementation of strict government regulations and rising worries about insect resistance.

What Are The Growth Opportunities In The Global Insecticides Market?

The projected period has lucrative prospects for the insecticides market players due to the rising demand in emerging countries, adopting integrated pest management (IPM), and research & development programs to launch new products.

Design Element 2

Access crucial information at unmatched prices!

Request your free sample report today & start making informed decisions powered by Credence Research!

Download Free Sample
CTA Design Element 3

Executive Summary

Overview of the Global Insecticides Market

The market for insecticides is expanding faster than average due to the growing regulatory interventions for safe farming practices, the need to ensure food quality in the agricultural sector, and the need to increase food security. The insecticide market is also influenced by the rise in insecticide use, which boosts agricultural output and quality while reducing losses brought on by insect infestations. Additionally, declining arable land, adoption of contemporary farming methods, advancements in agrochemical goods, developing technology, and high returns on investment favorably impact the insecticides market.

Market Definition

Insecticides are a class of pesticides used to eradicate insects that harm crops. Insecticides of all types, including organic, inorganic, and repellent and non-repellent varieties, are available on the market. These goods are widely applied in agriculture, medicine, industry, and domestic use.

Market Insights

  • The global demand for insecticides was valued at USD 8.9 Billion in 2022 and is expected to reach USD 12.4 Billion in 2030, growing at a CAGR of 4.80% between 2023 and 2030.
  • In terms of value, the organophosphorus category led the market and accounted for almost 42% of sales in 2022. The botanicals category is expected to increase at the fastest rate.
  • The cereals & grains category is expected to continue to dominate the insecticides market through 2022, with a massive market share of over 35% predicted.
  • The suspension concentrate category led the market in 2022.
  • The insecticides market is expected to be dominated by the sprays category, with 49% of market share over the forecast period.
  • In 2022, Asia Pacific will account for roughly one-third of the global insecticide market, with the remaining 50% split between North America and Europe.
  • The increased need to meet expanding consumer food demand due to the enormous worldwide population is one of the primary drivers of the pesticide industry’s rise.
  • The Asia Pacific insecticides industry is predicted to expand faster due to the region’s expanding agricultural industry, increasing economy, uneven pesticide usage laws between nations, vast climatic variances, significant plant diversity, and ongoing technical improvements.

Insecticides Market

Segmentation by Type

  • With almost 42% of the market share for insecticides, the organophosphorus category remained the top rank in terms of type in 2022.
  • The global insecticides market is expected to experience the quickest growth throughout the projected period in the botanicals category.

Segmentation by Crop Type

  • With a market share of over 35% in 2022, the cereals & grains segment led the global insecticides market.
  • Throughout the projection period, the fruits & vegetables category is expected to register the fastest CAGR.

Segmentation by Formulation

  • The suspension concentrate segment led the insecticides market with a market share of over 25% in 2022.
  • The granules category is anticipated to register the highest CAGR over the forecast period.

Segmentation by Form

  • The sprays category held the highest share, with over 49% of the insecticide market share 2022.
  • Over the forecast period, it is predicted that the strips segment will be the fastest-growing.

Segmentation by Region

  • Asia Pacific region held the largest global insecticide market share in 2022.
  • In 2022, North America will occupy more than 35% of the global insecticides market, with Europe accounting for just under 24% of the total.
  • The rest of the world’s demand for insecticides comes from Latin America, the Middle East, and Africa.

The market for insecticides is rising more quickly than average as a result of the increasing regulatory interventions for safe farming practices, the requirement to ensure food quality in the agricultural sector, and the requirement to improve food security. Additionally, the insecticide market is impacted by the increase in insecticide use, which improves agricultural productivity and quality while lowering losses brought on by insect infestations.

Asia Pacific dominated the global insecticides market. The main cause of this expansion is the rise in demand for insecticides across various industries, particularly agriculture, which includes fruits, vegetables, cereals, grains, oilseeds, pulses, and other crops. In order to lessen the negative effects of insects, it is also applied in domestic, business, and industrial settings. Many developing nations, especially those in Asia like China, India, Indonesia, and Malaysia, are supporting the market’s expansion. The demand for pesticides is rising as a result of the rise in demand for organic food, population growth, expansion of arable land, and increased agricultural output in the area.

The market for insecticides in North America is anticipated to grow at the highest CAGR because of the wide range of climatic fluctuations and the diversity of plants. In consequence, pesticides are frequently employed in the area. The expansion is attributable to an increase in the need for pesticides in the agricultural sector, including fruits and vegetables, cereals and grains, oilseeds and pulses, and other commercial applications. In addition, rising demand for organic food, regional population expansion, and higher agricultural productivity contribute to rising insecticide use.

Overall, the drivers driving market expansion over the forecast period include the world’s population’s rapid growth, higher agricultural production to meet rising food demand, and advancements in farming practices and technology.

If a pesticide is swallowed, inhaled, or absorbed via the skin, it can poison humans in many ways. Insecticides are only acceptable for use in residential settings if handled properly and safely, as symptoms can include eye tears, coughing, heart problems, and breathing difficulties.

Rising Global Population

By 2050, the world’s population is anticipated to reach 10 billion people, which is anticipated to impact the pesticide market substantially. Demand for food rises as the population grows. To support the growing population, crop output, farming operations, and trade volumes must increase. Additionally, to enhance crop output, farmers and industrial farming, businesses will buy more arable land, which is anticipated to increase the demand for herbicides. Farmers must boost agricultural production using fertilisers and cutting-edge farming technologies to satisfy the potential growth in food demand from 59% to 98%. As a result, the insecticide market will expand due to the growing need for food due to a growing population.

Increased In Demand For Agrochemicals

Various agrochemicals, including fungicides, insecticides, and herbicides, among others, aid in boosting agricultural output. Agriculture is a diversified industry that includes anything from tiny farms to significant multinational holdings. Insecticide usage has expanded as a result of agricultural activities’ quick expansion due to the increasing demand for food products from a growing population. Consumer food tastes have changed favor of fruits, vegetables, and organic fresh food products due to rising urbanization, an increase in the working population, and an increase in disposable money. The shift in consumer food tastes necessitates more resource-intensive manufacturing and demands maximum yield from the resources spent.

By reducing insects’ negative effects, insecticides help decrease food crop loss. India produced 99.07 million metric tonnes of fruit in 2019–20, covering 6.66 million hectares of land with fruit cultivation, according to the National Horticulture Database provided by the National Horticulture Board. The global insecticide market is expanding due to the rising demand for agrochemicals.

Strict Regulations By Government

Chemicals known as insecticides stop insects from growing into certain stages. These regulate crop growth in a variety of food crops. Insecticides, however, pose risks to human health and the environment. Insecticides can enter waterbodies through soil erosion caused by agriculture, affecting aquatic life. Insecticide import, sale, transit, production, and distribution are all governed by the Insecticide Act of 1968 and the Insecticide Rule of 1971, both intended to reduce the risk that animals and people may face from insecticide use. Therefore, adverse effects on the environment and strict government laws about the use of insecticides may limit market expansion.

New Product Launches

Industry players are developing new products and modifying old ones to make insecticides safer for consumers, farmers, plants, and the environment. Every year, organizations worldwide introduce fresh goods or brands to meet the needs of diverse markets, sectors, and industries. The insecticide’s base solution, application strategy, and residue formation must all be altered. For instance, Marrone Bio Innovations, Inc., a leader in sustainable protection and plant health solutions, declared in May 2020 that REGALIA MAXX, a biofungicide that may be used on cannabis and hemp in Canada both inside and outdoors, had received FDA approval. Additionally, Marrone created Venerate XC, a chemically safe, liquid microbial-based solution that is under the MRL (maximum residue level) tolerance and employed in integrated pest management (IPM) with a minimum four-hour re-entry interval (REl). The product is not harmful to bees, fish, or birds.

Competitive Landscape

Key Players

The global insecticides market is highly competitive, with the presence of several key players. Some of the major players in the market and their market share are as follows:

  • AMVAC Chemical Corp.
  • UPL Ltd.
  • Bayer AG
  • BASF SE
  • FMC Corp.
  • Corteva Agriscience
  • Nufarm Ltd.
  • Bioworks, Inc.
  • Syngenta Group

These businesses prioritise product innovation, enlarging their distribution networks, and mergers and acquisitions to stay competitive in the market. The key players in the worldwide insecticides market are continually launching new products and developments to stay ahead.

In April 2022, Exponus were an insecticide that BASF SE introduced in India to help farmers better protect their crops from pests like caterpillars and thrips while increasing crop output. It is approved for use on various plants, including vegetables, legumes, and oilseeds.

In March 2021, to strengthen crop protection research and create insect-resistant varieties, Corteva Agriscience established its R&D facility in Germany.

In February 2021, Insilico Medicine, a business that uses artificial intelligence (AI), and Syngenta Crop Protection worked together to accelerate the creation and development of fresh, improved crop protection strategies that safeguard crops from pests and diseases.

In February 2021, Tetraniliprole, an active chemical researched and created by Bayer, is a novel multi-insecticide and liquid composition that the Crop Science division of Bayer Vietnam recently introduced. It combats caterpillars and meets the various protection requirements of contemporary farmers.

Summary of Key Findings

  • The factors driving the market expansion over the forecast period include the continuing rise in global population, increased agricultural production to meet the rising food demand, and advancements in farming practises and technologies.
  • Market segmented by type, crop type, formulation, form, and region.
  • Organophosphorus category is most popular, with botanicals category as the primary insecticides type.
  • Sprays segment is most commonly used form of the insecticides market.
  • Asia Pacific is leading market growth; the market is highly competitive with key players including AMVAC Chemical Corp.; UPL Ltd.; Bayer AG; BASF SE; FMC Corp.; Corteva Agriscience; Nufarm Ltd.; Bioworks, Inc.; and Syngenta Group.

Shape Your Report to Specific Countries or Regions & Enjoy 30% Off!

Future Outlook

  • The global insecticide market is expected to increase significantly, especially in the Asia Pacific region.
  • The growth is related to its expanding use in agricultural fields to fend off pest and insect invasions. Around the world, these compounds are used extensively in agricultural applications to protect crops from pest assault.
  • The implementation of stringent government rules and growing concerns about insect resistance are expected to limit the growth of the insecticide market.
  • To be competitive in the market, major companies should focus on creating novel items, expanding their market, and maintaining cheap forms.

Segmentation

  • By Type
    • Pyrethroids
    • Organophosphorus
    • Carbamates
    • Organochlorine
    • Botanicals
    • Other types
  • By Crop Type
    • Cereals & grains
    • Oilseeds & pulses
    • Fruits & vegetables
    • Other crop types
  • By Formulation
    • Wettable Powder
    • Emulsifiable concentrate
    • Suspension concentrate
    • Oil emulsion in water
    • Microencapsulated suspension
    • Granules
    • Other formulations
  • By Form
    • Sprays
    • Bailts
    • Strips
  • By Region
  • North America
    • US
    • Canada
    • Mexico
  • Europe
    • Germany
    • France
    • K.
    • Italy
    • Spain
    • Rest of Europe
  • Asia Pacific
    • China
    • Japan
    • India
    • South Korea
    • South-east Asia
    • Rest of Asia Pacific
  • Latin America
    • Brazil
    • Argentina
    • Rest of Latin America
  • Middle East & Africa
    • GCC Countries
    • South Africa
    • Rest of Middle East and Africa

Chapter 1 Market Overview ……………………………………………………… 49
1.1 Insecticides Introduction …………………………………………………………………………………… 49
1.2 Market Analysis by Source ………………………………………………………………………………… 50
1.3 Market Analysis by Crop …………………………………………………………………………………… 51
1.4 Market Analysis by Form …………………………………………………………………………………… 52
1.5 Market Analysis by Type …………………………………………………………………………………… 53
1.6 Market Analysis by Region ………………………………………………………………………………… 54
1.6.1 North America (United States, Canada and Mexico) ……………………………………. 55
1.6.1.1 United States Market Status and Outlook (2015-
2026) ……………………………………………………………. 55
1.6.1.2 Canada Market Status and Outlook (2015-2026) ………… 55
1.6.1.3 Mexico Market Status and Outlook (2015-2026) …………. 56
1.6.2 Europe (Germany, France, UK, Russia and Italy) …………………………………………. 57
1.6.2.1 Germany Market Status and Outlook (2015-2026) ……… 57
1.6.2.2 France Market Status and Outlook (2015-2026) …………. 57
1.6.2.3 UK Market Status and Outlook (2015-2026) ……………… 58
1.6.2.4 Russia Market Status and Outlook (2015-2026) …………. 58
1.6.2.5 Italy Market Status and Outlook (2015-2026) ……………. 59
1.6.2.6 Spain Market Status and Outlook (2015-2026) ………….. 59
1.6.3 Asia-Pacific (China, Japan, Korea, India and Southeast Asia) …………………………. 60
1.6.3.1 China Market Status and Outlook (2015-2026) ………….. 60
1.6.3.2 Japan Market Status and Outlook (2015-2026) ………….. 60
1.6.3.3 South Korea Market Status and Outlook (2015-
2026) ……………………………………………………………. 61
1.6.3.4 India Market Status and Outlook (2015-2026) …………… 61
1.6.3.5 Southeast Asia Market Status and Outlook (2015-
2026) ……………………………………………………………. 62
1.6.3.6 Australia Market Status and Outlook (2015-2026) ………. 62
1.6.4 South America …………………………………………………………………………………….. 63
1.6.4.1 Brazil Market Status and Outlook (2015-2026) ………….. 63
1.6.4.2 Argentina Market Status and Outlook (2015-2026) ……… 63
1.6.5 Middle East & Africa …………………………………………………………………………….. 64
1.6.5.1 Egypt Market Status and Outlook (2015-2026) ………….. 64
1.6.5.2 Israel Market Status and Outlook (2015-2026) ………….. 64
1.6.5.3 South Africa Market Status and Outlook (2015-
2026) ……………………………………………………………. 65
1.6.5.4 Turkey Market Status and Outlook (2015-2026)…………. 65

Chapter 2 Market Dynamics …………………………………………………….. 66
2.1 Market Drivers ………………………………………………………………………………………………… 66
2.1.1 Rising Need for Better Crop Yield ……………………………………………………………. 66

2.1.2 Increasing Threat of Pest Infestation ……………………………………………………….. 67
2.1.3 Decreasing Arable Land…………………………………………………………………………. 68
2.2 Market Risk …………………………………………………………………………………………………….. 70
2.2.1 Adoption of Advanced Crop Protection Practices ……………………………………….. 70
2.2.2 Growing Environmental Concerns …………………………………………………………… 70
2.3 Market Opportunities ………………………………………………………………………………………. 72
2.3.1 Rise in Adoption of Biopesticides ……………………………………………………………. 72
2.4 Market Attractiveness Analysis ………………………………………………………………………….. 73
2.4.1 By Source …………………………………………………………………………………………… 73
2.4.2 By Crop ……………………………………………………………………………………………… 73
2.4.3 By Form……………………………………………………………………………………………… 74
2.4.4 By Type ……………………………………………………………………………………………… 74
2.4.5 By Region/Country ………………………………………………………………………………. 75
2.5 Porter’s Five Forces Analysis ……………………………………………………………………………… 76
2.6 Value Chain Analysis ………………………………………………………………………………………… 77

Chapter 3 Manufacturers Profiles …………………………………………….. 78
3.1 BASF SE ………………………………………………………………………………………………………….. 78
3.1.1 Business Overview ……………………………………………………………………………….. 78
3.1.2 BASF SE Insecticides Type and Applications ………………………………………………. 79
3.1.3 BASF SE Insecticides Volume, Price, Revenue, Gross Margin and Market
Share (2018-2019) ……………………………………………………………………………….. 79
3.2 Bayer AG ………………………………………………………………………………………………………… 80
3.2.1 Business Overview ……………………………………………………………………………….. 80
3.2.2 Bayer AG Insecticides Type and Applications …………………………………………….. 81
3.2.3 Bayer AG Insecticides Volume, Price, Revenue, Gross Margin and Market
Share (2018-2019) ……………………………………………………………………………….. 81
3.3 DowDuPont (Corteva) ………………………………………………………………………………………. 82
3.3.1 Business Overview ……………………………………………………………………………….. 82
3.3.2 DowDuPont (Corteva) Insecticides Type and Applications ……………………………. 83
3.3.3 DowDuPont (Corteva) Insecticides Volume, Price, Revenue, Gross Margin
and Market Share (2018-2019) ……………………………………………………………….. 84
3.4 FMC Corp………………………………………………………………………………………………………… 85
3.4.1 Business Overview ……………………………………………………………………………….. 85
3.4.2 FMC Corp. Insecticides Type and Applications ……………………………………………. 86
3.4.3 FMC Corp. Insecticides Volume, Price, Revenue, Gross Margin and Market
Share (2018-2019) ……………………………………………………………………………….. 86
3.5 Syngenta AG ……………………………………………………………………………………………………. 87
3.5.1 Business Overview ……………………………………………………………………………….. 87
3.5.2 Syngenta AG Insecticides Type and Applications ………………………………………… 88
3.5.3 Syngenta AG Insecticides Volume, Price, Revenue, Gross Margin and
Market Share (2018-2019) …………………………………………………………………….. 89
3.6 Adama Agriculture …………………………………………………………………………………………… 90
3.6.1 Business Overview ……………………………………………………………………………….. 90
3.6.2 Adama Agriculture Insecticides Type and Applications ………………………………… 91
3.6.3 Adama Agriculture Insecticides Volume, Price, Revenue, Gross Margin and
Market Share (2018-2019) …………………………………………………………………….. 91
3.7 UPL Ltd. ………………………………………………………………………………………………………….. 92
3.7.1 Business Overview ……………………………………………………………………………….. 92
3.7.2 UPL Ltd. Insecticides Type and Applications ………………………………………………. 92
3.7.3 UPL Ltd. Insecticides Volume, Price, Revenue, Gross Margin and Market
Share (2018-2019) ……………………………………………………………………………….. 93
3.8 AMVAC …………………………………………………………………………………………………………… 94
3.8.1 Business Overview ……………………………………………………………………………….. 94
3.8.2 AMVAC Insecticides Type and Applications ……………………………………………….. 94
3.8.3 AMVAC Insecticides Volume, Price, Revenue, Gross Margin and Market
Share (2018-2019) ……………………………………………………………………………….. 95
3.9 NuFarm Ltd……………………………………………………………………………………………………… 96
3.9.1 Business Overview ……………………………………………………………………………….. 96
3.9.2 NuFarm Ltd. Insecticides Type and Applications …………………………………………. 97
3.9.3 NuFarm Ltd. Insecticides Volume, Price, Revenue, Gross Margin and
Market Share (2018-2019) …………………………………………………………………….. 97
3.10 Sumitomo Chemical …………………………………………………………………………………………. 98
3.10.1 Business Overview ……………………………………………………………………………….. 98
3.10.2 Sumitomo Chemical Insecticides Type and Applications ………………………………. 99
3.10.3 Sumitomo Chemical Insecticides Volume, Price, Revenue, Gross Margin
and Market Share (2018-2019) ……………………………………………………………….. 99

Chapter 4 Global Insecticides Volume, Revenue and Market
Share by Manufacturer …………………………………………… 100
4.1 Global Insecticides Volume and Market Share by Manufacturer (2018-2019)………….. 100
4.2 Global Insecticides Revenue and Market Share by Manufacturer (2018-2019) ………… 102
4.3 Pyrethroids ……………………………………………………………………………………………………. 104
4.4 Organophosphorus…………………………………………………………………………………………. 104
4.5 Carbamates …………………………………………………………………………………………………… 105
4.6 Organochlorine ……………………………………………………………………………………………… 105
4.7 Botanicals ……………………………………………………………………………………………………… 106
4.8 Other ……………………………………………………………………………………………………………. 106
4.1 Competitive Landscape …………………………………………………………………………………… 107
4.1.1 New Launch, Mergers and Acquisitions ………………………………………………….. 107

Chapter 5 COVID 19 Impact on Insecticides Market ………………… 109
5.1 Overview of COVID 19 Impact on Insecticides Market …………………………………………. 109
5.2 Global Insecticides Market, 2019 – 2026, Pre V/S Post COVID 19…………………………… 109
5.3 Estimated Impact Of The Coronavirus (Covid-19) Epidemic On The Insecticides
Market Size In 2020, By Scenario………………………………………………………………………. 110
5.4 Impact on Import and Export …………………………………………………………………………… 110
5.5 Macro-Economic Factors …………………………………………………………………………………. 111
5.6 Outlook for trade in 2020 and 2021 ………………………………………………………………….. 111

Chapter 6 Global Insecticides Market Analysis by Regions …….. 112
6.1 Global Insecticides Volume and Market Share by Regions (2015-2020) ………………….. 112
6.1.1 Global Insecticides Volume Share by Region, 2019 ……………………………………. 112
6.1.2 Global Insecticides Market Volume, by Regions (2015-2020) ………………………. 112
6.1.3 Global Insecticides Market Volume, by Regions (2021-2026) ………………………. 113
6.2 Global Insecticides Revenue and Market Share by Regions (2015-2020)…………………. 113
6.2.1 Global Insecticides Revenue Share by Region, 2019 ………………………………….. 113
6.2.2 Global Insecticides Market Revenue, by Regions (2015-2020) ……………………… 114
6.2.3 Global Insecticides Market Revenue, by Regions (2021-2026) ……………………… 114

Chapter 7 North America Insecticides by Country ………………….. 115
7.1 North America Insecticides Volume, Revenue and Market Share by Country ………….. 115
7.1.1 North America Insecticides Volume and Market Share by Country (2015-
2020)……………………………………………………………………………………………….. 115
7.1.2 North America Insecticides Revenue and Market Share by Country (2015-
2020)……………………………………………………………………………………………….. 117
7.2 North America Insecticides Source Analysis ……………………………………………………….. 119
7.2.1 North America Insecticides Market Volume, By Source, 2015 – 2020 (Kilo
Tons) ……………………………………………………………………………………………….. 119
7.2.2 North America Insecticides Market Volume, By Source, 2021 – 2026 (Kilo
Tons) ……………………………………………………………………………………………….. 119
7.2.3 North America Insecticides Market Revenue, By Source, 2015 – 2020 (USD
Million) ……………………………………………………………………………………………. 120
7.2.4 North America Insecticides Market Revenue, By Source, 2021 – 2026 (USD
Million) ……………………………………………………………………………………………. 120
7.3 North America Insecticides by Crop Analysis………………………………………………………. 121
7.3.1 North America Insecticides Market Volume, By Crop, 2015 – 2020 (Kilo
Tons) ……………………………………………………………………………………………….. 121
7.3.2 North America Insecticides Market Volume, By Crop, 2021 – 2026 (Kilo
Tons) ……………………………………………………………………………………………….. 121
7.3.3 North America Insecticides Market Revenue, By Crop, 2015 – 2020 (USD
Million) ……………………………………………………………………………………………. 122
7.3.4 North America Insecticides Market Revenue, By Crop, 2021 – 2026 (USD
Million) ……………………………………………………………………………………………. 122
7.4 North America Insecticides by Form Analysis ……………………………………………………… 123
7.4.1 North America Insecticides Market Volume, By Form, 2015 – 2020 (Kilo
Tons) ……………………………………………………………………………………………….. 123
7.4.2 North America Insecticides Market Volume, By Form, 2021 – 2026 (Kilo
Tons) ……………………………………………………………………………………………….. 123
7.4.3 North America Insecticides Market Revenue, By Form, 2015 – 2020 (USD
Million) ……………………………………………………………………………………………. 124
7.4.4 North America Insecticides Market Revenue, By Form, 2021 – 2026 (USD
Million) ……………………………………………………………………………………………. 124
7.5 North America Insecticides Type Analysis ………………………………………………………….. 125
7.5.1 North America Insecticides Market Volume, By Type, 2015 – 2020 (Kilo
Tons) ……………………………………………………………………………………………….. 125
7.5.2 North America Insecticides Market Volume, By Type, 2021 – 2026 (Kilo
Tons) ……………………………………………………………………………………………….. 125
7.5.3 North America Insecticides Market Revenue, By Type, 2015 – 2020 (USD
Million) ……………………………………………………………………………………………. 126
7.5.4 North America Insecticides Market Revenue, By Type, 2021 – 2026 (USD
Million) ……………………………………………………………………………………………. 126
7.5.5 U.S. Insecticides Source Analysis …………………………………………………………… 127
7.5.5.1 U.S. Insecticides Market Volume, By Source, 2015 –
2020 (Kilo Tons) …………………………………………….. 127
7.5.5.2 U.S. Insecticides Market Volume, By Source, 2021 –
2026 (Kilo Tons) …………………………………………….. 127
7.5.5.3 U.S. Insecticides Market Revenue, By Source, 2015
– 2020 (USD Million) ………………………………………… 128
7.5.5.4 U.S. Insecticides Market Revenue, By Source, 2021
– 2026 (USD Million) ………………………………………… 128
7.5.6 U.S. Insecticides by Crop Analysis ………………………………………………………….. 129
7.5.6.1 U.S. Insecticides Market Volume, By Crop, 2015 –
2020 (Kilo Tons) …………………………………………….. 129
7.5.6.2 U.S. Insecticides Market Volume, By Crop, 2021 –
2026 (Kilo Tons) …………………………………………….. 129
7.5.6.3 U.S. Insecticides Market Revenue, By Crop, 2015 –
2020 (USD Million) ………………………………………….. 130
7.5.6.4 U.S. Insecticides Market Revenue, By Crop, 2021 –
2026 (USD Million) ………………………………………….. 130
7.5.7 U.S. Insecticides by Form Analysis …………………………………………………………. 131
7.5.7.1 U.S. Insecticides Market Volume, By Form, 2015 –
2020 (Kilo Tons) …………………………………………….. 131
7.5.7.2 U.S. Insecticides Market Volume, By Form, 2021 –
2026 (Kilo Tons) …………………………………………….. 131
7.5.7.3 U.S. Insecticides Market Revenue, By Form, 2015 –
2020 (USD Million) ………………………………………….. 132
7.5.7.4 U.S. Insecticides Market Revenue, By Form, 2021 –
2026 (USD Million) ………………………………………….. 132
7.5.8 U.S. Insecticides Type Analysis ……………………………………………………………… 133
7.5.8.1 U.S. Insecticides Market Volume, By Type, 2015 –
2020 (Kilo Tons) …………………………………………….. 133
7.5.8.2 U.S. Insecticides Market Volume, By Type, 2021 –
2026 (Kilo Tons) …………………………………………….. 133
7.5.8.3 U.S. Insecticides Market Revenue, By Type, 2015 –
2020 (USD Million) ………………………………………….. 134
7.5.8.4 U.S. Insecticides Market Revenue, By Type, 2021 –
2026 (USD Million) ………………………………………….. 134
7.5.9 Canada Insecticides Source Analysis ………………………………………………………. 135
7.5.9.1 Canada Insecticides Market Volume, By Source,
2015 – 2020 (Kilo Tons) ……………………………………. 135
7.5.9.2 Canada Insecticides Market Volume, By Source,
2021 – 2026 (Kilo Tons) ……………………………………. 135
7.5.9.3 Canada Insecticides Market Revenue, By Source,
2015 – 2020 (USD Million) …………………………………. 136
7.5.9.4 Canada Insecticides Market Revenue, By Source,
2021 – 2026 (USD Million) …………………………………. 136
7.5.10 Canada Insecticides by Crop Analysis ……………………………………………………… 137
7.5.10.1 Canada Insecticides Market Volume, By Crop, 2015
– 2020 (Kilo Tons) …………………………………………… 137
7.5.10.2 Canada Insecticides Market Volume, By Crop, 2021
– 2026 (Kilo Tons) …………………………………………… 137
7.5.10.3 Canada Insecticides Market Revenue, By Crop, 2015
– 2020 (USD Million) ………………………………………… 138
7.5.10.4 Canada Insecticides Market Revenue, By Crop, 2021
– 2026 (USD Million) ………………………………………… 138
7.5.11 Canada Insecticides by Form Analysis …………………………………………………….. 139
7.5.11.1 Canada Insecticides Market Volume, By Form, 2015
– 2020 (Kilo Tons) …………………………………………… 139
7.5.11.2 Canada Insecticides Market Volume, By Form, 2021
– 2026 (Kilo Tons) …………………………………………… 139
7.5.11.3 Canada Insecticides Market Revenue, By Form, 2015
– 2020 (USD Million) ………………………………………… 140
7.5.11.4 Canada Insecticides Market Revenue, By Form, 2021
– 2026 (USD Million) ………………………………………… 140
7.5.12 Canada Insecticides Type Analysis …………………………………………………………. 141
7.5.12.1 Canada Insecticides Market Volume, By Type, 2015
– 2020 (Kilo Tons) …………………………………………… 141
7.5.12.2 Canada Insecticides Market Volume, By Type, 2021
– 2026 (Kilo Tons) …………………………………………… 141
7.5.12.3 Canada Insecticides Market Revenue, By Type, 2015
– 2020 (USD Million) ………………………………………… 142
7.5.12.4 Canada Insecticides Market Revenue, By Type, 2021
– 2026 (USD Million) ………………………………………… 142
7.5.13 Mexico Insecticides Source Analysis ………………………………………………………. 143
7.5.13.1 Mexico Insecticides Market Volume, By Source, 2015
– 2020 (Kilo Tons) …………………………………………… 143
7.5.13.2 Mexico Insecticides Market Volume, By Source, 2021
– 2026 (Kilo Tons) …………………………………………… 143
7.5.13.3 Mexico Insecticides Market Revenue, By Source,
2015 – 2020 (USD Million) …………………………………. 144
7.5.13.4 Mexico Insecticides Market Revenue, By Source,
2021 – 2026 (USD Million) …………………………………. 144
7.5.14 Mexico Insecticides by Crop Analysis ……………………………………………………… 145
7.5.14.1 Mexico Insecticides Market Volume, By Crop, 2015 –
2020 (Kilo Tons) …………………………………………….. 145
7.5.14.2 Mexico Insecticides Market Volume, By Crop, 2021 –
2026 (Kilo Tons) …………………………………………….. 145
7.5.14.3 Mexico Insecticides Market Revenue, By Crop, 2015
– 2020 (USD Million) ………………………………………… 146
7.5.14.4 Mexico Insecticides Market Revenue, By Crop, 2021
– 2026 (USD Million) ………………………………………… 146
7.5.15 Mexico Insecticides by Form Analysis …………………………………………………….. 147
7.5.15.1 Mexico Insecticides Market Volume, By Form, 2015
– 2020 (Kilo Tons) …………………………………………… 147
7.5.15.2 Mexico Insecticides Market Volume, By Form, 2021
– 2026 (Kilo Tons) …………………………………………… 147
7.5.15.3 Mexico Insecticides Market Revenue, By Form, 2015
– 2020 (USD Million) ………………………………………… 148
7.5.15.4 Mexico Insecticides Market Revenue, By Form, 2021
– 2026 (USD Million) ………………………………………… 148
7.5.16 Mexico Insecticides Type Analysis …………………………………………………………. 149
7.5.16.1 Mexico Insecticides Market Volume, By Type, 2015 –
2020 (Kilo Tons) …………………………………………….. 149
7.5.16.2 Mexico Insecticides Market Volume, By Type, 2021 –
2026 (Kilo Tons) …………………………………………….. 149
7.5.16.3 Mexico Insecticides Market Revenue, By Type, 2015
– 2020 (USD Million) ………………………………………… 150
7.5.16.4 Mexico Insecticides Market Revenue, By Type, 2021
– 2026 (USD Million) ………………………………………… 150

Chapter 8 Europe Insecticides by Country ……………………………… 151
8.1 Europe Insecticides Volume, Revenue and Market Share by Country …………………….. 151
8.1.1 Europe Insecticides Volume and Market Share by Country (2015-2020) ………… 152
8.1.2 Europe Insecticides Revenue and Market Share by Country (2015-2020)……….. 153
8.2 Europe Insecticides Source Analysis ………………………………………………………………….. 155
8.2.1 Europe Insecticides Market Volume, By Source, 2015 – 2020 (Kilo Tons) ……….. 155
8.2.2 Europe Insecticides Market Volume, By Source, 2021 – 2026 (Kilo Tons) ……….. 155
8.2.3 Europe Insecticides Market Revenue, By Source, 2015 – 2020 (USD
Million) ……………………………………………………………………………………………. 156
8.2.4 Europe Insecticides Market Revenue, By Source, 2021 – 2026 (USD
Million) ……………………………………………………………………………………………. 156
8.3 Europe Insecticides by Crop Analysis…………………………………………………………………. 157
8.3.1 Europe Insecticides Market Volume, By Crop, 2015 – 2020 (Kilo Tons) ………….. 157
8.3.2 Europe Insecticides Market Volume, By Crop, 2021 – 2026 (Kilo Tons) ………….. 157
8.3.3 Europe Insecticides Market Revenue, By Crop, 2015 – 2020 (USD Million) …….. 158
8.3.4 Europe Insecticides Market Revenue, By Crop, 2021 – 2026 (USD Million) …….. 158
8.4 Europe Insecticides by Form Analysis ………………………………………………………………… 159
8.4.1 Europe Insecticides Market Volume, By Form, 2015 – 2020 (Kilo Tons) …………. 159
8.4.2 Europe Insecticides Market Volume, By Form, 2021 – 2026 (Kilo Tons) …………. 159
8.4.3 Europe Insecticides Market Revenue, By Form, 2015 – 2020 (USD Million) …….. 160
8.4.4 Europe Insecticides Market Revenue, By Form, 2021 – 2026 (USD Million) …….. 160
8.5 Europe Insecticides Type Analysis …………………………………………………………………….. 161
8.5.1 Europe Insecticides Market Volume, By Type, 2015 – 2020 (Kilo Tons) ………….. 161
8.5.2 Europe Insecticides Market Volume, By Type, 2021 – 2026 (Kilo Tons) ………….. 161
8.5.3 Europe Insecticides Market Revenue, By Type, 2015 – 2020 (USD Million) …….. 162
8.5.4 Europe Insecticides Market Revenue, By Type, 2021 – 2026 (USD Million) …….. 162
8.5.5 UK Insecticides Source Analysis …………………………………………………………….. 163
8.5.5.1 UK Insecticides Market Volume, By Source, 2015 –
2020 (Kilo Tons) …………………………………………….. 163
8.5.5.2 UK Insecticides Market Volume, By Source, 2021 –
2026 (Kilo Tons) …………………………………………….. 163
8.5.5.3 UK Insecticides Market Revenue, By Source, 2015 –
2020 (USD Million) ………………………………………….. 164
8.5.5.4 UK Insecticides Market Revenue, By Source, 2021 –
2026 (USD Million) ………………………………………….. 164
8.5.6 UK Insecticides by Crop Analysis ……………………………………………………………. 165
8.5.6.1 UK Insecticides Market Volume, By Crop, 2015 –
2020 (Kilo Tons) …………………………………………….. 165
8.5.6.2 UK Insecticides Market Volume, By Crop, 2021 –
2026 (Kilo Tons) …………………………………………….. 165
8.5.6.3 UK Insecticides Market Revenue, By Crop, 2015 –
2020 (USD Million) ………………………………………….. 166
8.5.6.4 UK Insecticides Market Revenue, By Crop, 2021 –
2026 (USD Million) ………………………………………….. 166
8.5.7 UK Insecticides by Form Analysis …………………………………………………………… 167
8.5.7.1 UK Insecticides Market Volume, By Form, 2015 –
2020 (Kilo Tons) …………………………………………….. 167
8.5.7.2 UK Insecticides Market Volume, By Form, 2021 –
2026 (Kilo Tons) …………………………………………….. 167
8.5.7.3 UK Insecticides Market Revenue, By Form, 2015 –
2020 (USD Million) ………………………………………….. 168
8.5.7.4 UK Insecticides Market Revenue, By Form, 2021 –
2026 (USD Million) ………………………………………….. 168
8.5.8 UK Insecticides Type Analysis ……………………………………………………………….. 169
8.5.8.1 UK Insecticides Market Volume, By Type, 2015 –
2020 (Kilo Tons) …………………………………………….. 169
8.5.8.2 UK Insecticides Market Volume, By Type, 2021 –
2026 (Kilo Tons) …………………………………………….. 169
8.5.8.3 UK Insecticides Market Revenue, By Type, 2015 –
2020 (USD Million) ………………………………………….. 170
8.5.8.4 UK Insecticides Market Revenue, By Type, 2021 –
2026 (USD Million) ………………………………………….. 170
8.5.9 France Insecticides Source Analysis ……………………………………………………….. 171
8.5.9.1 France Insecticides Market Volume, By Source, 2015
– 2020 (Kilo Tons) …………………………………………… 171
8.5.9.2 France Insecticides Market Volume, By Source, 2021
– 2026 (Kilo Tons) …………………………………………… 171
8.5.9.3 France Insecticides Market Revenue, By Source,
2015 – 2020 (USD Million) …………………………………. 172
8.5.9.4 France Insecticides Market Revenue, By Source,
2021 – 2026 (USD Million) …………………………………. 172
8.5.10 France Insecticides by Crop Analysis ………………………………………………………. 173
8.5.10.1 France Insecticides Market Volume, By Crop, 2015 –
2020 (Kilo Tons) …………………………………………….. 173
8.5.10.2 France Insecticides Market Volume, By Crop, 2021 –
2026 (Kilo Tons) …………………………………………….. 173
8.5.10.3 France Insecticides Market Revenue, By Crop, 2015
– 2020 (USD Million) ………………………………………… 174
8.5.10.4 France Insecticides Market Revenue, By Crop, 2021
– 2026 (USD Million) ………………………………………… 174
8.5.11 France Insecticides by Form Analysis ……………………………………………………… 175
8.5.11.1 France Insecticides Market Volume, By Form, 2015 –
2020 (Kilo Tons) …………………………………………….. 175
8.5.11.2 France Insecticides Market Volume, By Form, 2021 –
2026 (Kilo Tons) …………………………………………….. 175
8.5.11.3 France Insecticides Market Revenue, By Form, 2015
– 2020 (USD Million) ………………………………………… 176
8.5.11.4 France Insecticides Market Revenue, By Form, 2021
– 2026 (USD Million) ………………………………………… 176
8.5.12 France Insecticides Type Analysis ………………………………………………………….. 177
8.5.12.1 France Insecticides Market Volume, By Type, 2015 –
2020 (Kilo Tons) …………………………………………….. 177
8.5.12.2 France Insecticides Market Volume, By Type, 2021 –
2026 (Kilo Tons) …………………………………………….. 177
8.5.12.3 France Insecticides Market Revenue, By Type, 2015
– 2020 (USD Million) ………………………………………… 178
8.5.12.4 France Insecticides Market Revenue, By Type, 2021
– 2026 (USD Million) ………………………………………… 178
8.5.13 Germany Insecticides Source Analysis ……………………………………………………. 179
8.5.13.1 Germany Insecticides Market Volume, By Source,
2015 – 2020 (Kilo Tons) ……………………………………. 179
8.5.13.2 Germany Insecticides Market Volume, By Source,
2021 – 2026 (Kilo Tons) ……………………………………. 179
8.5.13.3 Germany Insecticides Market Revenue, By Source,
2015 – 2020 (USD Million) …………………………………. 180
8.5.13.4 Germany Insecticides Market Revenue, By Source,
2021 – 2026 (USD Million) …………………………………. 180
8.5.14 Germany Insecticides by Crop Analysis …………………………………………………… 181
8.5.14.1 Germany Insecticides Market Volume, By Crop, 2015
– 2020 (Kilo Tons) …………………………………………… 181
8.5.14.2 Germany Insecticides Market Volume, By Crop, 2021
– 2026 (Kilo Tons) …………………………………………… 181
8.5.14.3 Germany Insecticides Market Revenue, By Crop,
2015 – 2020 (USD Million) …………………………………. 182
8.5.14.4 Germany Insecticides Market Revenue, By Crop,
2021 – 2026 (USD Million) …………………………………. 182
8.5.15 Germany Insecticides by Form Analysis ………………………………………………….. 183
8.5.15.1 Germany Insecticides Market Volume, By Form,
2015 – 2020 (Kilo Tons) ……………………………………. 183
8.5.15.2 Germany Insecticides Market Volume, By Form,
2021 – 2026 (Kilo Tons) ……………………………………. 183
8.5.15.3 Germany Insecticides Market Revenue, By Form,
2015 – 2020 (USD Million) …………………………………. 184
8.5.15.4 Germany Insecticides Market Revenue, By Form,
2021 – 2026 (USD Million) …………………………………. 184
8.5.16 Germany Insecticides Type Analysis ………………………………………………………. 185
8.5.16.1 Germany Insecticides Market Volume, By Type,
2015 – 2020 (Kilo Tons) ……………………………………. 185
8.5.16.2 Germany Insecticides Market Volume, By Type,
2021 – 2026 (Kilo Tons) ……………………………………. 185
8.5.16.3 Germany Insecticides Market Revenue, By Type,
2015 – 2020 (USD Million) …………………………………. 186
8.5.16.4 Germany Insecticides Market Revenue, By Type,
2021 – 2026 (USD Million) …………………………………. 186
8.5.17 Italy Insecticides Source Analysis …………………………………………………………… 187
8.5.17.1 Italy Insecticides Market Volume, By Source, 2015 –
2020 (Kilo Tons) …………………………………………….. 187
8.5.17.2 Italy Insecticides Market Volume, By Source, 2021 –
2026 (Kilo Tons) …………………………………………….. 187
8.5.17.3 Italy Insecticides Market Revenue, By Source, 2015
– 2020 (USD Million) ………………………………………… 188
8.5.17.4 Italy Insecticides Market Revenue, By Source, 2021
– 2026 (USD Million) ………………………………………… 188
8.5.18 Italy Insecticides by Crop Analysis …………………………………………………………. 189
8.5.18.1 Italy Insecticides Market Volume, By Crop, 2015 –
2020 (Kilo Tons) …………………………………………….. 189
8.5.18.2 Italy Insecticides Market Volume, By Crop, 2021 –
2026 (Kilo Tons) …………………………………………….. 18
8.5.18.3 Italy Insecticides Market Revenue, By Crop, 2015 –
2020 (USD Million) ………………………………………….. 190
8.5.18.4 Italy Insecticides Market Revenue, By Crop, 2021 –
2026 (USD Million) ………………………………………….. 190
8.5.19 Italy Insecticides by Form Analysis…………………………………………………………. 191
8.5.19.1 Italy Insecticides Market Volume, By Form, 2015 –
2020 (Kilo Tons) …………………………………………….. 191
8.5.19.2 Italy Insecticides Market Volume, By Form, 2021 –
2026 (Kilo Tons) …………………………………………….. 191
8.5.19.3 Italy Insecticides Market Revenue, By Form, 2015 –
2020 (USD Million) ………………………………………….. 192
8.5.19.4 Italy Insecticides Market Revenue, By Form, 2021 –
2026 (USD Million) ………………………………………….. 192
8.5.20 Italy Insecticides Type Analysis ……………………………………………………………… 193
8.5.20.1 Italy Insecticides Market Volume, By Type, 2015 –
2020 (Kilo Tons) …………………………………………….. 193
8.5.20.2 Italy Insecticides Market Volume, By Type, 2021 –
2026 (Kilo Tons) …………………………………………….. 193
8.5.20.3 Italy Insecticides Market Revenue, By Type, 2015 –
2020 (USD Million) ………………………………………….. 194
8.5.20.4 Italy Insecticides Market Revenue, By Type, 2021 –
2026 (USD Million) ………………………………………….. 194
8.5.21 Spain Insecticides Source Analysis …………………………………………………………. 195
8.5.21.1 Spain Insecticides Market Volume, By Source, 2015
– 2020 (Kilo Tons) …………………………………………… 195
8.5.21.2 Spain Insecticides Market Volume, By Source, 2021
– 2026 (Kilo Tons) …………………………………………… 195
8.5.21.3 Spain Insecticides Market Revenue, By Source, 2015
– 2020 (USD Million) ………………………………………… 196
8.5.21.4 Spain Insecticides Market Revenue, By Source, 2021
– 2026 (USD Million) ………………………………………… 196
8.5.22 Spain Insecticides by Crop Analysis ………………………………………………………… 197
8.5.22.1 Spain Insecticides Market Volume, By Crop, 2015 –
2020 (Kilo Tons) …………………………………………….. 197
8.5.22.2 Spain Insecticides Market Volume, By Crop, 2021 –
2026 (Kilo Tons) …………………………………………….. 197
8.5.22.3 Spain Insecticides Market Revenue, By Crop, 2015 –
2020 (USD Million) ………………………………………….. 198
8.5.22.4 Spain Insecticides Market Revenue, By Crop, 2021 –
2026 (USD Million) ………………………………………….. 198
8.5.23 Spain Insecticides by Form Analysis ……………………………………………………….. 199
8.5.23.1 Spain Insecticides Market Volume, By Form, 2015 –
2020 (Kilo Tons) …………………………………………….. 199
8.5.23.2 Spain Insecticides Market Volume, By Form, 2021 –
2026 (Kilo Tons) …………………………………………….. 199
8.5.23.3 Spain Insecticides Market Revenue, By Form, 2015 –
2020 (USD Million) ………………………………………….. 200
8.5.23.4 Spain Insecticides Market Revenue, By Form, 2021 –
2026 (USD Million) ………………………………………….. 200
8.5.24 Spain Insecticides Type Analysis ……………………………………………………………. 201
8.5.24.1 Spain Insecticides Market Volume, By Type, 2015 –
2020 (Kilo Tons) …………………………………………….. 201
8.5.24.2 Spain Insecticides Market Volume, By Type, 2021 –
2026 (Kilo Tons) …………………………………………….. 201
8.5.24.3 Spain Insecticides Market Revenue, By Type, 2015 –
2020 (USD Million) ………………………………………….. 202
8.5.24.4 Spain Insecticides Market Revenue, By Type, 2021 –
2026 (USD Million) ………………………………………….. 202
8.5.25 Russia Insecticides Source Analysis ………………………………………………………… 203
8.5.25.1 Russia Insecticides Market Volume, By Source, 2015
– 2020 (Kilo Tons) …………………………………………… 203
8.5.25.2 Russia Insecticides Market Volume, By Source, 2021
– 2026 (Kilo Tons) …………………………………………… 203
8.5.25.3 Russia Insecticides Market Revenue, By Source,
2015 – 2020 (USD Million) …………………………………. 204
8.5.25.4 Russia Insecticides Market Revenue, By Source,
2021 – 2026 (USD Million) …………………………………. 204
8.5.26 Russia Insecticides by Crop Analysis ………………………………………………………. 205
8.5.26.1 Russia Insecticides Market Volume, By Crop, 2015 –
2020 (Kilo Tons) …………………………………………….. 205
8.5.26.2 Russia Insecticides Market Volume, By Crop, 2021 –
2026 (Kilo Tons) …………………………………………….. 205
8.5.26.3 Russia Insecticides Market Revenue, By Crop, 2015
– 2020 (USD Million) ………………………………………… 206
8.5.26.4 Russia Insecticides Market Revenue, By Crop, 2021
– 2026 (USD Million) ………………………………………… 206
8.5.27 Russia Insecticides by Form Analysis ………………………………………………………. 207
8.5.27.1 Russia Insecticides Market Volume, By Form, 2015 –
2020 (Kilo Tons) …………………………………………….. 207
8.5.27.2 Russia Insecticides Market Volume, By Form, 2021 –
2026 (Kilo Tons) …………………………………………….. 207
8.5.27.3 Russia Insecticides Market Revenue, By Form, 2015
– 2020 (USD Million) ………………………………………… 208
8.5.27.4 Russia Insecticides Market Revenue, By Form, 2021
– 2026 (USD Million) ………………………………………… 208
8.5.28 Russia Insecticides Type Analysis …………………………………………………………… 209
8.5.28.1 Russia Insecticides Market Volume, By Type, 2015 –
2020 (Kilo Tons) …………………………………………….. 209
8.5.28.2 Russia Insecticides Market Volume, By Type, 2021 –
2026 (Kilo Tons) …………………………………………….. 209
8.5.28.3 Russia Insecticides Market Revenue, By Type, 2015
– 2020 (USD Million) ………………………………………… 210
8.5.28.4 Russia Insecticides Market Revenue, By Type, 2021
– 2026 (USD Million) ………………………………………… 210

Chapter 9 Asia Pacific Insecticides by Country ………………………. 211
9.1 Asia Pacific Insecticides Volume, Revenue and Market Share by Country ……………….. 211
9.1.1 Asia Pacific Insecticides Volume and Market Share by Country (2015-2020) …… 212
9.1.2 Asia Pacific Insecticides Revenue and Market Share by Country (2015-
2020)……………………………………………………………………………………………….. 213
9.2 Asia Pacific Insecticides Source Analysis…………………………………………………………….. 215
9.2.1 Asia Pacific Insecticides Market Volume, By Source, 2015 – 2020 (Kilo
Tons) ……………………………………………………………………………………………….. 215
9.2.2 Asia Pacific Insecticides Market Volume, By Source, 2021 – 2026 (Kilo
Tons) ……………………………………………………………………………………………….. 215
9.2.3 Asia Pacific Insecticides Market Revenue, By Source, 2015 – 2020 (USD
Million) ……………………………………………………………………………………………. 216
9.2.4 Asia Pacific Insecticides Market Revenue, By Source, 2021 – 2026 (USD
Million) ……………………………………………………………………………………………. 216
9.3 Asia Pacific Insecticides by Crop Analysis …………………………………………………………… 217
9.3.1 Asia Pacific Insecticides Market Volume, By Crop, 2015 – 2020 (Kilo Tons) …….. 217
9.3.2 Asia Pacific Insecticides Market Volume, By Crop, 2021 – 2026 (Kilo Tons) …….. 217
9.3.3 Asia Pacific Insecticides Market Revenue, By Crop, 2015 – 2020 (USD
Million) ……………………………………………………………………………………………. 218
9.3.4 Asia Pacific Insecticides Market Revenue, By Crop, 2021 – 2026 (USD
Million) ……………………………………………………………………………………………. 218
9.4 Asia Pacific Insecticides by Form Analysis ………………………………………………………….. 219
9.4.1 Asia Pacific Insecticides Market Volume, By Form, 2015 – 2020 (Kilo Tons) ……. 219
9.4.2 Asia Pacific Insecticides Market Volume, By Form, 2021 – 2026 (Kilo Tons) ……. 219
9.4.3 Asia Pacific Insecticides Market Revenue, By Form, 2015 – 2020 (USD
Million) ……………………………………………………………………………………………. 220
9.4.4 Asia Pacific Insecticides Market Revenue, By Form, 2021 – 2026 (USD
Million) ……………………………………………………………………………………………. 220
9.5 Asia Pacific Insecticides Type Analysis ……………………………………………………………….. 221
9.5.1 Asia Pacific Insecticides Market Volume, By Type, 2015 – 2020 (Kilo Tons) …….. 221
9.5.2 Asia Pacific Insecticides Market Volume, By Type, 2021 – 2026 (Kilo Tons) …….. 221
9.5.3 Asia Pacific Insecticides Market Revenue, By Type, 2015 – 2020 (USD
Million) ……………………………………………………………………………………………. 222
9.5.4 Asia Pacific Insecticides Market Revenue, By Type, 2021 – 2026 (USD
Million) ……………………………………………………………………………………………. 222
9.5.5 China Insecticides Source Analysis …………………………………………………………. 223
9.5.5.1 China Insecticides Market Volume, By Source, 2015
– 2020 (Kilo Tons) …………………………………………… 223
9.5.5.2 China Insecticides Market Volume, By Source, 2021
– 2026 (Kilo Tons) …………………………………………… 223
9.5.5.3 China Insecticides Market Revenue, By Source, 2015
– 2020 (USD Million) ………………………………………… 224
9.5.5.4 China Insecticides Market Revenue, By Source, 2021
– 2026 (USD Million) ………………………………………… 224
9.5.6 China Insecticides by Crop Analysis ……………………………………………………….. 225
9.5.6.1 China Insecticides Market Volume, By Crop, 2015 –
2020 (Kilo Tons) …………………………………………….. 225
9.5.6.2 China Insecticides Market Volume, By Crop, 2021 –
2026 (Kilo Tons) …………………………………………….. 225
9.5.6.3 China Insecticides Market Revenue, By Crop, 2015 –
2020 (USD Million) ………………………………………….. 226
9.5.6.4 China Insecticides Market Revenue, By Crop, 2021 –
2026 (USD Million) ………………………………………….. 226
9.5.7 China Insecticides by Form Analysis ……………………………………………………….. 227
9.5.7.1 China Insecticides Market Volume, By Form, 2015 –
2020 (Kilo Tons) …………………………………………….. 227
9.5.7.2 China Insecticides Market Volume, By Form, 2021 –
2026 (Kilo Tons) …………………………………………….. 227
9.5.7.3 China Insecticides Market Revenue, By Form, 2015
– 2020 (USD Million) ………………………………………… 228
9.5.7.4 China Insecticides Market Revenue, By Form, 2021
– 2026 (USD Million) ………………………………………… 228
9.5.8 China Insecticides Type Analysis ……………………………………………………………. 229
9.5.8.1 China Insecticides Market Volume, By Type, 2015 –
2020 (Kilo Tons) …………………………………………….. 229
9.5.8.2 China Insecticides Market Volume, By Type, 2021 –
2026 (Kilo Tons) …………………………………………….. 229
9.5.8.3 China Insecticides Market Revenue, By Type, 2015 –
2020 (USD Million) ………………………………………….. 230
9.5.8.4 China Insecticides Market Revenue, By Type, 2021 –
2026 (USD Million) ………………………………………….. 230
9.5.9 Japan Insecticides Source Analysis …………………………………………………………. 231
9.5.9.1 Japan Insecticides Market Volume, By Source, 2015
– 2020 (Kilo Tons) …………………………………………… 231
9.5.9.2 Japan Insecticides Market Volume, By Source, 2021
– 2026 (Kilo Tons) …………………………………………… 231
9.5.9.3 Japan Insecticides Market Revenue, By Source, 2015
– 2020 (USD Million) ………………………………………… 232
9.5.9.4 Japan Insecticides Market Revenue, By Source, 2021
– 2026 (USD Million) ………………………………………… 232
9.5.10 Japan Insecticides by Crop Analysis ……………………………………………………….. 233
9.5.10.1 Japan Insecticides Market Volume, By Crop, 2015 –
2020 (Kilo Tons) …………………………………………….. 233
9.5.10.2 Japan Insecticides Market Volume, By Crop, 2021 –
2026 (Kilo Tons) …………………………………………….. 233
9.5.10.3 Japan Insecticides Market Revenue, By Crop, 2015 –
2020 (USD Million) ………………………………………….. 234
9.5.10.4 Japan Insecticides Market Revenue, By Crop, 2021 –
2026 (USD Million) ………………………………………….. 234
9.5.11 Japan Insecticides by Form Analysis ………………………………………………………. 235
9.5.11.1 Japan Insecticides Market Volume, By Form, 2015 –
2020 (Kilo Tons) …………………………………………….. 235
9.5.11.2 Japan Insecticides Market Volume, By Form, 2021 –
2026 (Kilo Tons) …………………………………………….. 235
9.5.11.3 Japan Insecticides Market Revenue, By Form, 2015
– 2020 (USD Million) ………………………………………… 236
9.5.11.4 Japan Insecticides Market Revenue, By Form, 2021
– 2026 (USD Million) ………………………………………… 236
9.5.12 Japan Insecticides Type Analysis……………………………………………………………. 237
9.5.12.1 Japan Insecticides Market Volume, By Type, 2015 –
2020 (Kilo Tons) …………………………………………….. 237
9.5.12.2 Japan Insecticides Market Volume, By Type, 2021 –
2026 (Kilo Tons) …………………………………………….. 237
9.5.12.3 Japan Insecticides Market Revenue, By Type, 2015 –
2020 (USD Million) ………………………………………….. 238
9.5.12.4 Japan Insecticides Market Revenue, By Type, 2021 –
2026 (USD Million) ………………………………………….. 238
9.5.13 South Korea Insecticides Source Analysis ………………………………………………… 239
9.5.13.1 South Korea Insecticides Market Volume, By Source,
2015 – 2020 (Kilo Tons) ……………………………………. 239
9.5.13.2 South Korea Insecticides Market Volume, By Source,
2021 – 2026 (Kilo Tons) ……………………………………. 239
9.5.13.3 South Korea Insecticides Market Revenue, By
Source, 2015 – 2020 (USD Million) ………………………. 240
9.5.13.4 South Korea Insecticides Market Revenue, By
Source, 2021 – 2026 (USD Million) ………………………. 240
9.5.14 South Korea Insecticides by Crop Analysis ………………………………………………. 241
9.5.14.1 South Korea Insecticides Market Volume, By Crop,
2015 – 2020 (Kilo Tons) ……………………………………. 241
9.5.14.2 South Korea Insecticides Market Volume, By Crop,
2021 – 2026 (Kilo Tons) ……………………………………. 241
9.5.14.3 South Korea Insecticides Market Revenue, By Crop,
2015 – 2020 (USD Million) …………………………………. 242
9.5.14.4 South Korea Insecticides Market Revenue, By Crop,
2021 – 2026 (USD Million) …………………………………. 242
9.5.15 South Korea Insecticides by Form Analysis ………………………………………………. 243
9.5.15.1 South Korea Insecticides Market Volume, By Form,
2015 – 2020 (Kilo Tons) ……………………………………. 243
9.5.15.2 South Korea Insecticides Market Volume, By Form,
2021 – 2026 (Kilo Tons) ……………………………………. 243
9.5.15.3 South Korea Insecticides Market Revenue, By Form,
2015 – 2020 (USD Million) …………………………………. 244
9.5.15.4 South Korea Insecticides Market Revenue, By Form,
2021 – 2026 (USD Million) …………………………………. 244
9.5.16 South Korea Insecticides Type Analysis …………………………………………………… 245
9.5.16.1 South Korea Insecticides Market Volume, By Type,
2015 – 2020 (Kilo Tons) ……………………………………. 245
9.5.16.2 South Korea Insecticides Market Volume, By Type,
2021 – 2026 (Kilo Tons) ……………………………………. 245
9.5.16.3 South Korea Insecticides Market Revenue, By Type,
2015 – 2020 (USD Million) …………………………………. 246
9.5.16.4 South Korea Insecticides Market Revenue, By Type,
2021 – 2026 (USD Million) …………………………………. 246
9.5.17 India Insecticides Source Analysis ………………………………………………………….. 247
9.5.17.1 India Insecticides Market Volume, By Source, 2015
– 2020 (Kilo Tons) …………………………………………… 247
9.5.17.2 India Insecticides Market Volume, By Source, 2021
– 2026 (Kilo Tons) …………………………………………… 247
9.5.17.3 India Insecticides Market Revenue, By Source, 2015
– 2020 (USD Million) ………………………………………… 248
9.5.17.4 India Insecticides Market Revenue, By Source, 2021
– 2026 (USD Million) ………………………………………… 248
9.5.18 India Insecticides by Crop Analysis ………………………………………………………… 249
9.5.18.1 India Insecticides Market Volume, By Crop, 2015 –
2020 (Kilo Tons) …………………………………………….. 249
9.5.18.2 India Insecticides Market Volume, By Crop, 2021 –
2026 (Kilo Tons) …………………………………………….. 249
9.5.18.3 India Insecticides Market Revenue, By Crop, 2015 –
2020 (USD Million) ………………………………………….. 250
9.5.18.4 India Insecticides Market Revenue, By Crop, 2021 –
2026 (USD Million) ………………………………………….. 250
9.5.19 India Insecticides by Form Analysis ………………………………………………………… 251
9.5.19.1 India Insecticides Market Volume, By Form, 2015 –
2020 (Kilo Tons) …………………………………………….. 251
9.5.19.2 India Insecticides Market Volume, By Form, 2021 –
2026 (Kilo Tons) …………………………………………….. 251
9.5.19.3 India Insecticides Market Revenue, By Form, 2015 –
2020 (USD Million) ………………………………………….. 252
9.5.19.4 India Insecticides Market Revenue, By Form, 2021 –
2026 (USD Million) ………………………………………….. 252
9.5.20 India Insecticides Type Analysis …………………………………………………………….. 253
9.5.20.1 India Insecticides Market Volume, By Type, 2015 –
2020 (Kilo Tons) …………………………………………….. 253
9.5.20.2 India Insecticides Market Volume, By Type, 2021 –
2026 (Kilo Tons) …………………………………………….. 253
9.5.20.3 India Insecticides Market Revenue, By Type, 2015 –
2020 (USD Million) ………………………………………….. 254
9.5.20.4 India Insecticides Market Revenue, By Type, 2021 –
2026 (USD Million) ………………………………………….. 254
9.5.21 Australia Insecticides Source Analysis …………………………………………………….. 255
9.5.21.1 Australia Insecticides Market Volume, By Source,
2015 – 2020 (Kilo Tons) ……………………………………. 255
9.5.21.2 Australia Insecticides Market Volume, By Source,
2021 – 2026 (Kilo Tons) ……………………………………. 255
9.5.21.3 Australia Insecticides Market Revenue, By Source,
2015 – 2020 (USD Million) …………………………………. 256
9.5.21.4 Australia Insecticides Market Revenue, By Source,
2021 – 2026 (USD Million) …………………………………. 256
9.5.22 Australia Insecticides by Crop Analysis …………………………………………………… 257
9.5.22.1 Australia Insecticides Market Volume, By Crop, 2015
– 2020 (Kilo Tons) …………………………………………… 257
9.5.22.2 Australia Insecticides Market Volume, By Crop, 2021
– 2026 (Kilo Tons) …………………………………………… 257
9.5.22.3 Australia Insecticides Market Revenue, By Crop,
2015 – 2020 (USD Million) …………………………………. 258
9.5.22.4 Australia Insecticides Market Revenue, By Crop,
2021 – 2026 (USD Million) …………………………………. 258
9.5.23 Australia Insecticides by Form Analysis …………………………………………………… 259
9.5.23.1 Australia Insecticides Market Volume, By Form,
2015 – 2020 (Kilo Tons) ……………………………………. 259
9.5.23.2 Australia Insecticides Market Volume, By Form,
2021 – 2026 (Kilo Tons) ……………………………………. 259
9.5.23.3 Australia Insecticides Market Revenue, By Form,
2015 – 2020 (USD Million) …………………………………. 260
9.5.23.4 Australia Insecticides Market Revenue, By Form,
2021 – 2026 (USD Million) …………………………………. 260
9.5.24 Australia Insecticides Type Analysis ……………………………………………………….. 261
9.5.24.1 Australia Insecticides Market Volume, By Type, 2015
– 2020 (Kilo Tons) …………………………………………… 261
9.5.24.2 Australia Insecticides Market Volume, By Type, 2021
– 2026 (Kilo Tons) …………………………………………… 261
9.5.24.3 Australia Insecticides Market Revenue, By Type,
2015 – 2020 (USD Million) …………………………………. 262
9.5.24.4 Australia Insecticides Market Revenue, By Type,
2021 – 2026 (USD Million) …………………………………. 262
9.5.25 Southeast Asia Insecticides Source Analysis …………………………………………….. 263
9.5.25.1 Southeast Asia Insecticides Market Volume, By
Source, 2015 – 2020 (Kilo Tons) …………………………. 263
9.5.25.2 Southeast Asia Insecticides Market Volume, By
Source, 2021 – 2026 (Kilo Tons) …………………………. 263
9.5.25.3 Southeast Asia Insecticides Market Revenue, By
Source, 2015 – 2020 (USD Million) ………………………. 264
9.5.25.4 Southeast Asia Insecticides Market Revenue, By
Source, 2021 – 2026 (USD Million) ………………………. 264
9.5.26 Southeast Asia Insecticides by Crop Analysis……………………………………………. 265
9.5.26.1 Southeast Asia Insecticides Market Volume, By Crop,
2015 – 2020 (Kilo Tons) ……………………………………. 265
9.5.26.2 Southeast Asia Insecticides Market Volume, By Crop,
2021 – 2026 (Kilo Tons) ……………………………………. 265
9.5.26.3 Southeast Asia Insecticides Market Revenue, By
Crop, 2015 – 2020 (USD Million) …………………………. 266
9.5.26.4 Southeast Asia Insecticides Market Revenue, By
Crop, 2021 – 2026 (USD Million) …………………………. 266
9.5.27 Southeast Asia Insecticides by Form Analysis …………………………………………… 267
9.5.27.1 Southeast Asia Insecticides Market Volume, By
Form, 2015 – 2020 (Kilo Tons) ……………………………. 267
9.5.27.2 Southeast Asia Insecticides Market Volume, By
Form, 2021 – 2026 (Kilo Tons) ……………………………. 267
9.5.27.3 Southeast Asia Insecticides Market Revenue, By
Form, 2015 – 2020 (USD Million) …………………………. 268
9.5.27.4 Southeast Asia Insecticides Market Revenue, By
Form, 2021 – 2026 (USD Million) …………………………. 268
9.5.28 Southeast Asia Insecticides Type Analysis ……………………………………………….. 269
9.5.28.1 Southeast Asia Insecticides Market Volume, By
Type, 2015 – 2020 (Kilo Tons) ……………………………. 269
9.5.28.2 Southeast Asia Insecticides Market Volume, By
Type, 2021 – 2026 (Kilo Tons) ……………………………. 269
9.5.28.3 Southeast Asia Insecticides Market Revenue, By
Type, 2015 – 2020 (USD Million) …………………………. 270
9.5.28.4 Southeast Asia Insecticides Market Revenue, By
Type, 2021 – 2026 (USD Million) …………………………. 270

Chapter 10 South America Insecticides by Country………………….. 271
10.1 South America Insecticides Volume, Revenue and Market Share by Country ………….. 271
10.1.1 South America Insecticides Volume and Market Share by Country (2015-
2020)……………………………………………………………………………………………….. 271
10.1.2 South America Insecticides Revenue and Market Share by Country (2015-
2020)……………………………………………………………………………………………….. 273
10.2 Latin America Insecticides Source Analysis ………………………………………………………… 275
10.2.1 Latin America Insecticides Market Volume, By Source, 2015 – 2020 (Kilo
Tons) ……………………………………………………………………………………………….. 275
10.2.2 Latin America Insecticides Market Volume, By Source, 2021 – 2026 (Kilo
Tons) ……………………………………………………………………………………………….. 275
10.2.3 Latin America Insecticides Market Revenue, By Source, 2015 – 2020 (USD
Million) ……………………………………………………………………………………………. 276
10.2.4 Latin America Insecticides Market Revenue, By Source, 2021 – 2026 (USD
Million) ……………………………………………………………………………………………. 276
10.3 Latin America Insecticides by Crop Analysis ……………………………………………………….. 277
10.3.1 Latin America Insecticides Market Volume, By Crop, 2015 – 2020 (Kilo
Tons) ……………………………………………………………………………………………….. 277
10.3.2 Latin America Insecticides Market Volume, By Crop, 2021 – 2026 (Kilo
Tons) ……………………………………………………………………………………………….. 277
10.3.3 Latin America Insecticides Market Revenue, By Crop, 2015 – 2020 (USD
Million) ……………………………………………………………………………………………. 278
10.3.4 Latin America Insecticides Market Revenue, By Crop, 2021 – 2026 (USD
Million) ……………………………………………………………………………………………. 278
10.4 Latin America Insecticides by Form Analysis ………………………………………………………. 279
10.4.1 Latin America Insecticides Market Volume, By Form, 2015 – 2020 (Kilo
Tons) ……………………………………………………………………………………………….. 279
10.4.2 Latin America Insecticides Market Volume, By Form, 2021 – 2026 (Kilo
Tons) ……………………………………………………………………………………………….. 279
10.4.3 Latin America Insecticides Market Revenue, By Form, 2015 – 2020 (USD
Million) ……………………………………………………………………………………………. 280
10.4.4 Latin America Insecticides Market Revenue, By Form, 2021 – 2026 (USD
Million) ……………………………………………………………………………………………. 280
10.5 Latin America Insecticides Type Analysis ……………………………………………………………. 281
10.5.1 Latin America Insecticides Market Volume, By Type, 2015 – 2020 (Kilo
Tons) ……………………………………………………………………………………………….. 281
10.5.2 Latin America Insecticides Market Volume, By Type, 2021 – 2026 (Kilo
Tons) ……………………………………………………………………………………………….. 281
10.5.3 Latin America Insecticides Market Revenue, By Type, 2015 – 2020 (USD
Million) ……………………………………………………………………………………………. 282
10.5.4 Latin America Insecticides Market Revenue, By Type, 2021 – 2026 (USD
Million) ……………………………………………………………………………………………. 282
10.5.5 Brazil Insecticides Source Analysis …………………………………………………………. 283
10.5.5.1 Brazil Insecticides Market Volume, By Source, 2015
– 2020 (Kilo Tons) …………………………………………… 283
10.5.5.2 Brazil Insecticides Market Volume, By Source, 2021
– 2026 (Kilo Tons) …………………………………………… 283
10.5.5.3 Brazil Insecticides Market Revenue, By Source, 2015
– 2020 (USD Million) ………………………………………… 284
10.5.5.4 Brazil Insecticides Market Revenue, By Source, 2021
– 2026 (USD Million) ………………………………………… 284
10.5.6 Brazil Insecticides by Crop Analysis ………………………………………………………… 285
10.5.6.1 Brazil Insecticides Market Volume, By Crop, 2015 –
2020 (Kilo Tons) …………………………………………….. 285
10.5.6.2 Brazil Insecticides Market Volume, By Crop, 2021 –
2026 (Kilo Tons) …………………………………………….. 285
10.5.6.3 Brazil Insecticides Market Revenue, By Crop, 2015 –
2020 (USD Million) ………………………………………….. 286
10.5.6.4 Brazil Insecticides Market Revenue, By Crop, 2021 –
2026 (USD Million) ………………………………………….. 286
10.5.7 Brazil Insecticides by Form Analysis ……………………………………………………….. 287
10.5.7.1 Brazil Insecticides Market Volume, By Form, 2015 –
2020 (Kilo Tons) …………………………………………….. 287
10.5.7.2 Brazil Insecticides Market Volume, By Form, 2021 –
2026 (Kilo Tons) …………………………………………….. 287
10.5.7.3 Brazil Insecticides Market Revenue, By Form, 2015 –
2020 (USD Million) ………………………………………….. 288
10.5.7.4 Brazil Insecticides Market Revenue, By Form, 2021 –
2026 (USD Million) ………………………………………….. 288
10.5.8 Brazil Insecticides Type Analysis ……………………………………………………………. 289
10.5.8.1 Brazil Insecticides Market Volume, By Type, 2015 –
2020 (Kilo Tons) …………………………………………….. 289
10.5.8.2 Brazil Insecticides Market Volume, By Type, 2021 –
2026 (Kilo Tons) …………………………………………….. 289
10.5.8.3 Brazil Insecticides Market Revenue, By Type, 2015 –
2020 (USD Million) ………………………………………….. 290
10.5.8.4 Brazil Insecticides Market Revenue, By Type, 2021 –
2026 (USD Million) ………………………………………….. 290
10.5.9 Argentina Insecticides Source Analysis …………………………………………………… 291
10.5.9.1 Argentina Insecticides Market Volume, By Source,
2015 – 2020 (Kilo Tons) ……………………………………. 291
10.5.9.2 Argentina Insecticides Market Volume, By Source,
2021 – 2026 (Kilo Tons) ……………………………………. 291
10.5.9.3 Argentina Insecticides Market Revenue, By Source,
2015 – 2020 (USD Million) …………………………………. 292
10.5.9.4 Argentina Insecticides Market Revenue, By Source,
2021 – 2026 (USD Million) …………………………………. 292
10.5.10 Argentina Insecticides by Crop Analysis ………………………………………………….. 293
10.5.10.1 Argentina Insecticides Market Volume, By Crop,
2015 – 2020 (Kilo Tons) ……………………………………. 293
10.5.10.2 Argentina Insecticides Market Volume, By Crop,
2021 – 2026 (Kilo Tons) ……………………………………. 293
10.5.10.3 Argentina Insecticides Market Revenue, By Crop,
2015 – 2020 (USD Million) …………………………………. 294
10.5.10.4 Argentina Insecticides Market Revenue, By Crop,
2021 – 2026 (USD Million) …………………………………. 294
10.5.11 Argentina Insecticides by Form Analysis …………………………………………………. 295
10.5.11.1 Argentina Insecticides Market Volume, By Form,
2015 – 2020 (Kilo Tons) ……………………………………. 295
10.5.11.2 Argentina Insecticides Market Volume, By Form,
2021 – 2026 (Kilo Tons) ……………………………………. 295
10.5.11.3 Argentina Insecticides Market Revenue, By Form,
2015 – 2020 (USD Million) …………………………………. 296
10.5.11.4 Argentina Insecticides Market Revenue, By Form,
2021 – 2026 (USD Million) …………………………………. 296
10.5.12 Argentina Insecticides Type Analysis ……………………………………………………… 297
10.5.12.1 Argentina Insecticides Market Volume, By Type,
2015 – 2020 (Kilo Tons) ……………………………………. 297
10.5.12.2 Argentina Insecticides Market Volume, By Type,
2021 – 2026 (Kilo Tons) ……………………………………. 297
10.5.12.3 Argentina Insecticides Market Revenue, By Type,
2015 – 2020 (USD Million) …………………………………. 298
10.5.12.4 Argentina Insecticides Market Revenue, By Type,
2021 – 2026 (USD Million) …………………………………. 298

Chapter 11 Middle East and Africa Insecticides by Country ……… 299
11.1 Middle East and Africa Insecticides Volume, Revenue and Market Share by
Country ………………………………………………………………………………………………………… 299
11.1.1 Middle East and Africa Insecticides Volume and Market Share by Country
(2015-2020) ………………………………………………………………………………………. 300
11.1.2 Middle East and Africa Insecticides Revenue and Market Share by Country
(2015-2020) ………………………………………………………………………………………. 301
11.2 Middle East & Africa Insecticides Source Analysis ……………………………………………….. 303
11.2.1 Middle East & Africa Insecticides Market Volume, By Source, 2015 – 2020
(Kilo Tons) ………………………………………………………………………………………… 303
11.2.2 Middle East & Africa Insecticides Market Volume, By Source, 2021 – 2026
(Kilo Tons) ………………………………………………………………………………………… 303
11.2.3 Middle East & Africa Insecticides Market Revenue, By Source, 2015 – 2020
(USD Million) …………………………………………………………………………………….. 304
11.2.4 Middle East & Africa Insecticides Market Revenue, By Source, 2021 – 2026
(USD Million) …………………………………………………………………………………….. 304
11.3 Middle East & Africa Insecticides by Crop Analysis ……………………………………………… 305
11.3.1 Middle East & Africa Insecticides Market Volume, By Crop, 2015 – 2020
(Kilo Tons) ………………………………………………………………………………………… 305
11.3.2 Middle East & Africa Insecticides Market Volume, By Crop, 2021 – 2026
(Kilo Tons) ………………………………………………………………………………………… 305
11.3.3 Middle East & Africa Insecticides Market Revenue, By Crop, 2015 – 2020
(USD Million) …………………………………………………………………………………….. 306
11.3.4 Middle East & Africa Insecticides Market Revenue, By Crop, 2021 – 2026
(USD Million) …………………………………………………………………………………….. 306
11.4 Middle East & Africa Insecticides by Form Analysis ……………………………………………… 307
11.4.1 Middle East & Africa Insecticides Market Volume, By Form, 2015 – 2020
(Kilo Tons) ………………………………………………………………………………………… 307
11.4.2 Middle East & Africa Insecticides Market Volume, By Form, 2021 – 2026
(Kilo Tons) ………………………………………………………………………………………… 307
11.4.3 Middle East & Africa Insecticides Market Revenue, By Form, 2015 – 2020
(USD Million) …………………………………………………………………………………….. 308
11.4.4 Middle East & Africa Insecticides Market Revenue, By Form, 2021 – 2026
(USD Million) …………………………………………………………………………………….. 308
11.5 Middle East & Africa Insecticides Type Analysis ………………………………………………….. 309
11.5.1 Middle East & Africa Insecticides Market Volume, By Type, 2015 – 2020
(Kilo Tons) ………………………………………………………………………………………… 309
11.5.2 Middle East & Africa Insecticides Market Volume, By Type, 2021 – 2026
(Kilo Tons) ………………………………………………………………………………………… 309
11.5.3 Middle East & Africa Insecticides Market Revenue, By Type, 2015 – 2020
(USD Million) …………………………………………………………………………………….. 310
11.5.4 Middle East & Africa Insecticides Market Revenue, By Type, 2021 – 2026
(USD Million) …………………………………………………………………………………….. 310
11.5.5 Egypt Insecticides Source Analysis …………………………………………………………. 311
11.5.5.1 Egypt Insecticides Market Volume, By Source, 2015
– 2020 (Kilo Tons) …………………………………………… 311
11.5.5.2 Egypt Insecticides Market Volume, By Source, 2021
– 2026 (Kilo Tons) …………………………………………… 311
11.5.5.3 Egypt Insecticides Market Revenue, By Source, 2015
– 2020 (USD Million) ………………………………………… 312
11.5.5.4 Egypt Insecticides Market Revenue, By Source, 2021
– 2026 (USD Million) ………………………………………… 312
11.5.6 Egypt Insecticides by Crop Analysis………………………………………………………… 313
11.5.6.1 Egypt Insecticides Market Volume, By Crop, 2015 –
2020 (Kilo Tons) …………………………………………….. 313
11.5.6.2 Egypt Insecticides Market Volume, By Crop, 2021 –
2026 (Kilo Tons) …………………………………………….. 313
11.5.6.3 Egypt Insecticides Market Revenue, By Crop, 2015 –
2020 (USD Million) ………………………………………….. 314
11.5.6.4 Egypt Insecticides Market Revenue, By Crop, 2021 –
2026 (USD Million) ………………………………………….. 314
11.5.7 Egypt Insecticides by Form Analysis ……………………………………………………….. 315
11.5.7.1 Egypt Insecticides Market Volume, By Form, 2015 –
2020 (Kilo Tons) …………………………………………….. 315
11.5.7.2 Egypt Insecticides Market Volume, By Form, 2021 –
2026 (Kilo Tons) …………………………………………….. 315
11.5.7.3 Egypt Insecticides Market Revenue, By Form, 2015
– 2020 (USD Million) ………………………………………… 316
11.5.7.4 Egypt Insecticides Market Revenue, By Form, 2021
– 2026 (USD Million) ………………………………………… 316
11.5.8 Egypt Insecticides Type Analysis ……………………………………………………………. 317
11.5.8.1 Egypt Insecticides Market Volume, By Type, 2015 –
2020 (Kilo Tons) …………………………………………….. 317
11.5.8.2 Egypt Insecticides Market Volume, By Type, 2021 –
2026 (Kilo Tons) …………………………………………….. 317
11.5.8.3 Egypt Insecticides Market Revenue, By Type, 2015 –
2020 (USD Million) ………………………………………….. 318
11.5.8.4 Egypt Insecticides Market Revenue, By Type, 2021 –
2026 (USD Million) ………………………………………….. 318
11.5.9 Israel Insecticides Source Analysis …………………………………………………………. 319
11.5.9.1 Israel Insecticides Market Volume, By Source, 2015
– 2020 (Kilo Tons) …………………………………………… 319
11.5.9.2 Israel Insecticides Market Volume, By Source, 2021
– 2026 (Kilo Tons) …………………………………………… 319
11.5.9.3 Israel Insecticides Market Revenue, By Source, 2015
– 2020 (USD Million) ………………………………………… 320
11.5.9.4 Israel Insecticides Market Revenue, By Source, 2021
– 2026 (USD Million) ………………………………………… 320
11.5.10 Israel Insecticides by Crop Analysis ………………………………………………………… 321
11.5.10.1 Israel Insecticides Market Volume, By Crop, 2015 –
2020 (Kilo Tons) …………………………………………….. 321
11.5.10.2 Israel Insecticides Market Volume, By Crop, 2021 –
2026 (Kilo Tons) …………………………………………….. 321
11.5.10.3 Israel Insecticides Market Revenue, By Crop, 2015 –
2020 (USD Million) ………………………………………….. 322
11.5.10.4 Israel Insecticides Market Revenue, By Crop, 2021 –
2026 (USD Million) ………………………………………….. 322
11.5.11 Israel Insecticides by Form Analysis ……………………………………………………….. 323
11.5.11.1 Israel Insecticides Market Volume, By Form, 2015 –
2020 (Kilo Tons) …………………………………………….. 323
11.5.11.2 Israel Insecticides Market Volume, By Form, 2021 –
2026 (Kilo Tons) …………………………………………….. 323
11.5.11.3 Israel Insecticides Market Revenue, By Form, 2015
– 2020 (USD Million) ………………………………………… 324
11.5.11.4 Israel Insecticides Market Revenue, By Form, 2021
– 2026 (USD Million) ………………………………………… 324
11.5.12 Israel Insecticides Type Analysis ……………………………………………………………. 325
11.5.12.1 Israel Insecticides Market Volume, By Type, 2015 –
2020 (Kilo Tons) …………………………………………….. 325
11.5.12.2 Israel Insecticides Market Volume, By Type, 2021 –
2026 (Kilo Tons) …………………………………………….. 325
11.5.12.3 Israel Insecticides Market Revenue, By Type, 2015 –
2020 (USD Million) ………………………………………….. 326
11.5.12.4 Israel Insecticides Market Revenue, By Type, 2021 –
2026 (USD Million) ………………………………………….. 326
11.5.13 Turkey Insecticides Source Analysis ……………………………………………………….. 327
11.5.13.1 Turkey Insecticides Market Volume, By Source, 2015
– 2020 (Kilo Tons) …………………………………………… 327
11.5.13.2 Turkey Insecticides Market Volume, By Source, 2021
– 2026 (Kilo Tons) …………………………………………… 327
11.5.13.3 Turkey Insecticides Market Revenue, By Source,
2015 – 2020 (USD Million) …………………………………. 328
11.5.13.4 Turkey Insecticides Market Revenue, By Source,
2021 – 2026 (USD Million) …………………………………. 328
11.5.14 Turkey Insecticides by Crop Analysis ………………………………………………………. 329
11.5.14.1 Turkey Insecticides Market Volume, By Crop, 2015 –
2020 (Kilo Tons) …………………………………………….. 329
11.5.14.2 Turkey Insecticides Market Volume, By Crop, 2021 –
2026 (Kilo Tons) …………………………………………….. 329
11.5.14.3 Turkey Insecticides Market Revenue, By Crop, 2015
– 2020 (USD Million) ………………………………………… 330
11.5.14.4 Turkey Insecticides Market Revenue, By Crop, 2021
– 2026 (USD Million) ………………………………………… 330
11.5.15 Turkey Insecticides by Form Analysis ……………………………………………………… 331
11.5.15.1 Turkey Insecticides Market Volume, By Form, 2015
– 2020 (Kilo Tons) …………………………………………… 331
11.5.15.2 Turkey Insecticides Market Volume, By Form, 2021
– 2026 (Kilo Tons) …………………………………………… 331
11.5.15.3 Turkey Insecticides Market Revenue, By Form, 2015
– 2020 (USD Million) ………………………………………… 332
11.5.15.4 Turkey Insecticides Market Revenue, By Form, 2021
– 2026 (USD Million) ………………………………………… 332
11.5.16 Turkey Insecticides Type Analysis ………………………………………………………….. 333
11.5.16.1 Turkey Insecticides Market Volume, By Type, 2015 –
2020 (Kilo Tons) …………………………………………….. 333
11.5.16.2 Turkey Insecticides Market Volume, By Type, 2021 –
2026 (Kilo Tons) …………………………………………….. 333
11.5.16.3 Turkey Insecticides Market Revenue, By Type, 2015
– 2020 (USD Million) ………………………………………… 334
11.5.16.4 Turkey Insecticides Market Revenue, By Type, 2021
– 2026 (USD Million) ………………………………………… 334
11.5.17 South Africa Insecticides Source Analysis ………………………………………………… 335
11.5.17.1 South Africa Insecticides Market Volume, By Source,
2015 – 2020 (Kilo Tons) ……………………………………. 335
11.5.17.2 South Africa Insecticides Market Volume, By Source,
2021 – 2026 (Kilo Tons) ……………………………………. 335
11.5.17.3 South Africa Insecticides Market Revenue, By
Source, 2015 – 2020 (USD Million) ………………………. 336
11.5.17.4 South Africa Insecticides Market Revenue, By
Source, 2021 – 2026 (USD Million) ………………………. 336
11.5.18 South Africa Insecticides by Crop Analysis ………………………………………………. 337
11.5.18.1 South Africa Insecticides Market Volume, By Crop,
2015 – 2020 (Kilo Tons) ……………………………………. 337
11.5.18.2 South Africa Insecticides Market Volume, By Crop,
2021 – 2026 (Kilo Tons) ……………………………………. 337
11.5.18.3 South Africa Insecticides Market Revenue, By Crop,
2015 – 2020 (USD Million) …………………………………. 338
11.5.18.4 South Africa Insecticides Market Revenue, By Crop,
2021 – 2026 (USD Million) …………………………………. 338
11.5.19 South Africa Insecticides by Form Analysis ………………………………………………. 339
11.5.19.1 South Africa Insecticides Market Volume, By Form,
2015 – 2020 (Kilo Tons) ……………………………………. 339
11.5.19.2 South Africa Insecticides Market Volume, By Form,
2021 – 2026 (Kilo Tons) ……………………………………. 339
11.5.19.3 South Africa Insecticides Market Revenue, By Form,
2015 – 2020 (USD Million) …………………………………. 340
11.5.19.4 South Africa Insecticides Market Revenue, By Form,
2021 – 2026 (USD Million) …………………………………. 340
11.5.20 South Africa Insecticides Type Analysis …………………………………………………… 341
11.5.20.1 South Africa Insecticides Market Volume, By Type,
2015 – 2020 (Kilo Tons) ……………………………………. 341
11.5.20.2 South Africa Insecticides Market Volume, By Type,
2021 – 2026 (Kilo Tons) ……………………………………. 341
11.5.20.3 South Africa Insecticides Market Revenue, By Type,
2015 – 2020 (USD Million) …………………………………. 342
11.5.20.4 South Africa Insecticides Market Revenue, By Type,
2021 – 2026 (USD Million) …………………………………. 342

Chapter 12 Global Insecticides Market Segment by Source ……… 343
12.1 Global Insecticides Market Share By Source, 2019 ………………………………………………. 343
12.1.1 Global Insecticides Market Volume, By Source, 2015 – 2020 (Kilo Tons) ………… 343
12.1.2 Global Insecticides Market Volume, By Source, 2021 – 2026 (Kilo Tons) ………… 344
12.1.3 Global Insecticides Market Revenue, By Source, 2015 – 2020 (USD Million) …… 344
12.1.4 Global Insecticides Market Revenue, By Source, 2021 – 2026 (USD Million) …… 344

Chapter 13 Global Insecticides Market Segment by Crop …………. 345
13.1 Global Insecticides Market Share By Crop, 2019 …………………………………………………. 345
13.1.1 Global Insecticides Market Volume, By Crop, 2015 – 2020 (Kilo Tons) …………… 346
13.1.2 Global Insecticides Market Volume, By Crop, 2021 – 2026 (Kilo Tons) …………… 346
13.1.3 Global Insecticides Market Revenue, By Crop, 2015 – 2020 (USD Million) ……… 347
13.1.4 Global Insecticides Market Revenue, By Crop, 2021 – 2026 (USD Million) ……… 347

Chapter 14 Global Insecticides Market Segment by Form …………. 348
14.1 Global Insecticides Market Share By Form, 2019…………………………………………………. 348
14.1.1 Global Insecticides Market Volume, By Form, 2015 – 2020 (Kilo Tons) ………….. 348
14.1.2 Global Insecticides Market Volume, By Form, 2021 – 2026 (Kilo Tons) ………….. 349
14.1.3 Global Insecticides Market Revenue, By Form, 2015 – 2020 (USD Million) ……… 349
14.1.4 Global Insecticides Market Revenue, By Form, 2021 – 2026 (USD Million) ……… 349

Chapter 15 Global Insecticides Market Segment by Type …………. 350
15.1 Global Insecticides Market Share By Type, 2019 …………………………………………………. 350
15.1.1 Global Insecticides Market Volume, By Type, 2015 – 2020 (Kilo Tons) …………… 351
15.1.2 Global Insecticides Market Volume, By Type, 2021 – 2026 (Kilo Tons) …………… 351
15.1.3 Global Insecticides Market Revenue, By Type, 2015 – 2020 (USD Million) ……… 352
15.1.4 Global Insecticides Market Revenue, By Type, 2021 – 2026 (USD Million) ……… 352

Chapter 16 Insecticides Manufacturing Cost Structure …………….. 353
16.1 Insecticides Manufacturing Cost Structure …………………………………………………………. 353
16.2 Raw Material Cost Analysis ……………………………………………………………………………… 354
16.3 Labor Cost Analysis ………………………………………………………………………………………… 354
16.4 List of Insecticides Manufacturers …………………………………………………………………….. 355

Chapter 17 Marketing Strategy Analysis …………………………………… 356
17.1 Marketing Channel …………………………………………………………………………………………. 356
17.1.1 Direct Marketing ……………………………………………………………………………….. 356
17.1.2 Indirect Marketing ……………………………………………………………………………… 356
17.1.3 Marketing Channel Development Trend …………………………………………………. 357
17.2 Market Positioning …………………………………………………………………………………………. 357
17.2.1 Pricing Strategy …………………………………………………………………………………. 357
17.2.2 Brand Strategy…………………………………………………………………………………… 357
17.2.3 Target Client ……………………………………………………………………………………… 357

Chapter 18 Research Findings and Conclusion ……………………….. 358

Chapter 19 Appendix ……………………………………………………………….. 359
19.1 Research Approach ………………………………………………………………………………………… 359
19.1.1 Research Programs/Design ………………………………………………………………….. 359
19.1.2 Market Size Estimation ……………………………………………………………………….. 360
19.2 Research Methodology …………………………………………………………………………………… 361
19.2.1 Phase I – Secondary Research ………………………………………………………………. 362
19.2.2 Phase II – Primary Research …………………………………………………………………. 362
19.2.3 Phase III – Expert Panel Review …………………………………………………………….. 363
19.2.4 Assumptions……………………………………………………………………………………… 363
19.2.5 Market Breakdown and Data Triangulation …………………………………………….. 363
19.3 Unit Considered and Currency ………………………………………………………………………….. 364

Frequently Asked Questions

What is the current size of the global insecticides market?

The global insecticides market was valued at USD 8.9 Billion in 2022.

What is the expected growth rate of the insecticides market between 2023 and 2030?

The insecticides market is expected to grow at a CAGR of 4.80% between 2023 and 2030, reaching USD 12.4 Billion in 2030.

Which segment is leading the market share in terms of type?

Organophosphorus category is the leading segment by type, holding over 42% share in terms of value in 2022.

Which form segment governs the demand for insecticides in the world?

The sprays segment governs the demand for insecticides in the world, holding a massive share of over 49% in 2022.

Which formulation segment is expected to post the highest CAGR during the forecast period?

The suspension concentrate segment is expected to post the highest CAGR during the forecast period.

Which region is fueling the growth of the insecticides industry?

Asia Pacific is fueling the growth of the insecticides industry, with over one-third share in 2022.

Who are the major players in the global insecticides market?

The top players include AMVAC Chemical Corp.; UPL Ltd.; Bayer AG; BASF SE; FMC Corp.; Corteva Agriscience; Nufarm Ltd.; Bioworks, Inc.; and Syngenta Group.

What are the major market drivers of the insecticides industry?

One of the main factors propelling the expansion of the insecticides industry is the increase in pressure to meet rising consumer food demand as a result of the vast global population.

What are the major market restraints of the insecticides industry?

Insecticide market growth is anticipated to be hampered by the implementation of strict government regulations and rising worries about insect resistance.

What are the major market opportunities of the insecticides industry?

The projected period has lucrative prospects for the insecticides market players due to the rising demand in emerging countries, the adoption of integrated pest management (IPM), and research & development programmes to launch new products.

Cosmetic Ingredients Market

Published:
Report ID: 3703

Hydrocolloids Market

Published:
Report ID: 36265

Ion Exchange Resins Market

Published:
Report ID: 36220

Herbal Extract Market

Published:
Report ID: 36211

Fiber Reinforced Polymer (FRP) Composites Market

Published:
Report ID: 36197

Bio-based Polycarbonate Market

Published:
Report ID: 36188

Middle East and Africa Carbon Black Market

Published:
Report ID: 36181

India Thermic Fluids Market

Published:
Report ID: 36178

Europe Green Hydrogen Market

Published:
Report ID: 36175

Dodecanedioic Acid Market

Published:
Report ID: 36167

Asia Pacific Nickel Mining Market

Published:
Report ID: 36084

Asphalt Additives Market

Published:
Report ID: 36074

Purchase Options

$2999
Delivery Format: Excel.
$4999
Designed for the individual purchaser.
$6999
Users located at a single corporate site or regional office.
$7999
Allowed for unlimited sharing globally within one company.
Smallform of Sample request

Have a question?

User Profile

Don’t settle for less – trust Mitul to help you find the best solution.

Report delivery within 24 to 48 hours

– Other Info –

What people say?-

User Review

I am very impressed with the information in this report. The author clearly did their research when they came up with this product and it has already given me a lot of ideas.

Jana Schmidt
CEDAR CX Technologies

– Connect with us –

Phone

+91 6232 49 3207


support

24/7 Research Support


sales@credenceresearch.com

– Research Methodology –

Going beyond the basics: advanced techniques in research methodology

– Trusted By –

Pepshi, LG, Nestle
Motorola, Honeywell, Johnson and johnson
LG Chem, SIEMENS, Pfizer
Unilever, Samsonite, QIAGEN