
Market Overview
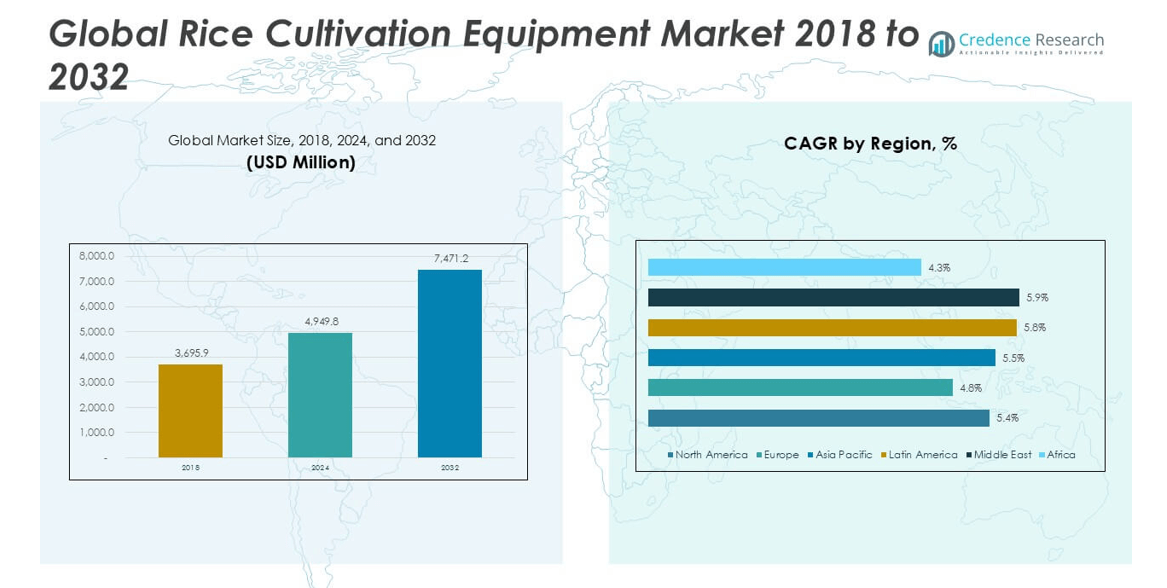
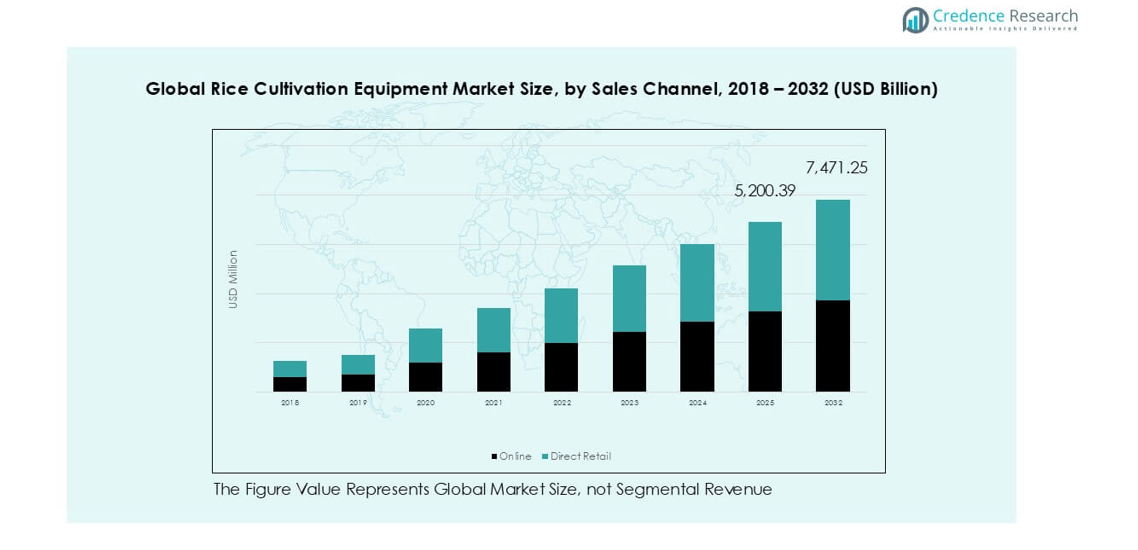
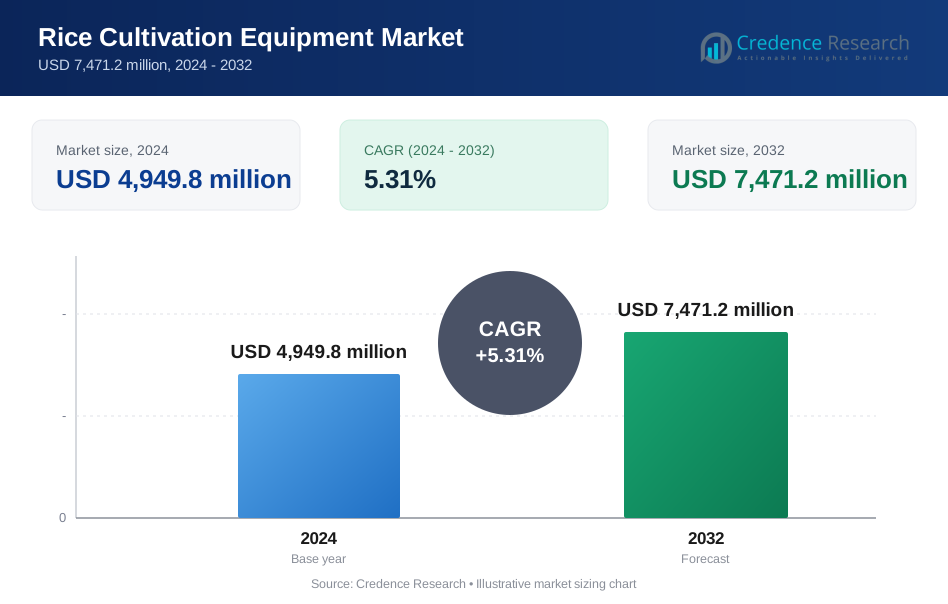
Global Rice Cultivation Equipment market size was valued at USD 3,695.9 million in 2018 to USD 4,949.8 million in 2024 and is anticipated to reach USD 7,471.2 million by 2032, at a CAGR of 5.31% during the forecast period.
| REPORT ATTRIBUTE | DETAILS |
|---|---|
| Historical Period | 2020-2023 |
| Base Year | 2024 |
| Forecast Period | 2025-2032 |
| Rice Cultivation Equipment Market Size 2024 | USD 4,949.8 million |
| Rice Cultivation Equipment Market, CAGR | 5.31% |
| Rice Cultivation Equipment Market Size 2032 | USD 7,471.2 million |
The global rice cultivation equipment market includes strong participation from Kubota Corporation, ISEKI & CO. Ltd, CLAAS KGaA mbH, Yanmar Agricultural Equipment, and several regional manufacturers. These players compete through broad product portfolios, strong dealer networks, and after-sales support. Asia Pacific leads the market with an exact 34.2% share, driven by high rice production and mechanization programs. Europe follows with a 26.7% share, supported by structured farming and replacement demand. North America holds a 22.9% share, led by large-scale mechanized farms. Leading companies focus on technology upgrades and regional expansion to strengthen competitive positioning.
Market Insights
- Market overview shows growth from USD 4,949.8 million in 2024 to USD 7,471.2 million by 2032, at a CAGR of 5.31%, with Asia Pacific holding 34.2% share and harvesting equipment leading the product segment.
- Market drivers include rising farm labor shortages, higher mechanization demand, and government subsidies that support transplanting and harvesting equipment adoption across major rice-producing regions.
- Market trends highlight increasing use of precision farming equipment, expansion of custom hiring models, and steady demand for integrated milling solutions to improve grain quality and reduce losses.
- Competitive analysis reflects strong presence of global players like Kubota and Yanmar, while regional manufacturers compete on pricing, local service networks, and application-specific designs.
- Market restraints and regional analysis show high equipment costs and limited financing as challenges, while Asia Pacific leads demand, Europe and North America show stable replacement cycles, and Latin America, Middle East, and Africa record gradual mechanization growth.
Market Segmentation Analysis:
By Product
The Product segment shows strong adoption across the full rice production cycle. Rice harvesting equipment holds the dominant market share due to labor shortages and large-scale mechanized farming. Farmers prefer harvesters for faster field clearing and lower crop losses. Rice transplanting equipment follows, driven by demand for uniform planting and yield improvement. Rice milling equipment maintains steady demand from integrated millers seeking quality control. Rice threshing equipment supports small and mid-size farms, where cost efficiency and simple operation remain key purchase drivers across emerging rice-producing regions.
- For instance, Kubota’s DC-70G Plus combine harvester clears up to 0.7 hectares per hour under standard field conditions.
By Sales Channel
The Sales Channel segment remains led by direct retail, which accounts for the dominant market share. Farmers value direct retail for product demonstrations, after-sales service, and spare part availability. Dealer networks also support financing and maintenance, which strengthens buyer trust. Online channels show faster growth from small equipment buyers and replacement demand. Digital platforms improve price comparison and access in remote areas. However, high equipment value and service needs keep direct retail as the preferred channel for primary equipment purchases.
- For instance, Mahindra & Mahindra operates over 1,200 farm equipment dealerships (touchpoints) across India, which are part of a larger total network of 3,500 dealers for both its Automotive and Farm Equipment businesses, supporting sales and service access.
Key Growth Drivers
Rising Mechanization to Address Farm Labor Shortages
Rice-growing regions face persistent farm labor shortages and rising wage pressure. Farmers adopt mechanized equipment to maintain planting and harvesting schedules. Transplanting machines reduce manual labor during peak seasons. Harvesters shorten crop cycles and limit yield losses. Mechanization improves operational speed across large and fragmented farms. Governments support equipment adoption through subsidies and credit programs. These initiatives lower ownership barriers for smallholders. Custom hiring centers also expand access to modern machinery. Equipment use improves productivity per hectare. Consistent output supports food security goals. This driver remains strong across Asia-Pacific and parts of Africa. Labor efficiency gains continue to justify capital investment in rice cultivation equipment.
- For instance, India has established over 74,000 custom hiring centers (CHCs) that provide a wide range of agricultural equipment to smallholders.
Government Support for Agricultural Modernization
Public policy strongly influences equipment demand across rice-producing economies. Governments promote mechanization to improve farm income stability. Subsidy programs reduce upfront equipment costs. Many regions offer tax benefits for agricultural machinery purchases. Rural credit schemes improve financing access for small farmers. Mechanization aligns with national food security strategies. Public extension services also train farmers on equipment usage. These efforts reduce adoption risk. State-led procurement programs support bulk equipment deployment. Infrastructure investment improves machinery penetration in remote areas. Policy-backed modernization remains a major growth driver. It ensures steady equipment demand across multiple rice cultivation stages.
- For instance, India’s Sub-Mission on Agricultural Mechanization supported over 1.5 million machinery units through financial assistance.
Rising Demand for Higher Yield and Crop Quality
Farmers seek consistent yields to offset climate and input cost risks. Equipment enables precise planting and uniform crop spacing. Transplanting machines improve root establishment and plant survival. Harvesting equipment reduces grain damage during collection. Milling equipment improves grain quality and market value. Quality-focused production supports export standards. Mechanized processes reduce post-harvest losses. Yield optimization improves farm profitability. Commercial growers prioritize equipment with performance reliability. This demand strengthens replacement and upgrade cycles. Productivity-focused farming practices continue to drive equipment investment decisions.
Key Trends & Opportunities
Growth of Precision and Smart Rice Farming Solutions
Precision farming gains traction in rice cultivation systems. Equipment integrates sensors and digital controls. Smart transplanting machines improve spacing accuracy. GPS-enabled harvesters support efficient field coverage. Data-driven operations reduce fuel and input waste. Equipment manufacturers invest in automation features. These solutions support large commercial farms first. Gradual adoption follows among mid-size growers. Digital monitoring improves maintenance planning. Smart equipment enhances long-term cost efficiency. This trend creates opportunities for premium equipment offerings. Technology integration strengthens product differentiation in competitive markets.
- For instance, Yanmar’s Smart Assist Remote system enables straight-line transplanting with positional accuracy within 2.5 centimeters using GNSS guidance.
Expansion of Custom Hiring and Equipment Leasing Models
Custom hiring centers expand equipment access for smallholders. Farmers avoid high capital investment through rental models. Governments and cooperatives support shared equipment programs. Leasing improves utilization rates for high-cost machinery. Service providers invest in modern equipment fleets. This model accelerates mechanization penetration. Seasonal demand supports flexible rental pricing. Equipment manufacturers partner with service operators. Leasing expands aftermarket service demand. This trend opens new revenue channels. It supports wider market reach beyond direct ownership models.
Key Challenges
High Initial Equipment Cost and Financing Barriers
High equipment prices limit adoption among small farmers. Many growers lack access to formal credit. Interest rates remain high in some rural markets. Limited collateral restricts loan approval. Currency volatility increases import equipment costs. Financing delays affect purchase timing. Subsidies do not always cover advanced machinery. Smallholders depend on seasonal income cycles. Maintenance costs also raise ownership concerns. These factors slow penetration in low-income regions. Cost sensitivity remains a key market challenge. Manufacturers must balance pricing with feature expansion.
Limited Technical Skills and After-Sales Infrastructure
Equipment operation requires trained operators and technicians. Skill gaps affect machine efficiency and lifespan. Rural areas face limited service network coverage. Spare part availability remains inconsistent. Downtime risks discourage first-time buyers. Training programs remain uneven across regions. Improper usage increases maintenance costs. Farmers prefer familiar tools over advanced machines. Weak after-sales support reduces brand trust. Infrastructure gaps slow technology adoption. Addressing service and training needs remains critical. This challenge impacts long-term equipment utilization rates.
Regional Analysis
North America
North America accounted for about 22.9% market share in 2018, with a value of USD 846.00 million. The region shows steady adoption of mechanized rice farming. Large farm sizes support equipment penetration. Farmers invest in harvesters and milling systems to improve efficiency. Strong dealer networks support equipment maintenance. Government programs promote farm productivity upgrades. The market reached USD 1,137.47 million in 2024. It is projected to reach USD 1,725.86 million by 2032, growing at a CAGR of 5.4%. Replacement demand and technology upgrades continue to support regional growth.
Europe
Europe held nearly 26.7% market share in 2018, valued at USD 987.92 million. The region benefits from structured farming practices and policy-backed mechanization. Southern European countries drive rice equipment demand. Farmers focus on efficiency and yield consistency. Environmental compliance supports modern equipment adoption. The market reached USD 1,286.38 million in 2024. It is expected to reach USD 1,867.81 million by 2032, registering a CAGR of 4.8%. Moderate growth reflects mature markets and steady replacement cycles across key rice-producing zones.
Asia Pacific
Asia Pacific dominated the market with about 34.2% share in 2018, valued at USD 1,265.11 million. The region leads global rice production and consumption. High labor dependence drives mechanization demand. Government subsidies accelerate equipment adoption. Small and mid-scale farms increasingly use transplanting and harvesting machines. The market expanded to USD 1,710.86 million in 2024. It is projected to reach USD 2,615.68 million by 2032, at a CAGR of 5.5%. Rising food demand and productivity goals sustain strong regional momentum.
Latin America
Latin America captured around 9.7% market share in 2018, with a value of USD 357.40 million. Commercial rice farming supports equipment use in key countries. Mechanization improves efficiency in large fields. Farmers adopt harvesters to reduce crop losses. The market reached USD 492.86 million in 2024. It is expected to reach USD 772.53 million by 2032, growing at a CAGR of 5.8%. Export-oriented production and improving farm infrastructure continue to support equipment demand across the region.
Middle East
The Middle East represented about 4.3% market share in 2018, valued at USD 160.40 million. Rice cultivation remains limited but strategic. Equipment adoption focuses on water efficiency and yield control. Government-backed food security programs support mechanized farming. The market reached USD 221.82 million in 2024. It is projected to reach USD 348.91 million by 2032, at a CAGR of 5.9%. Controlled farming practices and technology-driven irrigation systems drive steady growth despite climatic constraints.
Africa
Africa accounted for nearly 2.1% market share in 2018, with a value of USD 79.09 million. The region shows gradual mechanization progress. Smallholder farms dominate rice cultivation. Governments promote equipment use to reduce imports. Donor-funded programs support machinery access. The market reached USD 100.41 million in 2024. It is expected to reach USD 140.46 million by 2032, growing at a CAGR of 4.3%. Infrastructure development and food security initiatives support long-term equipment adoption.
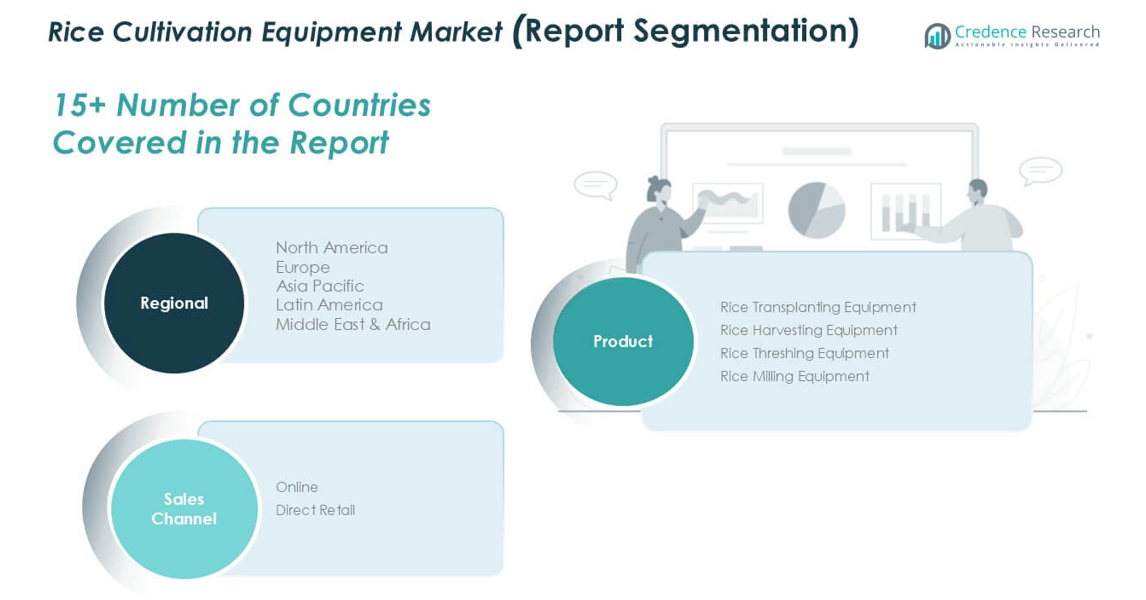
Market Segmentations:
By Product
- Rice Transplanting Equipment
- Rice Harvesting Equipment
- Rice Threshing Equipment
- Rice Milling Equipment
By Sales Channel
- Online
- Direct Retail
By Geography
- North America
- U.S.
- Canada
- Mexico
- Europe
- Germany
- France
- U.K.
- Italy
- Spain
- Rest of Europe
- Asia Pacific
- China
- Japan
- India
- South Korea
- South-east Asia
- Rest of Asia Pacific
- Latin America
- Brazil
- Argentina
- Rest of Latin America
- Middle East & Africa
- GCC Countries
- South Africa
- Rest of the Middle East and Africa
Competitive Landscape
The competitive landscape of the global rice cultivation equipment market features a mix of multinational manufacturers and strong regional players. Leading companies focus on broad product portfolios covering transplanting, harvesting, and milling equipment. Global brands leverage advanced engineering, strong dealer networks, and reliable after-sales support to retain customer loyalty. Regional manufacturers compete through cost-effective solutions and localized designs. Companies invest in product upgrades to improve fuel efficiency and operational accuracy. Strategic partnerships strengthen distribution reach in emerging markets. Firms also expand service centers to reduce equipment downtime. Competition centers on durability, service availability, and pricing balance. Continuous innovation and regional expansion shape long-term positioning.
Key Player Analysis
- Kubota Corporation
- ISEKI & CO. Ltd
- Class KGaA mbH
- Yanmar Agricultural Equipment (China) Co., Ltd
- Shandong Fuerwo Agricultural Equipment Co., Ltd.
- Annapurna Agronics
- Suri Engineers
- Sona Machinery Ltd
- ZaccariaUSA
- DawnAgro
Recent Developments
- In 2024, Mahindra & Mahindra Launched the “Mahindra 6RO Paddy Walker,” a 6-row paddy transplanter in India, designed for higher efficiency and reduced fuel consumption.
- In 2024, Bühler opened a new Grain Innovation Center in Switzerland.
- In 2023, Fowler Westrup acquired the Netherlands-based Seed Processing Holland (SPH), strengthening their portfolio and global footprint in seed and grain processing technology, emphasizing automation and sustainability in post-harvest solutions.
Report Coverage
The research report offers an in-depth analysis based on Product, Sales Channel and Geography. It details leading market players, providing an overview of their business, product offerings, investments, revenue streams, and key applications. Additionally, the report includes insights into the competitive environment, SWOT analysis, current market trends, as well as the primary drivers and constraints. Furthermore, it discusses various factors that have driven market expansion in recent years. The report also explores market dynamics, regulatory scenarios, and technological advancements that are shaping the industry. It assesses the impact of external factors and global economic changes on market growth. Lastly, it provides strategic recommendations for new entrants and established companies to navigate the complexities of the market.
Future Outlook
- Mechanization adoption will increase to address labor shortages in rice farming.
- Governments will continue supporting equipment purchases through subsidy programs.
- Harvesting equipment will retain a dominant position across major rice regions.
- Demand for transplanting machines will rise to improve planting uniformity.
- Precision and automated features will gain wider acceptance among commercial farms.
- Custom hiring and leasing models will expand equipment accessibility.
- Manufacturers will focus on fuel efficiency and lower operating costs.
- After-sales service networks will become a key competitive factor.
- Emerging regions will show gradual growth through infrastructure development.
- Replacement demand will support stable long-term market expansion.
Request a Free Sample
Fill in your details and we'll send you a free sample report.
- Sample data tables & charts
- Research methodology
Need a Custom Version of This Report?
Tailor the scope, geography, or segments to your exact requirements.
- Custom geography or segment scope
- Direct access to our analyst team
Frequently Asked Questions
What is the current market size for Rice Cultivation Equipment Market, and what is its projected size in 2032?
At what Compound Annual Growth Rate is the Rice Cultivation Equipment Market projected to grow between 2025 and 2032?
Who are the major players in this market?
What are the primary factors fueling the growth of the Rice Cultivation Equipment Market?
Who are the leading companies in the Rice Cultivation Equipment Market?
Table of Content
Chapter 1. Report Introduction
- 1.1 Report Description & Purpose
- 1.1.1 Report Title & Market Definition
- 1.1.2 Unique Selling Propositions (USP) & Key Differentiators
- 1.1.3 Value Proposition for Stakeholders
- 1.2 Research Objectives
- 1.2.1 Market Sizing Objectives (Volume & Revenue) (Volume Where Applicable)
- 1.2.2 Segmentation Objectives
- 1.2.3 Competitive Intelligence Objectives
- 1.2.4 Forecast & Scenario Objectives
- 1.3 Report Scope
- 1.3.1 Rice Cultivation Equipment Scope – Segments & Subsegments Covered
- 1.3.2 Geographic Scope – Regions & Countries Covered
- 1.3.3 Historical Period, Base Year & Forecast Period (2024; forecast to 2032)
- 1.3.4 Inclusions & Exclusions
- 1.4 Industry Classification & Applicable Codes
- 1.5 Currency, Measurement Units & Valuation Basis
- 1.6 Target Stakeholders
- 1.7 Limitations & Assumptions
Chapter 2. Executive Summary
- 2.1 Global Rice Cultivation Equipment Market Snapshot
- 2.1.1 Market Size – Historical (2024) & Forecast (2024-2032) (2024: USD 4,949.8 million → 2032: USD 7,471.2 million)
- 2.1.2 Volume & Revenue – Global Totals (Volume Where Applicable)
- 2.1.3 Key Market Highlights – Top Five Facts
- 2.2 Rice Cultivation Equipment Market Segmentation Snapshot
- 2.2.1 Market Split by Region – 2024 vs. 2032
- 2.3 Competitive Snapshot
- 2.3.1 Top 10 Players by Revenue Share – 2024
- 2.3.2 Top 10 Players by Volume Share – 2024 (Volume Where Applicable)
- 2.3.3 Recent Strategic Developments (18-Month Summary)
- 2.4 Key Investment Highlights & Strategic Conclusions
Chapter 3. Rice Cultivation Equipment Market Dynamics & Industry Analysis
- 3.1 Market Overview & Context
- 3.1.1 Rice Cultivation Equipment Market Position in the Broader Industry Value Chain
- 3.1.2 Demand Structure & Purchasing Dynamics
- 3.1.3 Market Maturity & Development Stage by Region
- 3.2 Rice Cultivation Equipment Market Drivers
- 3.3 Rice Cultivation Equipment Market Restraints & Challenges
- 3.4 Rice Cultivation Equipment Market Opportunities
- 3.5 Porter's Five Forces Analysis
- 3.5.1 Threat of New Entrants
- 3.5.2 Bargaining Power of Suppliers
- 3.5.3 Bargaining Power of Buyers
- 3.5.4 Threat of Substitutes
- 3.5.5 Competitive Rivalry – Intensity Assessment
- 3.6 Rice Cultivation Equipment Value Chain Analysis
- 3.6.1 Upstream – Key Inputs, Resources & Suppliers
- 3.6.1.1 Key Input/Resource 1
- 3.6.1.2 Key Input/Resource 2
- 3.6.1.3 Key Input/Resource 3
- 3.6.2 Midstream – Core Operations & Value Creation
- 3.6.2.1 Operating Model & Process Overview
- 3.6.2.2 Key Operating Locations & Capabilities by Company
- 3.6.3 Downstream – Market Channels & End Users
- 3.6.3.1 Direct Sales & Customer Engagement Channels
- 3.6.3.2 Indirect Sales, Intermediaries & Partner Channels
- 3.6.4 Value Chain Profitability Analysis
- 3.6.1 Upstream – Key Inputs, Resources & Suppliers
- 3.7 PESTEL Analysis
- 3.7.1 Political Factors
- 3.7.2 Economic Factors
- 3.7.3 Social Factors
- 3.7.4 Technological Factors
- 3.7.5 Environmental Factors
- 3.7.6 Legal Factors
- 3.8 Rice Cultivation Equipment Supply Chain Analysis
- 3.8.1 Critical Input & Resource Availability Risk Assessment
- 3.8.2 Supplier & Operational Concentration Risk (Geographic Exposure)
- 3.8.3 Supply & Service Disruption Impact Analysis
- 3.9 Regulatory & Policy Landscape
Note: The regulatory and policy landscape section covers regulations based on their applicability to the market, Rice Cultivation Equipment category, geography, and scope of the study. Only regulatory frameworks with a material impact on operations, compliance, trade, sustainability, or market access are analyzed in detail.
Chapter 4. Key Investment Pockets & Opportunity Analysis
- 4.1 Rice Cultivation Equipment Market Attractiveness Analysis
- 4.1.1 By Region – Investment Attractiveness Matrix (Market Size × CAGR)
- 4.2 Absolute Revenue Growth Opportunity
- 4.2.1 By Region – Absolute Revenue Growth Through 2032
- 4.3 Incremental Demand Opportunity
- 4.3.1 By Region – Incremental Demand Through 2032
- 4.3.2 Segment – Incremental Demand
- 4.4 Emerging Submarket Opportunity Deep Dive (Subject to Applicability)
- 4.5 Priority Market Opportunity Scorecards
- 4.5.1 United States
- 4.5.2 Europe
- 4.5.3 Asia
- 4.5.4 Middle East & Africa
Note: Priority market opportunity scorecards reflect the geographic scope and strategic relevance of the study. Listed markets are indicative and may be adapted to the industry.
Chapter 5. Rice Cultivation Equipment Cross-Border Trade & Market Access Analysis
- 5.1 International Trade & Cross-Border Activity Overview
- 5.1.1 Global Export Value by Country (2024)
- 5.1.2 Global Export Volume by Country (2024) (Volume Where Applicable)
- 5.1.3 Global Import Value by Country (2024)
- 5.1.4 Global Import Volume by Country (2024) (Volume Where Applicable)
- 5.1.5 Net Trade Balance by Country (2024)
- 5.2 Export Analysis – Segment
- 5.2.1 Category 1 (Applicable Classification Code)
- 5.2.2 Category 2 (Applicable Classification Code)
- 5.2.3 Category 3 (Applicable Classification Code)
- 5.2.4 Category 4 (Applicable Classification Code)
- 5.2.5 Category 5 (Applicable Classification Code)
- 5.3 Import Analysis – Segment
- 5.3.1 Category 1 (Applicable Classification Code)
- 5.3.2 Category 2 (Applicable Classification Code)
- 5.3.3 Category 3 (Applicable Classification Code)
- 5.3.4 Category 4 (Applicable Classification Code)
- 5.3.5 Category 5 (Applicable Classification Code)
- 5.4 Cross-Border Pricing & Transaction Benchmarks
- 5.4.1 Export Pricing – Segment & Country
- 5.4.2 Import Pricing – Segment & Source Country
- 5.4.3 Price Trends (2024)
- 5.5 Key Cross-Border Trade & Delivery Routes
- 5.5.1 Cross-Border Trade/Delivery Route 1
- 5.5.2 Cross-Border Trade/Delivery Route 2
- 5.5.3 Cross-Border Trade/Delivery Route 3
- 5.5.4 Cross-Border Trade/Delivery Route 4
- 5.5.5 Cross-Border Trade/Delivery Route 5
- 5.6 Trade Policy & Market Access Impact Assessment
- 5.6.1 Tariff & Non-Tariff Barriers
- 5.6.2 Regional Trade & Economic Integration Frameworks
- 5.6.3 Bilateral & Multilateral Trade Agreements
- 5.6.4 Cross-Border Operating, Licensing & Localization Requirements
Note: This chapter applies where cross-border trade or delivery is relevant to Rice Cultivation Equipment. Goods, services, and digital offerings are assessed using applicable classifications and transaction measures. Import-export volumes, trade balances, and route analyses are included only where meaningful to the market.
Chapter 6. Competitive Landscape & Company Benchmarking
- 6.1 Rice Cultivation Equipment Market Concentration & Structure
- 6.1.1 Herfindahl-Hirschman Index (HHI) – vs. 2024
- 6.1.2 Leading, Mid-Sized & Emerging Player Structure
- 6.1.3 Global, Regional & Local Player Dynamics
- 6.2 Rice Cultivation Equipment Market Share Analysis – 2024
- 6.2.1 Global Revenue Share by Company
- 6.2.2 Global Volume Share by Company (Volume Where Applicable)
- 6.2.3 Regional Revenue Share
- 6.2.4 Market Share Evolution ( vs. 2024)
- 6.2.5 Company Market Share by Key Segment
- 6.2.6 Company Market Share by Customer Group
- 6.3 Operating Scale, Capacity & Infrastructure Analysis
- 6.3.1 Global Operating Scale & Supply Capacity
- 6.3.2 Resource Utilization & Operating Efficiency
- 6.3.3 Output, Service Delivery & Activity Metrics
- 6.3.4 Operating Footprint & Infrastructure Map
- 6.3.5 Planned Operational & Capacity Expansion
- 6.4 Rice Cultivation Equipment Competitive Benchmarking Matrix
- 6.4.1 Revenue, Growth, Profitability & Operating Metric Comparison
- 6.4.2 Channel Revenue Mix
- 6.4.3 Geographic Revenue Exposure
- 6.4.4 R&D Intensity
- 6.4.5 Sustainability Maturity
- 6.5 Strategic Developments in Rice Cultivation Equipment (Last 24 Months)
- 6.5.1 Mergers, Acquisitions & Divestments
- 6.5.2 New Products, Services & Solutions in Rice Cultivation Equipment
- 6.5.3 Operational & Infrastructure Expansions
- 6.5.4 Strategic Alliances, Joint Ventures & Partnerships
- 6.5.5 Distribution Expansion & Market Entry
- 6.5.6 Sustainability & ESG Initiatives
- 6.6 Competitive Strategy Mapping
- 6.6.1 Leader, Challenger, Follower & Niche Classification
- 6.6.2 Pricing Strategy Comparison
- 6.6.3 Channel Strategy Matrix
Note: Strategic developments are included based on their materiality and the availability of reliable information.
Chapter 7. Global Rice Cultivation Equipment Market – By Sales & Delivery Channel
- 7.1 Segment Overview
- 7.1.1 Volume & Revenue Split by Channel (2024 & 2032) (Volume Where Applicable)
- 7.1.2 Channel Mix Evolution (2024-2032)
Chapter 8. Regional Market Analysis – Global Overview
- 8.1 Global Regional Overview
- 8.1.1 Regional Volume Share (Volume Where Applicable)
- 8.1.2 Regional Revenue Share
- 8.1.3 Regional Volume by Region (Volume Where Applicable)
- 8.1.4 Regional Revenue by Region
- 8.1.5 Regional Forecast Through 2032
- 8.2 Cross-Regional Segment Analysis
- 8.2.1 By Sales & Delivery Channel
- 8.2.2 By Competitive Positioning & Price Tier
Chapter 9. North America Rice Cultivation Equipment Market
- 9.1 United States
- 9.2 Canada
- 9.3 Mexico
Chapter 10. Europe Rice Cultivation Equipment Market
- 10.1 Germany
- 10.2 France
- 10.3 Italy
- 10.4 United Kingdom
- 10.5 Spain
- 10.6 Poland
- 10.7 Russia
- 10.8 Netherlands
- 10.9 Belgium
- 10.10 Sweden
- 10.11 Denmark
- 10.12 Norway
- 10.13 Rest of Europe
Chapter 11. Asia Pacific Rice Cultivation Equipment Market
- 11.1 China
- 11.2 India
- 11.3 Japan
- 11.4 South Korea
- 11.5 Thailand
- 11.6 Indonesia
- 11.7 Vietnam
- 11.8 Malaysia
- 11.9 Australia
- 11.10 Rest of Asia Pacific
Chapter 12. Latin America Rice Cultivation Equipment Market
- 12.1 Brazil
- 12.2 Argentina
- 12.3 Colombia
- 12.4 Chile
- 12.5 Rest of Latin America
Chapter 13. Middle East Rice Cultivation Equipment Market
- 13.1 Saudi Arabia
- 13.2 United Arab Emirates
- 13.3 Turkey
- 13.4 Israel
- 13.5 Iran
- 13.6 Rest of the Middle East
Chapter 14. Africa Rice Cultivation Equipment Market
- 14.1 South Africa
- 14.2 Egypt
- 14.3 Nigeria
- 14.4 Morocco
- 14.5 Rest of Africa
Chapter 15. Rice Cultivation Equipment Company Profiles
- 15.1 [Company 01]
- 15.1.1 Company Overview
- 15.1.2 Key Management Personnel
- 15.1.3 Products & Services Portfolio
- 15.1.4 Financial Performance
- 15.1.5 Key Market Focus & Geographic Presence
- 15.1.6 Recent Developments & Strategic Initiatives
Note: The company profile list is preliminary and may change based on research findings, market developments, data availability, and client requirements.
Chapter 16. Appendices
- Appendix A – List of Abbreviations & Acronyms
- Appendix B – Industry Classification Code Reference – Full Series
- Appendix C – Supply, Output & Operating Capacity Data Tables
- Appendix D – End-Use & Demand Base Tables
- Appendix E – Demand, Adoption & Usage Assumptions
- Appendix F – Pricing & Revenue Metric Reference Tables
- Appendix G – Company Operations & Infrastructure Database
- Appendix H – Cross-Border Trade & Activity Data Tables (Where Applicable)
- Appendix I – Regulatory Summary Tables
- Appendix J – Primary Research Participant List (Anonymized)
- Appendix K – Primary Research Questionnaire Framework
- Appendix L – Data Sources & Bibliography
- Appendix M – Market Size Divergence & Source Comparison
Chapter 17. Research Methodology
- 17.1 Research Framework & Philosophy
- 17.2 Secondary Research – Sources, Hierarchy & Data Extraction
- 17.3 Data Modeling – Bottom-Up & Top-Down Market Sizing
- 17.4 Primary Research – Stakeholder Framework, LOI & Sample Sizes
- 17.5 Forecast Methodology – Regression, Scenario & Sensitivity Analysis
- 17.6 Quality Control – Four-Layer Validation Framework
- 17.7 Limitations & Standard Assumptions
- 17.8 Disclaimer
