
| REPORT ATTRIBUTE | DETAILS |
|---|---|
| Historical Period | 2019-2022 |
| Base Year | 2023 |
| Forecast Period | 2024-2032 |
| Natural Flavors Market Size 2023 | USD 8158.2 Million |
| Natural Flavors Market, CAGR | 5.80% |
| Natural Flavors Market Size 2032 | USD 13550.8 Million |
Market Insights
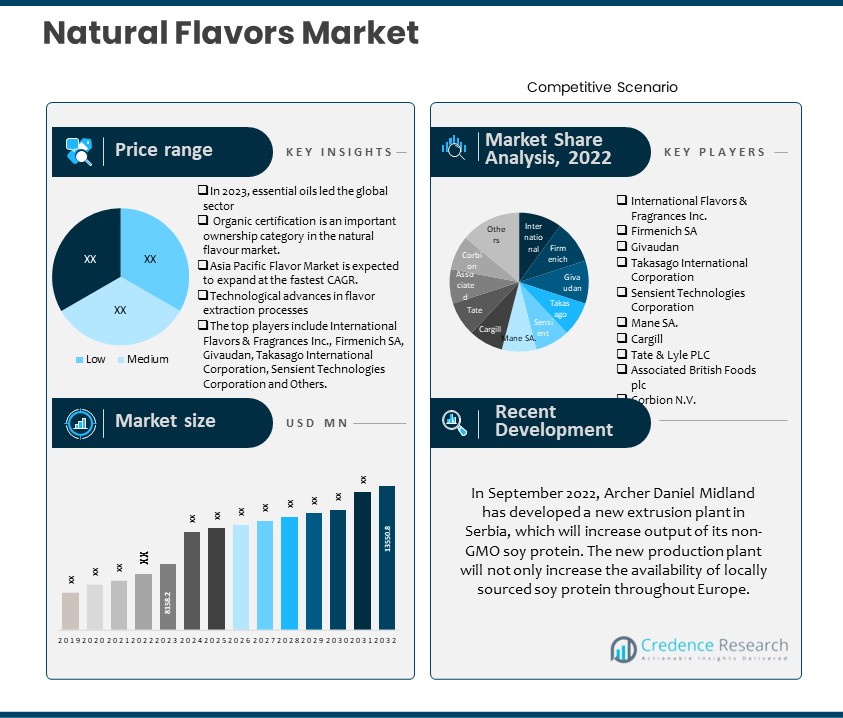
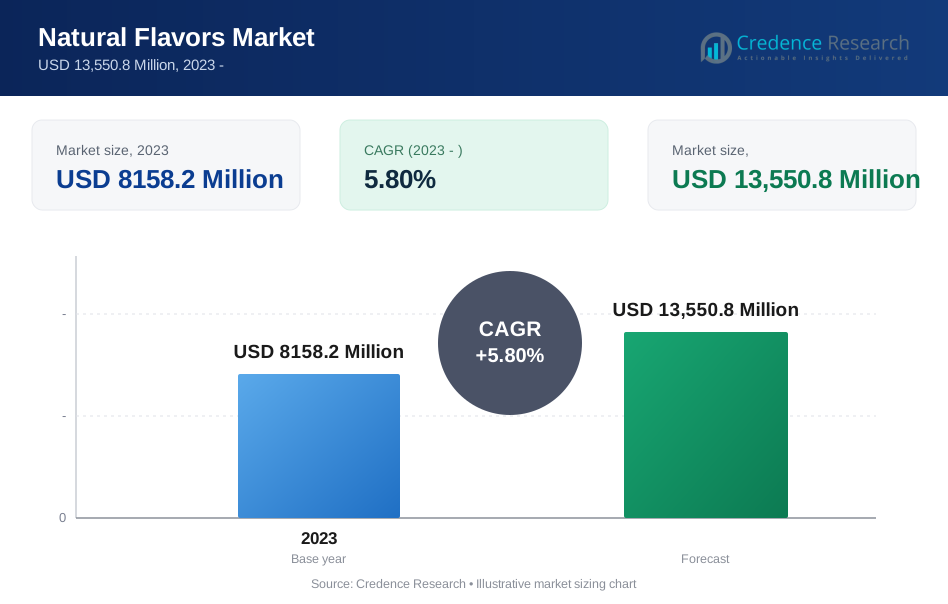
- The global demand for Natural Flavors was valued at USD 8158.2 Million in 2023 and is expected to reach USD 13550.8 Million in 2032, growing at a CAGR of 5.80% between 2024 and 2032.
- Essential oils dominated the global sector in 2023, with Fruit Flavors ranking second in global natural flavor demand.
- In 2023, the extracts and distillates technology category led the global industry, with the Fruit-Based Flavors section predicted to increase at the quickest rate over the forecast period.
- The beverage sector is anticipated to be the fastest-growing category during the forecast period, 2024-2032, while the Bakery & Pastry market is predicted to develop at a consistent rate throughout the projection period.
- Organic Certification is an important ownership category in the natural taste business.
- Europe dominated the market in 2023, accounting for 45.80% of total revenue, while North America Flavor Market retains the second-largest market share. The Asia Pacific Flavor Market is expected to expand at the fastest CAGR.
- Increased demand for natural flavors in dairy products and other beverages propels market expansion.
- Increased usage of artificial flavoring agents impedes market growth
Executive Summary
Market Definition
A natural flavor is an essential oil, oleoresin, protein hydrolysate, distillate, extractive, essence, or any product of roasting, heating, or enzymolysis that contains flavoring elements from a spice, fruit, vegetable, herb, bark, bud, root, leaf, meat, sea food, eggs, poultry, dairy products, and whose purpose is to flavor the food rather than add nutrition to it. Flavorists create natural flavors in a laboratory by combining naturally derived extractives.
Market Overview
The global Natural Flavors Market has witnessed steady growth in recent years and is expected to grow at a CAGR of 5.80% between 2024 and 2032. The market was valued at USD 8158.2 million in 2023 and is expected to reach USD 13550.8 million in 2032.
The key driver driving market revenue growth is the rising demand for natural flavors derived from fresh, natural foods, which help to preserve the flavor and aroma of the original components while also serving as nutritional spices in a variety of culinary goods. Natural flavors are derived from plant and animal sources such as fruit, vegetable, meat, fish, dairy products, herbs, spices, leaves, roots, bark, and buds and are used to generate diverse flavors for processed foods. According to studies, 63% of buyers reject artificial colors, while 71% avoid artificial flavors.
The rising need for natural flavors in the food industrialization process, driven by the need to make products more appealing and closer to the ideal taste while retaining nutritional content, is the primary factor driving revenue growth in the market. Alcohol is used to diminish the natural vanilla taste once it has been extracted from vanilla beans. Anisaldehyde, hydroxybenzoic acid, and hydroxybenzaldehyde are the most essential components responsible for vanilla's natural flavor.
Segmentation By Type of Natural Flavors
- In 2023, essential oils dominated the global industry, accounting for more than 74.65% of total sales. This large proportion is related to the vast range of applications for these items as aromatic and flavoring agents, including cleaning and household, food and beverage, medical, and spa and relaxation, among others.
- In 2023, the Fruit Flavors segment was the second most in demand in the global natural flavor industry, accounting for more than 53.65% of total revenue. Its substantial market share is related to the widespread use of diverse flavors in a variety of end-use industries, particularly in meals and beverages such as confectionery, convenience food, dairy food, and bakery items.
Segmentation By Source and Origin
- In 2023, the Extracts and Distillates technology category led the global industry with a share of more than 42.35%. This large share is attributable to the process's multiple advantages, including lower operating costs, increased extraction yield, shorter extraction time, effective heating, and faster energy transfer. Traditionally, microbes have been routinely utilized to create tastes.
- The Fruit-Based Flavors section is expected to grow at the fastest rate over the forecast period.
Segmentation by Formulation and Application
- The beverages sector dominated the market growth in 2023 and is predicted to be the fastest-growing segment during the forecast period, 2024–2032. The beverage sector is experiencing ongoing transformation as premiumization, functionality, convenience, and sustainability themes gain traction.
- The Bakery and Pastry market is predicted to grow at a steady rate throughout the projection period because to better stability and shelf life, particularly through the use of Plant Extracts with antibacterial properties. When natural flavors are added to baked goods at the levels used, they provide no nutritional benefit.
Segmentation By Certification and Labeling
- Organic Certification is a key ownership segment in the natural flavor market, reflecting consumers' increased desire for organic products. This accreditation guarantees that the flavors are produced from organic sources with no synthetic additives or pesticides.
Segmentation by Region
- Europe dominated the market in 2023, accounting for 45.80% of total revenue.
- North America Flavor Market holds the second-largest market share and The Asia Pacific Flavor Market is predicted to expand at the quickest CAGR
- The rest of the world, including Latin America, the Middle East, and Africa, supplies the remaining demand for Natural Flavors.
The Europe Flavor market accounted for approximately 45.80% and is predicted to develop at a substantial CAGR throughout the study period. Because of its massive population, Europe has the largest culinary flavor market share. The United Kingdom has the second-largest market share due to the ever-increasing demand for organic products. The U.K. market offers three goods, one of which is advertised as organic, leading to the growth of natural food flavors there. Market organizations' primary tactics include new product creation, partnerships, expansions, mergers, and acquisitions.
North America Flavor Market holds the second-largest market share. This is because the region consumes a wide variety of regional cuisines. Because of the region's migrant population, genuine food goods are consumed there, prompting the establishment of several foreign edible services. American consumers like Japanese and Indian food. Furthermore, the U.S. Flavor market had the biggest market share, while Canada's Flavor market was the fastest-growing in the region.
Furthermore, the Asia Pacific Flavor Market is predicted to expand at the quickest CAGR between 2024 and 2032. The Asia Pacific food flavor market is rapidly developing due to the region's high consumption of processed foods and beverages. The region's rising economy includes a large population and working professionals. Population trends are an important macroeconomic variable supporting the growth of the eatable flavoring agents market.
Key Highlights of the Report
Type of Natural Flavors, Source and Origin, Formulation and Application, Source, and Region segments of the global Natural Flavors Market. The Fruit-Based Flavors segment is anticipated to develop at the quickest rate during the forecast period, with the Extracts and Distillates technology category leading the global market in 2023. Additionally, the Bakery & Pastry market is anticipated to expand steadily over the projection period, with the Fruit Flavors segment ranking second in demand within the worldwide natural flavor industry and Europe, leading the market growth.
The market's primary drivers include growing customer demand, the regulatory environment, and sustainability and environmental concerns. In addition, supply chain difficulties, cost constraints, and limited shelf life and stability are the market's primary obstacles. Additionally, the market's significant potential are health and wellness trends, urbanization and changing lifestyles, and globalization and international trade.
The Europe Flavor market accounted for around 45.80% and is expected to grow at a significant CAGR over the study period. Furthermore, North America Flavor Market has the second-largest market share. This is because the region consumes a diverse range of regional cuisines. Furthermore, the Asia Pacific Flavor Market is expected to grow at the fastest CAGR between 2024 and 2032.
What Are The Main Drivers Of The Global Natural Flavors Market?
The market's primary drivers include growing customer demand, the regulatory environment, and sustainability and environmental concerns.
What Are The Major Challenges Faced By The Global Natural Flavors Market?
However, the primary market obstacles include supply chain difficulties, cost constraints, and limited shelf life and stability.
What Are The Growth Opportunities In The Global Natural Flavors Market?
Health and wellness trends, urbanization and changing lifestyles, and globalization and international trade are the market's significant opportunities.
Market Drivers
Several factors drive the global Natural Flavors Market. The following are the key drivers of the global Natural Flavors Market:
Rising Demand For Natural Flavors In Dairy Products And Other Beverages
Teas are frequently scented with plant essential oils such as lemon, bergamot, rose, and fragrant olive, which provide a nice flowery flavor to the tea's natural flavor. Other teas, like rosemary, peppermint, chamomile, and chrysanthemum, are flavored with flower petals, spices, or dried leaves. Tea with flavoring must have the necessary label disclosure. Firms that offer flavored tea must first register with the Tea Board. Tea is the perfect companion to natural flavors. One teaspoon of flavor is required per pound. The transportation agent Ethyl Alcohol takes up a large portion of it, and when it evaporates, the taste is conveyed through the tea by the evaporating alcohol. Both flavor and alcohol are soluble in water, thus they are blended with it. Once the water and alcohol have evaporated, the remaining taste is relatively mild.
Although botanicals are widely used to flavor tea, this does not always imply that the tea contains an exact percentage of any one botanical. For example, pineapple tea may contain pineapple, carrot, strawberry, and other natural tastes.
Market Restraints
The global Natural Flavors Market faces some challenges that may hinder its growth. These include the following:
Increased Use Of Artificial Flavoring Agents
The body typically manages any natural reaction that happens. Artificial flavoring is not natural, as most artificial sweeteners are made from synthetic chemicals. It can cause poisoning and other health issues because our bodies are not designed to handle such toxins. Artificial sweeteners increase body mass index and percentage of body fat. Artificial sweeteners raise the risk of type 2 diabetes. For example, women who consumed more than two artificially sweetened drinks each day had a significantly greater risk of heart disease. Artificial sweeteners may potentially increase the risk of hypertension.
Opportunities
The global Natural Flavors Market offers significant growth opportunities. These include the following:
Rising Global Demand For Food And Beverages
The growing demand for food and beverages is likely to fuel the expansion of the natural flavor industry. Food and beverage refers to goods taken for nourishment and refreshment, encompassing both solid and liquid foods. Natural flavors are employed in the food and beverage sector to suit consumer demand for natural, healthful, and clean-label products. They improve the sensory properties of food and beverages while remaining consistent with industry trends.
According to Common Thread Collective, a US-based advertising services business, the global revenue of the food and beverage industry is expected to increase from $506.3 billion in 2023 to $856.9 billion by 2032. As a result, growing demand for food and beverages is likely to boost the growth of the natural flavors market going forward.
Competitive Landscape
Key Players
The global Natural Flavors Market is highly competitive, with several key players. Some of the major players in the market and their market share are as follows:
- International Flavors & Fragrances Inc.
- Firmenich SA
- Givaudan
- Takasago International Corporation
- Sensient Technologies Corporation
- Mane SA.
- Cargill
- Tate & Lyle PLC
- Associated British Foods plc
- Corbion N.V.
- Sensient Te
These organizations prioritize product innovation, Formulation and Application expansion, and mergers and acquisitions to stay competitive.
The global Natural Flavors Market's key players continually seek to stay ahead by offering new products and developments.
In May 2021, Cargill brought out another probiotic product called EpiCor, which is a dry yeast fermentate that has been scientifically shown in dietary enhancement preliminary studies to assist in balancing the stomach flora and provide safe framework support.
In September 2020, ADM shipped out Arcon finished pea proteins, Prolite MeatTEX finished wheat protein, and Prolite MeatXT non-finished wheat protein. These extremely practical protein combinations would function on the surface and thickness of meat choices and are especially useful for achieving a customer-favored, meat-like surface. It would be easier for the company to overcome the obstacle by producing better-tasting products with more developed surfaces and diversity.
In February 2020, Grupo Arcor and Ingredion Incorporated formed a joint venture to help businesses improve their production skills, regional impressions, and business capacities in order to enhance food and beverage mending contributions to clients in Argentina, Chile, and Uruguay.
Summary of Key Findings
- The rising global demand for food and drinks promotes the expansion of the natural flavors industry.
- The market is segmented by Type of Natural flavors: Source and Origin, Formulation and Application, Source, and region.
- Organic Certification is a critical ownership area in the natural taste business.
- Bakery and Pastry market is expected to rise steadily during the projected period.
- Europe is leading in market growth; the market is highly competitive, with key players including International Flavors & Fragrances Inc., Firmenich SA, Givaudan, Takasago International Corporation, Sensient Technologies Corporation and Others.
Future Outlook
- Increasing customer demand for organic and natural products.
- Growth of the food and beverage industry
- Technological advances in flavor extraction processes.
- Increased awareness of health and wellness
- Transition to plant-based and sustainable components.
How CXOs Can Benefit from the Credence Research Natural Flavors Market Report
The Credence Research Natural Flavors Market Report provides CXOs with a comprehensive overview of the market, including:
- Market size and growth forecast: The report provides detailed estimates of the global Natural Flavors Market size, segmented By Type of Natural Flavors, Source and Origin, Formulation and Application, Certification and Labeling, and region. It also includes forecasts for the market through 2032 based on key trends and drivers.
- Market segmentation: The report segments the Natural Flavors Market By Type of Natural Flavors, Source and Origin, Formulation and Application, Certification and Labeling, and Region. This segmentation provides CXOs with a granular understanding of the market and the opportunities in each segment.
- Competitive Landscape: The report profiles the key players in the Natural Flavors Market and provides insights into their strategies, product offerings, and financial performance. This information can help CXOs to identify and assess their competition.
- Key trends and drivers: The report identifies and analyzes the key trends and drivers shaping the Natural Flavors Market. This information can help CXOs make informed decisions about their investments and strategies.
CXOs can use the insights from the Credence Research Natural Flavors Market Report to:
- Identify growth opportunities: The report can help CXOs identify new growth opportunities in the Natural Flavors Market. By analyzing the data and trends in the report, they can make informed decisions about where to invest and expand their business.
- Make informed investment decisions: The report can help CXOs make informed investment decisions about Natural Flavors. For example, it may provide useful insights into market trends, customer preferences, the competitive landscape, and growth prospects in the mobile accessories business..
- Develop competitive strategies: The report can help CXOs develop competitive strategies for their Natural Flavors businesses. For example, by analyzing market trends, client preferences, and the competitive environment mentioned in the report, CXOs can fine-tune their strategies, differentiate their offers, and effectively position their firms in the marketplace.
- Track market developments: The report can help CXOs monitor market developments and stay ahead of the curve. For example, it provides insights into the latest trends and innovations in the Natural Flavors Market.
Overall, the Credence Research Natural Flavors Market Report is a valuable source for CXOs who are looking to gain a deeper understanding of the market and identify opportunities for growth.
Segmentation
- By Type of Natural Flavors:
- Fruit Flavors
- Vegetable Flavors
- Herb and Spice Flavors
- Botanical Extracts
- Essential Oils
- Natural Sweeteners
- Fermentation-Derived Flavors
- By Source and Origin:
- Fruit-Based Flavors
- Botanical Flavors
- Extracts and Distillates
- Organic and Non-GMO Flavors
- Region-Specific Flavors
- By Formulation and Application:
- Beverages
- Dairy Products
- Confectionery and Snacks
- Bakery and Pastry
- Sauces and Dressings
- Soups and Ready Meals
- Functional Foods and Nutraceuticals
- By Certification and Labeling:
- Organic Certification
- Non-GMO Verification
- Clean Label
- Halal and Kosher Certification
- By Region
- North America
- The U.S.
- Canada
- Mexico
- Europe
- Germany
- France
- The U.K.
- Italy
- Spain
- Rest of Europe
- Asia Pacific
- China
- Japan
- India
- South Korea
- South-east Asia
- Rest of Asia Pacific
- Latin America
- Brazil
- Argentina
- Rest of Latin America
- Middle East & Africa
- GCC Countries
- South Africa
- Rest of the Middle East and Africa
- North America
Request a Free Sample
Fill in your details and we'll send you a free sample report.
- Sample data tables & charts
- Research methodology
Need a Custom Version of This Report?
Tailor the scope, geography, or segments to your exact requirements.
- Custom geography or segment scope
- Direct access to our analyst team
Frequently Asked Questions
What is the current size of the global Natural Flavors Market?
What is the expected growth rate of the Natural Flavors Market between 2024 and 2032?
Which segment is leading the market share in terms of Source and Origin?
Which Type of Natural Flavors segment governs the demand for Natural Flavors in the world?
Who are the major players in the global Natural Flavors Market?
Table of Content
Chapter 1. Report Introduction
- 1.1 Report Description & Purpose
- 1.1.1 Report Title & Market Definition
- 1.1.2 Unique Selling Propositions (USP) & Key Differentiators
- 1.1.3 Value Proposition for Stakeholders
- 1.2 Research Objectives
- 1.2.1 Market Sizing Objectives (Volume & Revenue)
- 1.2.2 Segmentation Objectives
- 1.2.3 Competitive Intelligence Objectives
- 1.2.4 Forecast & Scenario Objectives
- 1.3 Report Scope
- 1.3.1 Natural Flavors Scope – Types & Subtypes Covered
- 1.3.2 Geographic Scope – Regions & Countries Covered
- 1.3.3 Historical Period, Base Year & Forecast Period (2023; forecast to the forecast period)
- 1.3.4 Inclusions & Exclusions
- 1.4 HS Code & Classification Framework
- 1.5 Currency, Units & Pricing Basis
- 1.6 Target Stakeholders
- 1.7 Limitations & Assumptions
Chapter 2. Executive Summary
- 2.1 Global Natural Flavors Market Snapshot
- 2.1.1 Market Size – Historical (2023) & Forecast (the forecast period) (2023: USD 8158.2 Million → forecast year: USD 13,550.8 Million)
- 2.1.2 Volume & Revenue – Global Totals
- 2.1.3 Key Market Highlights – Top Five Facts
- 2.2 Natural Flavors Market Segmentation Snapshot
- 2.2.1 Market Split by Region – 2023 vs.
- 2.3 Competitive Snapshot
- 2.3.1 Top 10 Players by Revenue Share – 2023
- 2.3.2 Top 10 Players by Volume Share – 2023
- 2.3.3 Recent Strategic Developments (18-Month Summary)
- 2.4 Key Investment Highlights & Strategic Conclusions
Chapter 3. Natural Flavors Market Dynamics & Industry Analysis
- 3.1 Market Overview & Context
- 3.1.1 Natural Flavors Market Position in the Broader Automotive Value Chain
- 3.1.2 OEM vs. Replacement Market Dynamics
- 3.1.3 Market Maturity & Development Stage by Region
- 3.2 Natural Flavors Market Drivers
- 3.3 Natural Flavors Market Restraints & Challenges
- 3.4 Natural Flavors Market Opportunities
- 3.5 Porter's Five Forces Analysis
- 3.5.1 Threat of New Entrants
- 3.5.2 Bargaining Power of Suppliers
- 3.5.3 Bargaining Power of Buyers
- 3.5.4 Threat of Substitutes
- 3.5.5 Competitive Rivalry – Intensity Assessment
- 3.6 Natural Flavors Value Chain Analysis
- 3.6.1 Upstream – Raw Material/Input Suppliers
- 3.6.1.1 Raw Material/Input 1
- 3.6.1.2 Raw Material/Input 2
- 3.6.1.3 Raw Material/Input 3
- 3.6.2 Midstream – Production/Manufacturing/Service Delivery
- 3.6.2.1 Production/Process Overview
- 3.6.2.2 Key Facility Locations & Capacity by Manufacturer
- 3.6.3 Downstream – Distribution & End Consumer
- 3.6.3.1 Primary Channel – B2B/OEM
- 3.6.3.2 Secondary Channels – Dealer, Retail, Online, Direct
- 3.6.4 Value Chain Profitability Analysis
- 3.6.1 Upstream – Raw Material/Input Suppliers
- 3.7 PESTEL Analysis
- 3.7.1 Political Factors
- 3.7.2 Economic Factors
- 3.7.3 Social Factors
- 3.7.4 Technological Factors
- 3.7.5 Environmental Factors
- 3.7.6 Legal Factors
- 3.8 Natural Flavors Supply Chain Analysis
- 3.8.1 Raw Material/Input Supply Risk Assessment
- 3.8.2 Manufacturing Concentration Risk (Geographic Exposure)
- 3.8.3 Trade Disruption Impact Analysis
- 3.9 Regulatory & Policy Landscape
Note: The regulatory and policy landscape section covers regulations based on their applicability to the market, Natural Flavors category, geography, and scope of the study. Only regulatory frameworks with a material impact on operations, compliance, trade, sustainability, or market access are analyzed in detail.
Chapter 4. Key Investment Pockets & Opportunity Analysis
- 4.1 Natural Flavors Market Attractiveness Analysis
- 4.1.1 By Region – Investment Attractiveness Matrix (Volume × CAGR)
- 4.2 Absolute Revenue Growth Opportunity
- 4.2.1 By Region – Absolute USD Growth Through the forecast period
- 4.3 Incremental Volume Opportunity
- 4.3.1 By Region – Incremental Volume Through the forecast period
- 4.3.2 Segment – Incremental Volume
- 4.4 Emerging Submarket Opportunity Deep Dive (Subject to Applicability)
- 4.5 Emerging Market Opportunity Scorecards
- 4.5.1 United States
- 4.5.2 Europe
- 4.5.3 Asia
- 4.5.4 Middle East & Africa
Note: Emerging Market Opportunity Scorecards will be included based on relevance and strategic importance. Regions listed are indicative and may vary depending on data availability and market dynamics.
Chapter 5. Natural Flavors Import-Export Analysis & Trade Flows
- 5.1 Global Trade Overview
- 5.1.1 Global Export Value by Country (2023)
- 5.1.2 Global Export Volume by Country (2023)
- 5.1.3 Global Import Value by Country (2023)
- 5.1.4 Global Import Volume by Country (2023)
- 5.1.5 Net Trade Balance by Country (2023)
- 5.2 Export Analysis – Segment
- 5.2.1 Type 1 (HS Code)
- 5.2.2 Type 2 (HS Code)
- 5.2.3 Type 3 (HS Code)
- 5.2.4 Type 4 (HS Code)
- 5.2.5 Type 5 (HS Code)
- 5.3 Import Analysis – Segment
- 5.3.1 Type 1 (HS Code)
- 5.3.2 Type 2 (HS Code)
- 5.3.3 Type 3 (HS Code)
- 5.3.4 Type 4 (HS Code)
- 5.3.5 Type 5 (HS Code)
- 5.4 Average Unit Trade Prices
- 5.4.1 Average Export Price – Segment & Country
- 5.4.2 Average Import Price – Segment & Source Country
- 5.4.3 Price Trends (2023)
- 5.5 Key Trade Route Analysis
- 5.5.1 Trade Route 1
- 5.5.2 Trade Route 2
- 5.5.3 Trade Route 3
- 5.5.4 Trade Route 4
- 5.5.5 Trade Route 5
- 5.6 Trade Policy Impact Assessment
- 5.6.1 US Anti-Dumping & Section 301 Tariffs
- 5.6.2 EU Customs Union Impact
- 5.6.3 Major Free Trade Agreements
- 5.6.4 USMCA Rules of Origin
Note: Trade policy analysis will be included only where relevant to the Natural Flavors market.
Chapter 6. Competitive Landscape & Company Benchmarking
- 6.1 Natural Flavors Market Concentration & Structure
- 6.1.1 Herfindahl-Hirschman Index (HHI) – vs. 2023
- 6.1.2 Tier 1, Tier 2 & Tier 3 Market Structure
- 6.1.3 Global, Regional & Local Player Dynamics
- 6.2 Natural Flavors Market Share Analysis – 2023
- 6.2.1 Global Revenue Share by Company
- 6.2.2 Global Volume Share by Company
- 6.2.3 Regional Revenue Share
- 6.2.4 Market Share Evolution ( vs. 2023)
- 6.2.5 OEM Segment Share by Company
- 6.2.6 Replacement Segment Share by Company
- 6.3 Production/Delivery Capacity & Facility Analysis
- 6.3.1 Global Installed Capacity
- 6.3.2 Capacity Utilization Rates
- 6.3.3 Production/Output Volume
- 6.3.4 Facility Locations & Capacity Map
- 6.3.5 Planned Capacity Additions
- 6.4 Natural Flavors Competitive Benchmarking Matrix
- 6.4.1 Revenue, Volume, CAGR & Profitability Comparison
- 6.4.2 Channel Revenue Mix
- 6.4.3 Geographic Revenue Exposure
- 6.4.4 R&D Intensity
- 6.4.5 Sustainability Maturity
- 6.5 Strategic Developments in Natural Flavors (Last 24 Months)
- 6.5.1 Mergers, Acquisitions & Divestments
- 6.5.2 New Natural Flavors Launches
- 6.5.3 Facility Expansions
- 6.5.4 Strategic Alliances, Joint Ventures & Partnerships
- 6.5.5 Distribution Expansion & Market Entry
- 6.5.6 Sustainability & ESG Initiatives
- 6.6 Competitive Strategy Mapping
- 6.6.1 Leader, Challenger, Follower & Niche Classification
- 6.6.2 Pricing Strategy Comparison
- 6.6.3 Channel Strategy Matrix
Note: Strategic developments are included based on their materiality and the availability of reliable information.
Chapter 7. Global Natural Flavors Market – By Distribution Channel
- 7.1 Segment Overview
- 7.1.1 Volume & Revenue Split by Channel (2023 & )
- 7.1.2 Channel Mix Evolution (the forecast period)
Chapter 8. Regional Market Analysis – Global Overview
- 8.1 Global Regional Overview
- 8.1.1 Regional Volume Share
- 8.1.2 Regional Revenue Share
- 8.1.3 Regional Volume by Region
- 8.1.4 Regional Revenue by Region
- 8.1.5 Regional Forecast Through the forecast period
- 8.2 Cross-Regional Segment Analysis
- 8.2.1 By Distribution Channel
- 8.2.2 By Brand/Price Tier
Chapter 9. North America Natural Flavors Market
- 9.1 United States
- 9.2 Canada
- 9.3 Mexico
Chapter 10. Europe Natural Flavors Market
- 10.1 Germany
- 10.2 France
- 10.3 Italy
- 10.4 United Kingdom
- 10.5 Spain
- 10.6 Poland
- 10.7 Russia
- 10.8 Netherlands
- 10.9 Belgium
- 10.10 Sweden
- 10.11 Denmark
- 10.12 Norway
- 10.13 Rest of Europe
Chapter 11. Asia Pacific Natural Flavors Market
- 11.1 China
- 11.2 India
- 11.3 Japan
- 11.4 South Korea
- 11.5 Thailand
- 11.6 Indonesia
- 11.7 Vietnam
- 11.8 Malaysia
- 11.9 Australia
- 11.10 Rest of Asia Pacific
Chapter 12. Latin America Natural Flavors Market
- 12.1 Brazil
- 12.2 Argentina
- 12.3 Colombia
- 12.4 Chile
- 12.5 Rest of Latin America
Chapter 13. Middle East Natural Flavors Market
- 13.1 Saudi Arabia
- 13.2 United Arab Emirates
- 13.3 Turkey
- 13.4 Israel
- 13.5 Iran
- 13.6 Rest of the Middle East
Chapter 14. Africa Natural Flavors Market
- 14.1 South Africa
- 14.2 Egypt
- 14.3 Nigeria
- 14.4 Morocco
- 14.5 Rest of Africa
Chapter 15. Natural Flavors Company Profiles
- 15.1 [Company 01]
- 15.1.1 Company Overview
- 15.1.2 Key Management Personnel
- 15.1.3 Products & Services Portfolio
- 15.1.4 Financial Performance
- 15.1.5 Key Market Focus & Geographic Presence
- 15.1.6 Recent Developments & Strategic Initiatives
Note: The company profile list is preliminary and may change based on research findings, market developments, data availability, and client requirements.
Chapter 16. Appendices
- Appendix A – List of Abbreviations & Acronyms
- Appendix B – Industry Classification Code Reference – Full Series
- Appendix C – Production & Capacity Data Tables
- Appendix D – End-Use & Demand Base Tables
- Appendix E – Consumption & Replacement Rate Assumptions
- Appendix F – ASP Reference Tables
- Appendix G – Manufacturing & Facility Database
- Appendix H – Import-Export Data Tables
- Appendix I – Regulatory Summary Tables
- Appendix J – Primary Research Participant List (Anonymized)
- Appendix K – Primary Research Questionnaire Framework
- Appendix L – Data Sources & Bibliography
- Appendix M – Market Size Divergence & Source Comparison
Chapter 17. Research Methodology
- 17.1 Research Framework & Philosophy
- 17.2 Secondary Research – Sources, Hierarchy & Data Extraction
- 17.3 Data Modeling – Bottom-Up & Top-Down Market Sizing
- 17.4 Primary Research – Stakeholder Framework, LOI & Sample Sizes
- 17.5 Forecast Methodology – Regression, Scenario & Sensitivity Analysis
- 17.6 Quality Control – Four-Layer Validation Framework
- 17.7 Limitations & Standard Assumptions
- 17.8 Disclaimer
