Market Overview
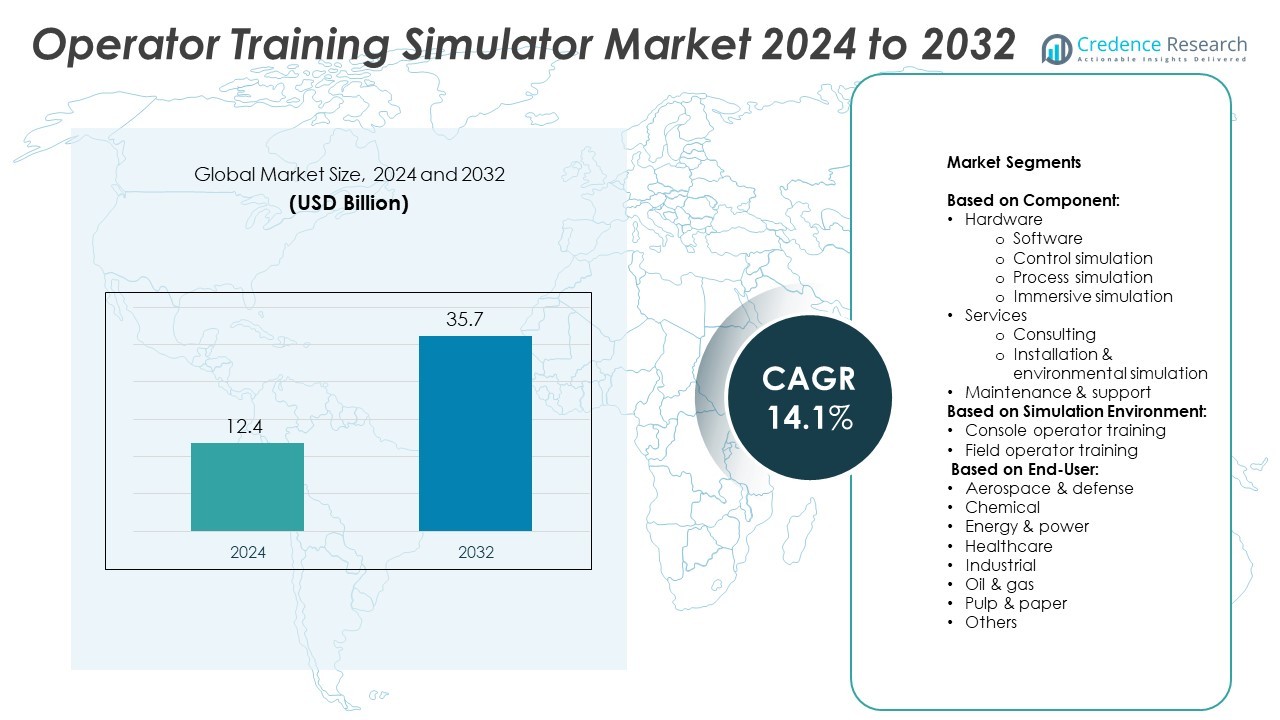
Operator Training Simulator Market size was valued at USD 12.4 billion in 2024 and is anticipated to reach USD 35.7 billion by 2032, at a CAGR of 14.1% during the forecast period.
| REPORT ATTRIBUTE |
DETAILS |
| Historical Period |
2020-2024 |
| Base Year |
2024 |
| Forecast Period |
2025-2032 |
| Operator Training Simulator Market Size 2024 |
USD 12.4 Billion |
| Operator Training Simulator Market, CAGR |
14.1% |
| Operator Training Simulator Market Size 2032 |
USD 35.7 Billion |
The Operator Training Simulator market grows due to rising demand for skilled operators, operational safety, and digital training tools. Industries adopt simulators to reduce human error, improve response time, and meet compliance standards. Trends include the integration of VR, AI-driven personalized training paths, and cloud-based platforms for remote access. Increasing investment in industrial automation and workforce modernization further supports adoption. These factors collectively drive the expansion of simulator use across sectors like energy, defense, oil & gas, and manufacturing.
North America leads the Operator Training Simulator market, followed by Europe and Asia Pacific, driven by strong industrial presence, advanced infrastructure, and focus on workforce safety. Asia Pacific shows rapid growth due to expanding energy and manufacturing sectors. Latin America and the Middle East & Africa show steady adoption with infrastructure development and digital training initiatives. Key players shaping the global market include Schneider Electric SE, Siemens AG, ABB Group, and Aveva Group PLC, each offering advanced simulation solutions across industries.
Access crucial information at unmatched prices!
Request your sample report today & start making informed decisions powered by Credence Research Inc.!
Download Sample
Market Insights
- The Operator Training Simulator market was valued at USD 12.4 billion in 2024 and is projected to reach USD 35.7 billion by 2032, growing at a CAGR of 14.1%.
- Rising demand for workforce safety, risk-free training, and operational efficiency drives market growth across key industries.
- Adoption of immersive technologies like virtual reality and AI-driven personalization enhances the effectiveness of simulator training programs.
- Key players such as Schneider Electric SE, Siemens AG, ABB Group, and Aveva Group PLC lead through innovation and strategic partnerships.
- High initial investment costs and lack of internal technical expertise limit adoption, especially among small and mid-sized enterprises.
- North America holds the leading position, followed by Europe, while Asia Pacific shows the fastest growth due to industrial expansion.
- Cloud-based deployment, digital twin integration, and remote training platforms will shape the future landscape of the simulator market.
Market Drivers
Rising Need for Skilled Workforce and Risk-Free Training Environments
The Operator Training Simulator market grows due to the global shortage of skilled technical operators. Industries aim to reduce human error and operational risks through structured simulation-based training. These platforms replicate real-world operations, helping operators practice without affecting live systems. It supports knowledge retention and ensures operators respond effectively in critical scenarios. Sectors like oil & gas, chemicals, and nuclear require rigorous safety training. The Operator Training Simulator market fulfills these demands by offering controlled and repeatable training environments.
- For instance, Thai refinery purchased Yokogawa s OmegaLand OTS to ensure a smooth transition and flawless startup when migrating to the CENTUM CS 3000 DCS. Another discusses the use of an OTS at a PetroVietnam plant, mentioning training 66 operators following implementation.
Expansion of Automation and Complex Industrial Systems
The rapid adoption of automation and digital control systems in industries increases the complexity of operations. Operators must be proficient with integrated platforms and advanced technologies. Simulators allow employees to adapt to automation without compromising productivity or safety. It helps industries ensure system uptime and prevent costly downtimes. The Operator Training Simulator market supports this trend by offering real-time control emulation and system-specific modules. Advanced simulators reflect real plant conditions and enhance technical competence.
- For instance, The original simulator for Consolidated Edison’s Indian Point 2 nuclear plant was manufactured by Singer-Link Simulation.
Strict Regulatory Compliance and Industry Safety Standards
Governments and industry bodies enforce stringent training standards to ensure operational safety and compliance. Industries must certify operator readiness before allowing access to high-risk machinery or systems. Simulators provide measurable performance evaluations and ensure compliance with safety norms. It offers audit trails and structured training logs for accountability. The Operator Training Simulator market aligns with these regulatory needs, offering training validation and periodic assessments. This driver is critical in sectors such as energy, aviation, and pharmaceuticals.
Growing Adoption in Emerging Economies and Infrastructure Projects
Infrastructure growth in emerging economies drives the demand for trained manpower across sectors. New facilities in power, refining, and manufacturing require efficient operator onboarding. Simulators help bridge the skill gap in regions with limited access to traditional training setups. It enables faster deployment and lowers training costs. The Operator Training Simulator market benefits from government-led industrialization efforts and public-private partnerships. Countries in Asia Pacific, Middle East, and Latin America show rising simulator adoption.
Market Trends
Integration of Virtual Reality (VR) and Augmented Reality (AR) in Simulator Platforms
Virtual reality and augmented reality technologies are transforming the user experience of training systems. Immersive interfaces improve retention and engagement among operators. These tools provide realistic 3D environments that replicate actual operational settings. It enables better situational awareness and rapid decision-making skills. The Operator Training Simulator market incorporates AR and VR modules to support complex and hazardous task simulations. This trend is gaining traction in aviation, defense, and oil & gas sectors.
- For instance, Tata Power has announced a much larger number, stating that its Skill Development Institute has trained over 3.5 lakh (350,000) individuals since its inception in 2015. The total number of trained individuals has long surpassed 150,000, and as of September 2023, the figure stood at over 275,000.
Shift Toward Cloud-Based and Remote Training Solutions
Organizations adopt cloud-enabled simulators to support remote workforce training. This shift enables centralized access to training modules across multiple sites. It allows flexible learning schedules and faster updates of simulation scenarios. Industries prefer these platforms for their scalability and lower infrastructure cost. The Operator Training Simulator market aligns with this trend by offering browser-accessible training environments. This supports training continuity in global and decentralized operations.
- For instance, Siemens uses VR simulation to support operator immersion in complex turbine environments, leveraging digital twins for remote training and enhanced safety. The company has implemented these technologies at various training locations globally, including projects in Europe and the U.S.
Use of AI and Machine Learning for Adaptive Learning Paths
Simulation systems now integrate artificial intelligence to enhance user performance analytics. These platforms customize training paths based on individual operator performance. AI tracks errors, response time, and decision logic to deliver feedback. It ensures targeted skill development rather than generic training modules. The Operator Training Simulator market evolves with such intelligence-driven personalization to improve learning outcomes. This supports continuous improvement in safety and operational readiness.
Growing Focus on Industry-Specific Simulation Modules
Demand increases for training systems tailored to specific industrial applications. Companies request customized simulation environments that mirror their unique equipment and process workflows. It enhances training relevance and efficiency for employees. Vendors now collaborate with industry clients to create plant-specific digital twins. The Operator Training Simulator market adopts this trend to deliver sector-focused solutions in areas like power generation, chemicals, and marine. This approach increases training accuracy and user confidence.
Market Challenges Analysis
High Initial Investment and Long Implementation Cycle
Operator Training Simulator systems require significant upfront capital for hardware, software, and customization. Small and mid-sized enterprises hesitate to adopt due to high procurement and integration costs. Customizing simulators to match real-world systems involves complex engineering and time-consuming calibration. It delays deployment and affects return on investment in early stages. The Operator Training Simulator market faces adoption barriers in cost-sensitive sectors. Companies with limited budgets often rely on conventional training methods instead.
Lack of Skilled Personnel to Operate and Maintain Simulator Systems
Running advanced simulators demands personnel with knowledge in control systems, modeling, and software management. Many industries struggle to recruit or retain professionals with these cross-functional skills. Without proper support, simulators lose effectiveness and may not reflect current operational setups. It creates a gap between training content and real-time field requirements. The Operator Training Simulator market addresses this issue through vendor-led support services and training programs. However, lack of internal expertise still limits long-term sustainability.
Market Opportunities
Rising Demand Across Emerging Industries and Infrastructure Expansion
New infrastructure and industrial facilities in developing economies create strong demand for trained operators. Sectors like renewable energy, waste management, and smart manufacturing require simulation-based training tools. Governments and private players invest in modernizing workforce skills to support complex systems. It positions simulation platforms as critical tools in onboarding and upskilling programs. The Operator Training Simulator market finds new growth avenues in regions undergoing rapid industrialization. Expanding digital infrastructure further supports deployment in remote and multi-site operations.
Growing Interest in Sustainable and Safety-Focused Training Models
Industries aim to lower emissions and reduce risks associated with live-equipment training. Simulators offer a safe, repeatable, and energy-efficient alternative for skill development. Companies use these tools to meet sustainability goals and promote workplace safety culture. Simulation also helps reduce resource waste and improve long-term process efficiency. It enhances operator confidence while minimizing downtime and accidents. The Operator Training Simulator market gains momentum from this shift toward environmentally responsible training practices.
Market Segmentation Analysis:
By Component:
It includes hardware, services, and maintenance & support. Hardware dominates with advanced simulation modules such as software, control simulation, process simulation, and immersive simulation. Immersive simulation gains strong interest for its ability to replicate high-risk environments using VR tools. Control and process simulations help operators navigate system functions and failure scenarios. Services segment includes consulting, installation, and environmental simulation, which support customization and deployment. Maintenance & support ensures system reliability and continuous upgrades, helping users retain long-term training value.
- For instance, AVEVA launched cloud-based operator training for clients globally, enabling remote access to digital twins via browser interfaces. Trainees can access the courses and simulators remotely, 24/7, from any location.
By Simulation Environment:
The market splits into console operator training and field operator training. Console operator training covers control room-based systems and is widely used in energy, oil & gas, and process industries. It offers scenarios for equipment monitoring and emergency control. Field operator training focuses on real-world tasks, safety drills, and equipment handling in outdoor settings. It supports hands-on readiness and response accuracy. This segment gains traction with industries that manage hazardous field operations.
- For instance, CAE’s press releases confirm numerous defense contracts, including a 25-year contract with the Royal Canadian Air Force and work for NATO aircrew in Germany.
By End-User:
The Operator Training Simulator market serves aerospace & defense, chemical, energy & power, healthcare, industrial, oil & gas, pulp & paper, and others. Aerospace & defense prioritize simulation to prepare teams for complex machinery and mission-critical tasks. Oil & gas and energy & power sectors use simulators to ensure system integrity and avoid operational risks. Chemical and industrial sectors invest to reduce process failures and enhance efficiency. Healthcare adopts simulation to train medical professionals in surgical procedures and emergency responses. Pulp & paper and other industries implement simulators to minimize machine downtime and improve workforce safety.
Segments:
Based on Component:
- Hardware
- Software
- Control simulation
- Process simulation
- Immersive simulation
- Services
- Consulting
- Installation & environmental simulation
- Maintenance & support
Based on Simulation Environment:
- Console operator training
- Field operator training
Based on End-User:
- Aerospace & defense
- Chemical
- Energy & power
- Healthcare
- Industrial
- Oil & gas
- Pulp & paper
- Others
Based on the Geography:
- North America
- Europe
- UK
- France
- Germany
- Italy
- Spain
- Russia
- Belgium
- Netherlands
- Austria
- Sweden
- Poland
- Denmark
- Switzerland
- Rest of Europe
- Asia Pacific
- China
- Japan
- South Korea
- India
- Australia
- Thailand
- Indonesia
- Vietnam
- Malaysia
- Philippines
- Taiwan
- Rest of Asia Pacific
- Latin America
- Brazil
- Argentina
- Peru
- Chile
- Colombia
- Rest of Latin America
- Middle East
- UAE
- KSA
- Israel
- Turkey
- Iran
- Rest of Middle East
- Africa
- Egypt
- Nigeria
- Algeria
- Morocco
- Rest of Africa
Regional Analysis
North America
North America holds the largest share in the Operator Training Simulator market, accounting for 33.4% in 2024. The United States leads regional demand due to its strong presence in the oil & gas, defense, and nuclear power sectors. Companies prioritize simulation-based training to meet stringent operational and safety standards. The region also supports advanced R&D activities and early adoption of immersive simulation tools. Defense programs, such as pilot and mission training systems, fuel market growth. Investment in smart grid infrastructure and industrial automation strengthens simulator deployment. Canada contributes through energy projects and growing interest in virtual training environments across manufacturing.
Europe
Europe follows with a market share of 26.7%, supported by well-established aerospace, power, and chemical industries. Countries like Germany, the United Kingdom, and France drive simulator usage through strong safety mandates and workforce development programs. EU-funded digitalization and industrial innovation projects increase adoption of VR-based operator training systems. Nuclear and renewable energy projects in France and Germany boost simulator installations for control room training. Process industries in Scandinavia adopt simulators to manage operational efficiency. The region also emphasizes eco-friendly and cost-effective workforce training, aligning with long-term skill development goals.
Asia Pacific
Asia Pacific commands a growing market share of 21.3%, driven by industrial expansion and infrastructure development. China, India, Japan, and South Korea lead demand due to large-scale energy, manufacturing, and transportation projects. Governments and private sectors invest in simulator technologies to address rising demand for skilled operators. The region experiences a strong shift toward digital learning and simulation in technical education institutions. It supports safety training in sectors such as mining, power, and oil refining. Operator training solutions also support the growing number of smart factories and digital control systems across Southeast Asia.
Latin America
Latin America holds a modest share of 10.2%, with Brazil and Mexico driving demand. Oil refining, industrial chemicals, and energy projects in the region rely on simulators to train new operators and reduce equipment failure risks. Multinational companies establish local training centers using simulation platforms to align with global standards. Public investments in infrastructure and power generation improve simulator deployment. The availability of mobile and cloud-based simulators supports remote training in areas with limited access to physical setups. Training initiatives in mining and pulp & paper sectors continue to support market expansion.
Middle East & Africa
Middle East & Africa represent 8.4% of the global market share, led by oil-rich countries like Saudi Arabia and the UAE. Regional companies adopt simulators to enhance operator readiness in oil, gas, and petrochemical industries. High-risk operations and remote locations drive the need for safe and effective training methods. African countries show emerging interest in simulation for power plants and industrial facilities. Government partnerships with global vendors support regional training modernization. Growth remains steady with expansion of large-scale energy infrastructure and industrial operations.
Shape Your Report to Specific Countries or Regions & Enjoy 30% Off!
Key Player Analysis
- Aveva Group PLC
- Tecnatom
- FLSmidth
- Schneider Electric SE
- Applied Research Associate, Inc.
- Yokogawa Electric Corporation
- AspenTech
- Andritz Automation
- ABB Group
- Siemens AG
Competitive Analysis
The Operator Training Simulator market features strong competition among established global players, including Schneider Electric SE, Andritz Automation, Aveva Group PLC, FLSmidth, AspenTech, Applied Research Associate, Inc., Tecnatom, Siemens AG, ABB Group, and Yokogawa Electric Corporation. These companies focus on technological innovation, strategic collaborations, and industry-specific solutions to expand market presence. They offer tailored training platforms with high-fidelity simulations that replicate real-world operations in sectors such as oil & gas, power, chemicals, and defense. Vendors compete by enhancing user interfaces, integrating AI and VR technologies, and supporting cloud-based deployment for remote training. Some providers invest in strategic acquisitions to broaden their service portfolios and enter emerging markets. Others strengthen partnerships with OEMs, universities, and government agencies to increase product visibility and support workforce development initiatives. Companies also differentiate through scalable platforms, multilingual support, and performance analytics tools that deliver measurable training outcomes. Continuous system upgrades and robust customer support help retain large industrial clients. These competitive strategies ensure strong market positioning and long-term growth in high-demand industries.
Recent Developments
- In April 2025, Loft Dynamics entered fixed‑wing VR simulation, starting with a co‑development initiative alongside Alaska Airlines to build the world’s first Boeing 737 VR simulators
- In September 2024, AAT announced its training centers could support African operators using Airbus A320, ATR600, or Boeing B737 NG training infrastructure
- In February 2024, Honeywell introduced augmented reality into its immersive field simulator to deliver targeted, on-demand training for industrial workers
Report Coverage
The research report offers an in-depth analysis based on Component, Simulation Environment, End-User and Geography. It details leading market players, providing an overview of their business, product offerings, investments, revenue streams, and key applications. Additionally, the report includes insights into the competitive environment, SWOT analysis, current market trends, as well as the primary drivers and constraints. Furthermore, it discusses various factors that have driven market expansion in recent years. The report also explores market dynamics, regulatory scenarios, and technological advancements that are shaping the industry. It assesses the impact of external factors and global economic changes on market growth. Lastly, it provides strategic recommendations for new entrants and established companies to navigate the complexities of the market.
Future Outlook
- Industry players will expand adoption of immersive technologies like VR and AR to enhance realism.
- Cloud-based simulation platforms will support remote and multi-site operator training.
- Artificial intelligence will tailor training modules to individual operator performance.
- Providers will deliver digital twins of real assets for precise and scenario-driven training.
- Integration with smart factory systems will enable seamless control room and field simulation.
- Vendors will partner with academic institutions to embed simulator-based learning in curricula.
- Modular and scalable platforms will allow cost-effective deployment across company divisions.
- Focus on sustainability will drive simulator use to reduce training-related emissions and waste.
- Training ecosystems will include predictive maintenance components based on operational data.
- Widened deployment across sectors such as healthcare, renewable energy, and mining will fuel growth.


