
Self-Service Technologies Market Overview:
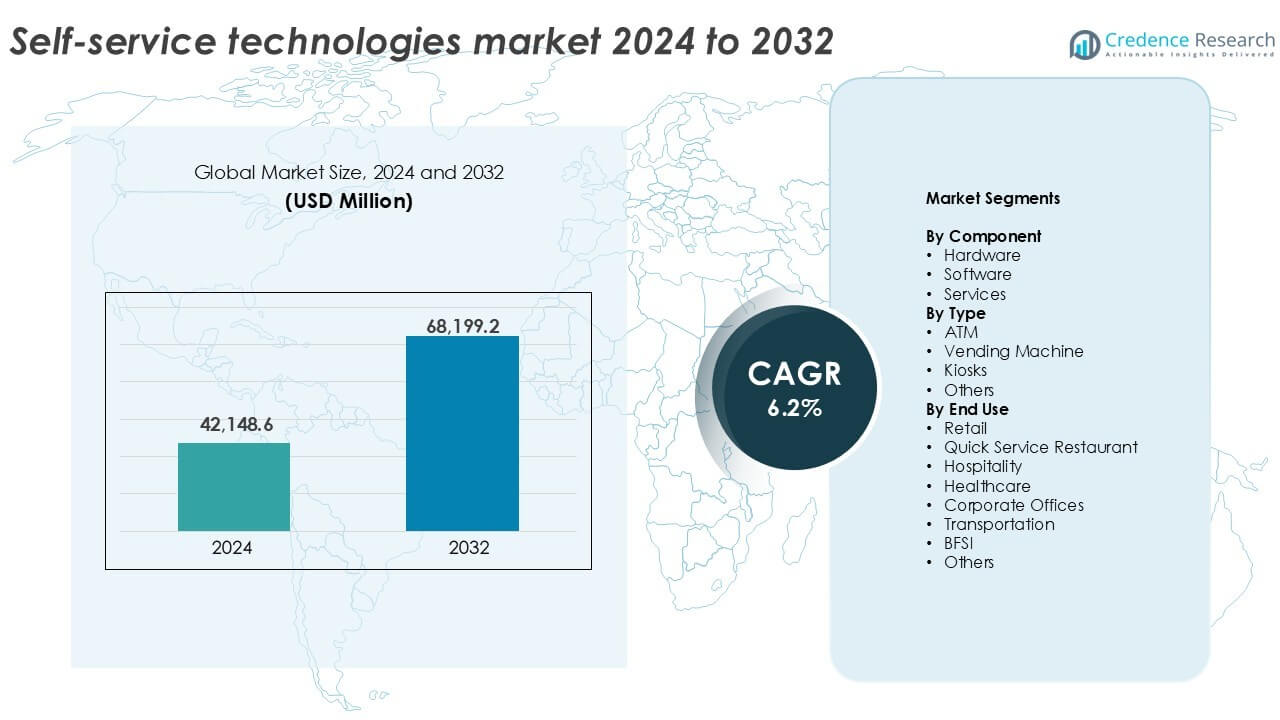
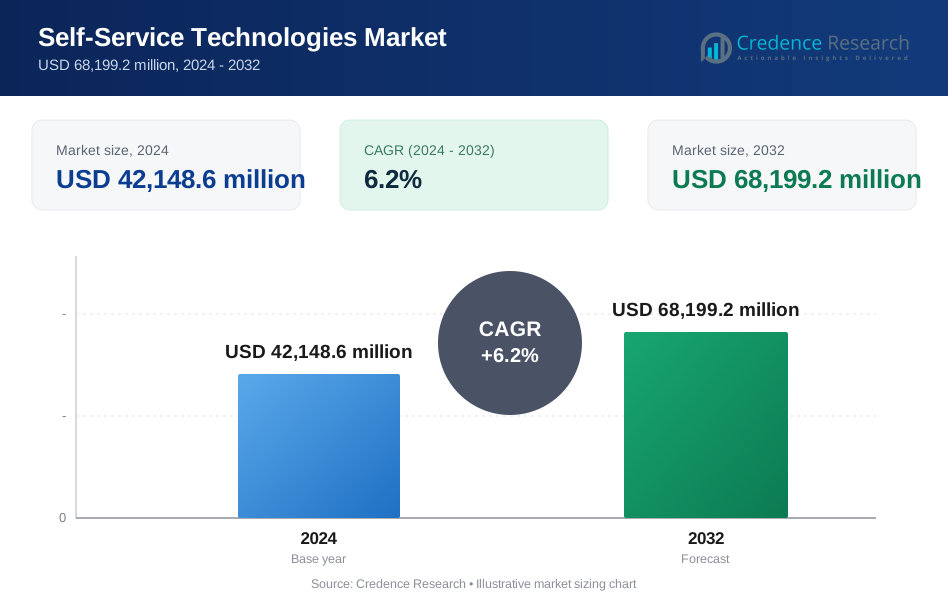
The self-service technologies market size was valued at USD 42,148.6 million in 2024 and is anticipated to reach USD 68,199.2 million by 2032, at a CAGR of 6.2% during the forecast period.
| REPORT ATTRIBUTE | DETAILS |
|---|---|
| Historical Period | 2020-2023 |
| Base Year | 2024 |
| Forecast Period | 2025-2032 |
| Self-Service Technologies Market Size 2024 | USD 42,148.6 million |
| Self-Service Technologies Market, CAGR | 6.2% |
| Self-Service Technologies Market Size 2032 | USD 68,199.2 million |
Self-Service Technologies Market Insights
- Rising demand for contactless services across retail, BFSI, and healthcare sectors drives rapid technology adoption.
- Trends such as AI-enabled kiosks, biometric ATMs, and smart vending machines enhance user experience and support real-time data integration.
- NCR Corporation, Diebold Nixdorf, Ingenico Group, and KIOSK Information Systems lead the market with diverse portfolios and strong global presence.
- North America holds the highest regional share at 35%, followed by Europe at 27% and Asia Pacific at 22%. Hardware remains the dominant component with over 55% share, while ATMs lead the type segment with more than 40% share.
Self-Service Technologies Market Segmentation Analysis:
By Component
Hardware dominates the self-service technologies market by component, accounting for over 55% of the market share in 2024. Strong demand for interactive kiosks, ATMs, and vending systems drives hardware sales across sectors. Organizations continue to invest in durable and scalable machines to ensure 24/7 service access. The shift toward touchless interfaces, biometric authentication, and smart dispensing units reinforces hardware upgrades. Hardware demand also rises with deployments in transportation hubs and retail chains. Continuous innovation in physical interfaces ensures user convenience, security, and operational efficiency, making hardware the most preferred component across deployments.
- For instance, Diebold Nixdorf supplies ATM hardware, such as the DN Series, with the capability to integrate biometric solutions, including fingerprint scanners, as optional modules for banks to deploy based on their needs.
By Type
ATMs represent the largest type segment in the self-service technologies market, capturing more than 40% share in 2024. Their wide usage in banking and public cash access points supports this dominance. ATM networks remain critical in both developed and emerging regions for financial inclusion. Innovations such as cardless withdrawals, facial recognition, and deposit-enabled machines increase utility. Kiosks follow closely, gaining traction in retail, hospitality, and healthcare through self-check-in, information access, and product ordering. Vending machines also expand into non-traditional offerings such as electronics and medicines, supporting the overall type segment growth.
- For instance, NCR-enabled ATMs support QR-based withdrawals used by major banks across Asia and North America. Kiosks expand rapidly beyond banking.
By End Use
The retail sector leads the market by end use, accounting for around 30% of the total market share in 2024. Retailers increasingly deploy self-checkout kiosks, smart vending systems, and digital signage to streamline operations and reduce wait times. Rising customer preference for convenience, speed, and personalized service supports wide adoption. Quick service restaurants (QSRs) follow as a key adopter, integrating self-ordering kiosks and mobile-connected solutions to improve order accuracy and upselling. Healthcare and transportation sectors also show strong growth due to patient check-in kiosks and ticketing systems, highlighting rising use across diverse industries.
Key Growth Drivers
Rising Demand for Contactless and Automated Services
Consumer demand for touch-free and efficient service options has surged, particularly after the COVID-19 pandemic. Businesses across retail, QSR, banking, and healthcare sectors now prioritize self-service technologies to reduce human interaction and improve speed. ATMs, vending machines, and kiosks with features like QR scanning, voice commands, and facial recognition are gaining rapid adoption. This shift addresses hygiene concerns and enhances convenience. Enterprises also benefit from operational cost reductions, minimized staffing needs, and consistent service quality. Contactless solutions also support 24/7 availability, especially in transportation and hospitality sectors. As digital-first customer behavior grows, organizations continue to invest in scalable, low-touch infrastructure, fueling long-term demand.
- For instance, Fuji Electric confirmed that over 80% of its vending machines installed in Japan support contactless payments.
Technological Advancements in Hardware and Software Integration
Advances in embedded systems, AI, IoT, and biometric authentication continue to enhance self-service technologies. Hardware units now come equipped with smart sensors, secure modules, and cloud connectivity. Software platforms offer real-time analytics, remote management, and AI-powered personalization. These integrations improve user experience, uptime, and data-driven decision-making. For instance, smart kiosks can adjust content based on customer demographics or behavior. Retailers use integrated systems for cross-selling, dynamic pricing, and loyalty program engagement. In BFSI and healthcare, enhanced software ensures compliance, fraud prevention, and data security. These developments attract enterprises aiming for automation, personalization, and improved customer engagement, thus accelerating market growth.
- For instance, Zebra Technologies deploys kiosks with embedded sensors and edge computing, supporting real-time inventory tracking across thousands of retail locations.
Cost Optimization and Operational Efficiency for Businesses
Self-service technologies offer businesses measurable cost benefits by automating repetitive customer-facing tasks. Retailers cut checkout times and reduce labor costs with self-checkout kiosks. Banks lower branch staffing needs by expanding ATM services. In QSRs, self-ordering kiosks help improve speed and reduce order errors. Maintenance is simplified through modular hardware and remote diagnostics. Businesses also gain real-time insights into usage patterns, inventory levels, and customer preferences. These efficiencies enhance service speed, reduce downtime, and improve ROI. The flexibility of deployment from compact kiosks to large-scale vending networks also enables businesses of all sizes to adopt self-service models, making them a key enabler of sustainable growth.
Key Trends & Opportunities
Integration of AI and Personalization Features
Artificial intelligence is transforming how self-service systems interact with users. AI-powered kiosks and vending machines use image recognition, voice interaction, and behavioral analytics to deliver tailored responses. In retail, machines can suggest products based on past purchases or demographics. In banking, AI enables fraud detection and smart navigation of services. Machine learning algorithms improve the adaptability of software, making interactions more intuitive. Personalized engagement increases customer satisfaction and loyalty. Businesses also leverage these tools for targeted promotions and data-driven insights. As AI becomes more affordable and accessible, its deeper integration into self-service platforms presents strong growth potential across verticals.
- For instance, NCR Voyix deploys AI-enabled retail kiosks using computer vision to recognize items and reduce checkout time to under 20 seconds per transaction in live retail pilots.
Expanding Use in Healthcare and Public Sector Services
The healthcare industry increasingly deploys self-service kiosks for patient check-ins, appointment scheduling, and health information access. These reduce administrative burden and enhance patient flow management. Hospitals use vending-style units to dispense medical products and supplies. Public sector services such as ID issuance, license renewals, and ticketing also benefit from kiosk-based automation. The shift supports higher service availability, shorter queues, and better allocation of manpower. In developing countries, government programs are leveraging these technologies to expand rural access to services. The growing digitalization of citizen services and healthcare delivery creates strong long-term opportunities for self-service solutions.
Key Challenges
High Initial Investment and Maintenance Costs
Despite long-term savings, the upfront cost of installing self-service machines—particularly advanced models with biometric or AI features—remains a barrier for many small to mid-sized enterprises. Costs include hardware purchase, software integration, network setup, training, and compliance. Additionally, machines in high-traffic areas face wear and tear, requiring frequent servicing or replacement of parts. Downtime from technical failures can lead to customer dissatisfaction and revenue loss. Businesses also bear the cost of periodic software upgrades and cybersecurity compliance. These factors can delay adoption in budget-sensitive sectors or in emerging markets with lower digital infrastructure readiness.
Security and Data Privacy Concerns
As self-service systems collect and process sensitive user data, including payment details and personal identifiers, they become potential targets for cyberattacks. A breach can expose customer data and damage brand trust. End-users are increasingly concerned about how their information is stored and used. Regulations such as GDPR and HIPAA demand strict data protection protocols, adding complexity to system design. For developers and operators, ensuring encryption, access control, and compliance increases costs and operational burdens. Failure to implement strong security measures can result in fines, reputational loss, and service disruptions, making cybersecurity a persistent challenge in this market.
Regional Analysis
North America
North America leads the self-service technologies market, holding over 35% of the global market share in 2024. High consumer preference for convenience and widespread adoption in retail, BFSI, and QSR sectors support dominance. The United States drives innovation with AI-enabled kiosks and cardless ATMs. Businesses invest heavily in automation to enhance customer experience and reduce labor costs. Strong digital infrastructure and early technology adoption further fuel growth. In Canada, rising deployment of healthcare kiosks and smart vending solutions continues to expand usage. The region’s focus on seamless, contactless services keeps demand consistently high across all sectors.
Europe
Europe holds around 27% of the global market share, driven by mature banking systems and strict regulatory compliance. Countries such as the UK, Germany, and France witness broad deployment of self-service terminals in transport, hospitality, and retail. Advanced contactless payment infrastructure and consumer openness to automation support growth. Retailers use kiosks to enable multilingual service and personalized offers. The healthcare sector adopts check-in kiosks for managing patient flows. Eco-friendly hardware adoption and energy-efficient machines align with sustainability mandates. Europe’s structured digital ecosystem and strong public-private tech collaborations continue to promote long-term market expansion.
Asia Pacific
Asia Pacific accounts for approximately 22% of the self-service technologies market in 2024 and is the fastest-growing region. Rising urbanization, increasing digital payment adoption, and expanding middle-class consumer base support growth. China and Japan lead in kiosk and vending machine deployment, while India sees rapid ATM and retail automation expansion. E-commerce growth drives demand for smart parcel lockers and self-pickup systems. Governments in Southeast Asia invest in smart city projects integrating public kiosks. Cost-effective hardware manufacturing in the region also aids local adoption. Regional enterprises adopt self-service solutions to reduce operational costs and reach underserved areas.
Latin America
Latin America holds nearly 8% of the global market share, with Brazil and Mexico leading regional demand. The retail and BFSI sectors drive adoption of self-service kiosks, ATMs, and vending machines to improve service accessibility. Growing interest in automation stems from labor cost challenges and the need to serve high-footfall areas efficiently. Mobile and digital banking services stimulate ATM modernization. Healthcare and public transport sectors show early signs of self-service integration. However, fragmented infrastructure and limited funding in rural areas slow adoption. Despite these constraints, rising digital literacy and mobile penetration create long-term market potential.
Middle East & Africa (MEA)
The MEA region captures about 6% of the global market share, with the UAE, Saudi Arabia, and South Africa driving demand. Smart city initiatives and digital transformation programs accelerate the deployment of kiosks and vending systems across public and commercial sectors. The BFSI sector invests in next-gen ATMs to enhance financial inclusion. Airports and hospitality hubs adopt interactive kiosks to streamline visitor services. Retailers implement self-checkout systems to improve operational efficiency. However, infrastructure gaps and high import costs of advanced hardware pose challenges in several African countries. Despite these, the region is showing steady adoption momentum.
Self-Service Technologies Market Segmentations:
By Component
- Hardware
- Software
- Services
By Type
- ATM
- Vending Machine
- Kiosks
- Others
By End Use
- Retail
- Quick Service Restaurant
- Hospitality
- Healthcare
- Corporate Offices
- Transportation
- BFSI
- Others
By Geography
- North America
- U.S.
- Canada
- Mexico
- Europe
- Germany
- France
- U.K.
- Italy
- Spain
- Rest of Europe
- Asia Pacific
- China
- Japan
- India
- South Korea
- South-east Asia
- Rest of Asia Pacific
- Latin America
- Brazil
- Argentina
- Rest of Latin America
- Middle East & Africa
- GCC Countries
- South Africa
- Rest of the Middle East and Africa
Competitive Landscape
The self-service technologies market features a competitive landscape marked by innovation, strategic partnerships, and product diversification. Leading players such as NCR Corporation, Diebold Nixdorf, Ingenico Group, and Elo Touch Solutions maintain strong market presence through robust hardware offerings and integrated software platforms. Companies focus on enhancing user experience with AI-powered interfaces, biometric authentication, and remote management tools. KIOSK Information Systems, Meridian Kiosks, and Olea Kiosks cater to niche demands with custom kiosk designs across sectors like retail, transportation, and healthcare. Emerging players such as Avanti Markets and Embross drive innovation in vending and check-in solutions, respectively. Strategic mergers, investments in R&D, and global expansion efforts shape competitive positioning. Vendors also emphasize compliance with data security and accessibility standards. As businesses prioritize automation, vendors compete on reliability, uptime, and service support, while addressing vertical-specific needs. The market remains moderately fragmented, with regional players competing alongside global giants for specialized deployments and long-term contracts.
Key Player Analysis
- Facility Management System
- Embross
- Olea Kiosks
- Avanti Markets
- Elo Touch Solutions
- Emergency Management
- GRG Banking
- Ingenico Group
- Meridian Kiosks
- Phoenix Kiosk
- Diebold Nixdorf
- KIOSK Information Systems
- NCR Corporation
Recent Developments
- In 2025, Diebold Nixdorf partnered with LOC Software, enabling LOC’s ThriVersA software to run natively on Diebold Nixdorf’s self-checkout and kiosk systems aimed at simplifying deployment and improving flexibility for retailers.
- In August 2025, Zebra acquired Elo Touch Solutions to expand its footprint in customer-facing self-service kiosks, POS terminals, and interactive touchscreen solutions across retail, hospitality, QSR, healthcare and industrial markets.
- In May 2025, Diebold Nixdorf launched a new retail-technology production line in North Canton, Ohio to build self-service kiosks and checkout systems for grocery, general merchandise, QSR (quick service restaurant), and convenience retailers in the U.S.
- In May 2023, Applova Inc., a Silicon Valley-based technology company announced a partnership with Samsung to launch a Self-service kiosk for restaurants. These kiosk offers contactless ordering and payment, helping restaurants streamline operations, increase sales, and boost profits.
Report Coverage
The research report offers an in-depth analysis based on Component, Type, End-Use and Geography. It details leading market players, providing an overview of their business, product offerings, investments, revenue streams, and key applications. Additionally, the report includes insights into the competitive environment, SWOT analysis, current market trends, as well as the primary drivers and constraints. Furthermore, it discusses various factors that have driven market expansion in recent years. The report also explores market dynamics, regulatory scenarios, and technological advancements that are shaping the industry. It assesses the impact of external factors and global economic changes on market growth. Lastly, it provides strategic recommendations for new entrants and established companies to navigate the complexities of the market.
Future Outlook
- Businesses will increase investment in self-service kiosks to reduce labor costs and improve efficiency.
- AI and machine learning will enhance personalization and decision-making in kiosks and ATMs.
- Contactless technologies such as QR codes and facial recognition will become standard features.
- Healthcare and government sectors will expand deployment of self-check-in and information kiosks.
- Integration with cloud platforms will enable real-time monitoring and remote system updates.
- Retailers will adopt smart vending and self-checkout systems to optimize customer service.
- Voice-enabled interfaces will improve accessibility and ease of use for diverse users.
- Energy-efficient and modular hardware designs will gain traction across global markets.
- Emerging economies will see increased adoption driven by digital inclusion initiatives.
- Data privacy and cybersecurity will remain key priorities for vendors and end-users.
Request a Free Sample
Fill in your details and we'll send you a free sample report.
- Sample data tables & charts
- Research methodology
Need a Custom Version of This Report?
Tailor the scope, geography, or segments to your exact requirements.
- Custom geography or segment scope
- Direct access to our analyst team
Frequently Asked Questions
What is the current market size for the Self-service technologies market, and what is its projected size in 2032?
At what Compound Annual Growth Rate is the Self-service technologies market projected to grow between 2024 and 2032?
Which Self-service technologies market segment held the largest share in 2024?
What are the primary factors fueling the growth of the Self-service technologies market?
Who are the leading companies in the Self-service technologies market?
Which region commanded the largest share of the Self-service technologies market in 2024?
Table of Content
Chapter 1. Report Introduction
- 1.1 Report Description & Purpose
- 1.1.1 Report Title & Market Definition
- 1.1.2 Unique Selling Propositions (USP) & Key Differentiators
- 1.1.3 Value Proposition for Stakeholders
- 1.2 Research Objectives
- 1.2.1 Market Sizing Objectives (Volume & Revenue)
- 1.2.2 Segmentation Objectives
- 1.2.3 Competitive Intelligence Objectives
- 1.2.4 Forecast & Scenario Objectives
- 1.3 Report Scope
- 1.3.1 Self-Service Technologies Scope – Types & Subtypes Covered
- 1.3.2 Geographic Scope – Regions & Countries Covered
- 1.3.3 Historical Period, Base Year & Forecast Period (2024; forecast to 2032)
- 1.3.4 Inclusions & Exclusions
- 1.4 HS Code & Classification Framework
- 1.5 Currency, Units & Pricing Basis
- 1.6 Target Stakeholders
- 1.7 Limitations & Assumptions
Chapter 2. Executive Summary
- 2.1 Global Self-Service Technologies Market Snapshot
- 2.1.1 Market Size – Historical (2024) & Forecast (2024-2032) (2024: USD 42,148.6 million → 2032: USD 68,199.2 million)
- 2.1.2 Volume & Revenue – Global Totals
- 2.1.3 Key Market Highlights – Top Five Facts
- 2.2 Self-Service Technologies Market Segmentation Snapshot
- 2.2.1 Market Split by Region – 2024 vs. 2032
- 2.3 Competitive Snapshot
- 2.3.1 Top 10 Players by Revenue Share – 2024
- 2.3.2 Top 10 Players by Volume Share – 2024
- 2.3.3 Recent Strategic Developments (18-Month Summary)
- 2.4 Key Investment Highlights & Strategic Conclusions
Chapter 3. Self-Service Technologies Market Dynamics & Industry Analysis
- 3.1 Market Overview & Context
- 3.1.1 Self-Service Technologies Market Position in the Broader Automotive Value Chain
- 3.1.2 OEM vs. Replacement Market Dynamics
- 3.1.3 Market Maturity & Development Stage by Region
- 3.2 Self-Service Technologies Market Drivers
- 3.3 Self-Service Technologies Market Restraints & Challenges
- 3.4 Self-Service Technologies Market Opportunities
- 3.5 Porter's Five Forces Analysis
- 3.5.1 Threat of New Entrants
- 3.5.2 Bargaining Power of Suppliers
- 3.5.3 Bargaining Power of Buyers
- 3.5.4 Threat of Substitutes
- 3.5.5 Competitive Rivalry – Intensity Assessment
- 3.6 Self-Service Technologies Value Chain Analysis
- 3.6.1 Upstream – Raw Material/Input Suppliers
- 3.6.1.1 Raw Material/Input 1
- 3.6.1.2 Raw Material/Input 2
- 3.6.1.3 Raw Material/Input 3
- 3.6.2 Midstream – Production/Manufacturing/Service Delivery
- 3.6.2.1 Production/Process Overview
- 3.6.2.2 Key Facility Locations & Capacity by Manufacturer
- 3.6.3 Downstream – Distribution & End Consumer
- 3.6.3.1 Primary Channel – B2B/OEM
- 3.6.3.2 Secondary Channels – Dealer, Retail, Online, Direct
- 3.6.4 Value Chain Profitability Analysis
- 3.6.1 Upstream – Raw Material/Input Suppliers
- 3.7 PESTEL Analysis
- 3.7.1 Political Factors
- 3.7.2 Economic Factors
- 3.7.3 Social Factors
- 3.7.4 Technological Factors
- 3.7.5 Environmental Factors
- 3.7.6 Legal Factors
- 3.8 Self-Service Technologies Supply Chain Analysis
- 3.8.1 Raw Material/Input Supply Risk Assessment
- 3.8.2 Manufacturing Concentration Risk (Geographic Exposure)
- 3.8.3 Trade Disruption Impact Analysis
- 3.9 Regulatory & Policy Landscape
Note: The regulatory and policy landscape section covers regulations based on their applicability to the market, Self-Service Technologies category, geography, and scope of the study. Only regulatory frameworks with a material impact on operations, compliance, trade, sustainability, or market access are analyzed in detail.
Chapter 4. Key Investment Pockets & Opportunity Analysis
- 4.1 Self-Service Technologies Market Attractiveness Analysis
- 4.1.1 By Region – Investment Attractiveness Matrix (Volume × CAGR)
- 4.2 Absolute Revenue Growth Opportunity
- 4.2.1 By Region – Absolute USD Growth Through 2032
- 4.3 Incremental Volume Opportunity
- 4.3.1 By Region – Incremental Volume Through 2032
- 4.3.2 Segment – Incremental Volume
- 4.4 Emerging Submarket Opportunity Deep Dive (Subject to Applicability)
- 4.5 Emerging Market Opportunity Scorecards
- 4.5.1 United States
- 4.5.2 Europe
- 4.5.3 Asia
- 4.5.4 Middle East & Africa
Note: Emerging Market Opportunity Scorecards will be included based on relevance and strategic importance. Regions listed are indicative and may vary depending on data availability and market dynamics.
Chapter 5. Self-Service Technologies Import-Export Analysis & Trade Flows
- 5.1 Global Trade Overview
- 5.1.1 Global Export Value by Country (2024)
- 5.1.2 Global Export Volume by Country (2024)
- 5.1.3 Global Import Value by Country (2024)
- 5.1.4 Global Import Volume by Country (2024)
- 5.1.5 Net Trade Balance by Country (2024)
- 5.2 Export Analysis – Segment
- 5.2.1 Type 1 (HS Code)
- 5.2.2 Type 2 (HS Code)
- 5.2.3 Type 3 (HS Code)
- 5.2.4 Type 4 (HS Code)
- 5.2.5 Type 5 (HS Code)
- 5.3 Import Analysis – Segment
- 5.3.1 Type 1 (HS Code)
- 5.3.2 Type 2 (HS Code)
- 5.3.3 Type 3 (HS Code)
- 5.3.4 Type 4 (HS Code)
- 5.3.5 Type 5 (HS Code)
- 5.4 Average Unit Trade Prices
- 5.4.1 Average Export Price – Segment & Country
- 5.4.2 Average Import Price – Segment & Source Country
- 5.4.3 Price Trends (2024)
- 5.5 Key Trade Route Analysis
- 5.5.1 Trade Route 1
- 5.5.2 Trade Route 2
- 5.5.3 Trade Route 3
- 5.5.4 Trade Route 4
- 5.5.5 Trade Route 5
- 5.6 Trade Policy Impact Assessment
- 5.6.1 US Anti-Dumping & Section 301 Tariffs
- 5.6.2 EU Customs Union Impact
- 5.6.3 Major Free Trade Agreements
- 5.6.4 USMCA Rules of Origin
Note: Trade policy analysis will be included only where relevant to the Self-Service Technologies market.
Chapter 6. Competitive Landscape & Company Benchmarking
- 6.1 Self-Service Technologies Market Concentration & Structure
- 6.1.1 Herfindahl-Hirschman Index (HHI) – vs. 2024
- 6.1.2 Tier 1, Tier 2 & Tier 3 Market Structure
- 6.1.3 Global, Regional & Local Player Dynamics
- 6.2 Self-Service Technologies Market Share Analysis – 2024
- 6.2.1 Global Revenue Share by Company
- 6.2.2 Global Volume Share by Company
- 6.2.3 Regional Revenue Share
- 6.2.4 Market Share Evolution ( vs. 2024)
- 6.2.5 OEM Segment Share by Company
- 6.2.6 Replacement Segment Share by Company
- 6.3 Production/Delivery Capacity & Facility Analysis
- 6.3.1 Global Installed Capacity
- 6.3.2 Capacity Utilization Rates
- 6.3.3 Production/Output Volume
- 6.3.4 Facility Locations & Capacity Map
- 6.3.5 Planned Capacity Additions
- 6.4 Self-Service Technologies Competitive Benchmarking Matrix
- 6.4.1 Revenue, Volume, CAGR & Profitability Comparison
- 6.4.2 Channel Revenue Mix
- 6.4.3 Geographic Revenue Exposure
- 6.4.4 R&D Intensity
- 6.4.5 Sustainability Maturity
- 6.5 Strategic Developments in Self-Service Technologies (Last 24 Months)
- 6.5.1 Mergers, Acquisitions & Divestments
- 6.5.2 New Self-Service Technologies Launches
- 6.5.3 Facility Expansions
- 6.5.4 Strategic Alliances, Joint Ventures & Partnerships
- 6.5.5 Distribution Expansion & Market Entry
- 6.5.6 Sustainability & ESG Initiatives
- 6.6 Competitive Strategy Mapping
- 6.6.1 Leader, Challenger, Follower & Niche Classification
- 6.6.2 Pricing Strategy Comparison
- 6.6.3 Channel Strategy Matrix
Note: Strategic developments are included based on their materiality and the availability of reliable information.
Chapter 7. Global Self-Service Technologies Market – By Distribution Channel
- 7.1 Segment Overview
- 7.1.1 Volume & Revenue Split by Channel (2024 & 2032)
- 7.1.2 Channel Mix Evolution (2024-2032)
Chapter 8. Regional Market Analysis – Global Overview
- 8.1 Global Regional Overview
- 8.1.1 Regional Volume Share
- 8.1.2 Regional Revenue Share
- 8.1.3 Regional Volume by Region
- 8.1.4 Regional Revenue by Region
- 8.1.5 Regional Forecast Through 2032
- 8.2 Cross-Regional Segment Analysis
- 8.2.1 By Distribution Channel
- 8.2.2 By Brand/Price Tier
Chapter 9. North America Self-Service Technologies Market
- 9.1 United States
- 9.2 Canada
- 9.3 Mexico
Chapter 10. Europe Self-Service Technologies Market
- 10.1 Germany
- 10.2 France
- 10.3 Italy
- 10.4 United Kingdom
- 10.5 Spain
- 10.6 Poland
- 10.7 Russia
- 10.8 Netherlands
- 10.9 Belgium
- 10.10 Sweden
- 10.11 Denmark
- 10.12 Norway
- 10.13 Rest of Europe
Chapter 11. Asia Pacific Self-Service Technologies Market
- 11.1 China
- 11.2 India
- 11.3 Japan
- 11.4 South Korea
- 11.5 Thailand
- 11.6 Indonesia
- 11.7 Vietnam
- 11.8 Malaysia
- 11.9 Australia
- 11.10 Rest of Asia Pacific
Chapter 12. Latin America Self-Service Technologies Market
- 12.1 Brazil
- 12.2 Argentina
- 12.3 Colombia
- 12.4 Chile
- 12.5 Rest of Latin America
Chapter 13. Middle East Self-Service Technologies Market
- 13.1 Saudi Arabia
- 13.2 United Arab Emirates
- 13.3 Turkey
- 13.4 Israel
- 13.5 Iran
- 13.6 Rest of the Middle East
Chapter 14. Africa Self-Service Technologies Market
- 14.1 South Africa
- 14.2 Egypt
- 14.3 Nigeria
- 14.4 Morocco
- 14.5 Rest of Africa
Chapter 15. Self-Service Technologies Company Profiles
- 15.1 [Company 01]
- 15.1.1 Company Overview
- 15.1.2 Key Management Personnel
- 15.1.3 Products & Services Portfolio
- 15.1.4 Financial Performance
- 15.1.5 Key Market Focus & Geographic Presence
- 15.1.6 Recent Developments & Strategic Initiatives
Note: The company profile list is preliminary and may change based on research findings, market developments, data availability, and client requirements.
Chapter 16. Appendices
- Appendix A – List of Abbreviations & Acronyms
- Appendix B – Industry Classification Code Reference – Full Series
- Appendix C – Production & Capacity Data Tables
- Appendix D – End-Use & Demand Base Tables
- Appendix E – Consumption & Replacement Rate Assumptions
- Appendix F – ASP Reference Tables
- Appendix G – Manufacturing & Facility Database
- Appendix H – Import-Export Data Tables
- Appendix I – Regulatory Summary Tables
- Appendix J – Primary Research Participant List (Anonymized)
- Appendix K – Primary Research Questionnaire Framework
- Appendix L – Data Sources & Bibliography
- Appendix M – Market Size Divergence & Source Comparison
Chapter 17. Research Methodology
- 17.1 Research Framework & Philosophy
- 17.2 Secondary Research – Sources, Hierarchy & Data Extraction
- 17.3 Data Modeling – Bottom-Up & Top-Down Market Sizing
- 17.4 Primary Research – Stakeholder Framework, LOI & Sample Sizes
- 17.5 Forecast Methodology – Regression, Scenario & Sensitivity Analysis
- 17.6 Quality Control – Four-Layer Validation Framework
- 17.7 Limitations & Standard Assumptions
- 17.8 Disclaimer
