
Biohacking Market Overview:
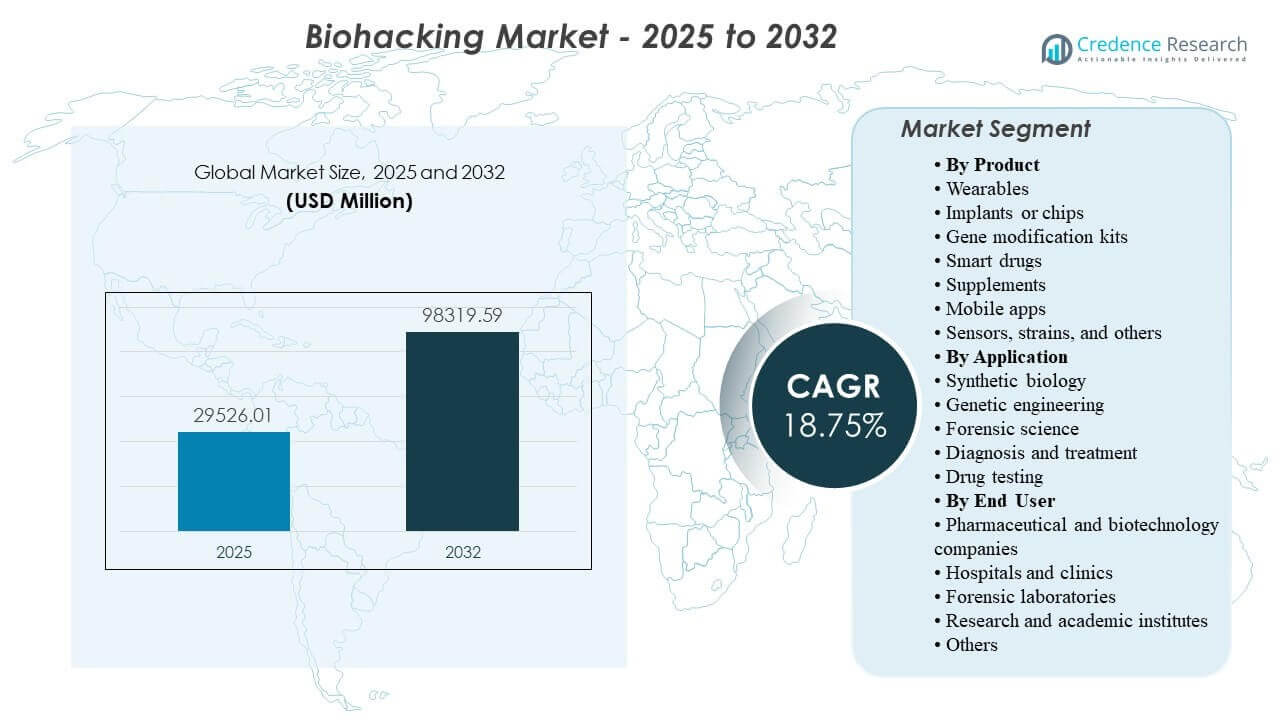
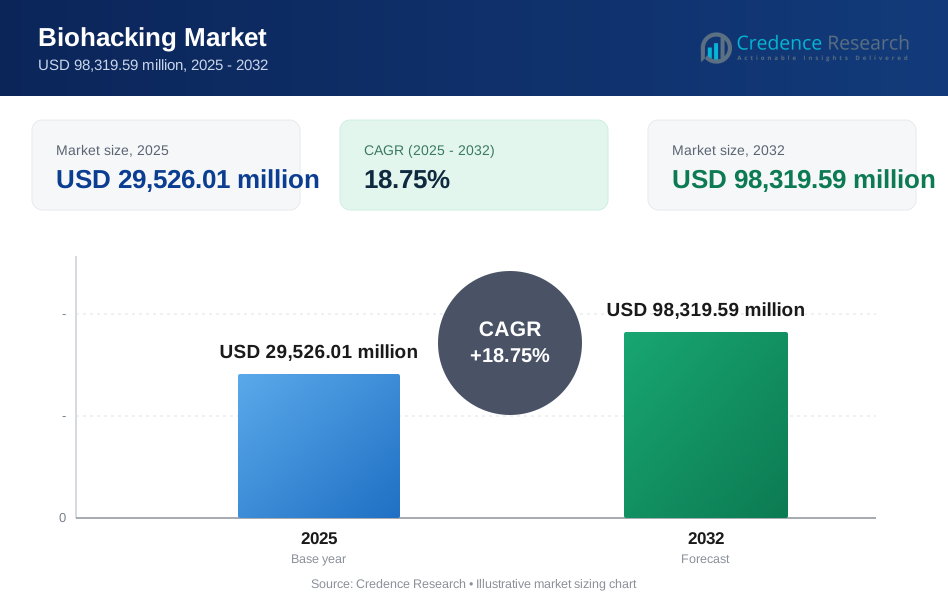
The global Biohacking Market size was estimated at USD 29,526.01 million in 2025 and is expected to reach USD 98,319.59 million by 2032, growing at a CAGR of 18.75% from 2025 to 2032. Demand is primarily being accelerated by the normalization of continuous self-monitoring, where consumers and organizations increasingly rely on always-on biometrics and personalized protocols to optimize sleep, stress, recovery, cognition, and metabolic performance. Growth momentum is also supported by expanding device ecosystems and clinical-adjacent use cases that improve engagement, retention, and the value of integrated data-driven routines.
| REPORT ATTRIBUTE | DETAILS |
|---|---|
| Historical Period | 2020-2024 |
| Base Year | 2025 |
| Forecast Period | 2026-2032 |
| Biohacking Market Size 2025 | USD 29,526.01 million |
| Biohacking Market, CAGR | 18.75% |
| Biohacking Market Size 2032 | USD 98,319.59 million |
Key Market Trends & Insights
- North America accounted for 41.70% in 2025, reflecting strong monetization of wearables, apps, and premium wellness ecosystems.
- Smart drugs held 39.40% share in 2025 within product categories, supported by rising demand for cognitive and performance enhancement routines.
- Diagnosis and treatment represented 31.80% share in 2024, driven by increasing use of self-tracking data to inform personalized interventions and monitoring pathways.
- Pharmaceutical and biotechnology companies held 35.20% share in 2024, reflecting deeper use of biomarker-linked insights and data streams across R&D and precision workflows.
- Forensic laboratories are projected to grow at 22.2% CAGR (2025–2030), supported by rising adoption of advanced analysis methods and faster evidence processing needs.
Segment Analysis
The Biohacking Market is evolving from isolated self-experimentation into structured routines built around measurable outputs, where users increasingly seek repeatable protocols and reliable feedback loops. Integration across devices and software is strengthening engagement because sleep, activity, stress, and recovery metrics can be combined into a single performance narrative rather than separate dashboards. Partnerships that enable cross-platform data flow are reinforcing this shift by improving data continuity and actionable insights at the individual level. At the same time, privacy and cybersecurity concerns are becoming more visible as health-related data volumes increase and breach incidents draw attention to risk management.
Commercial demand is widening beyond consumers, with organizations adopting biohacking-adjacent approaches where productivity, recovery, and risk reduction benefit from monitoring and intervention programs. A growing share of innovation is aimed at lowering friction through automated insights, coaching features, and passive sensing, which supports higher retention and subscription conversion. Investments that connect biosensing with consumer wearables are improving credibility for metabolic and preventive monitoring use cases. In parallel, the market continues to face constraints from evidence variability across products and the need for clearer standards on data accuracy, claims substantiation, and responsible usage.
By Product Insights
Smart drugs accounted for the largest share of 39.40% in 2025. This leadership is supported by strong consumer interest in cognitive performance, focus, and fatigue management routines that can be adopted quickly without significant workflow change. The segment benefits from broad availability across channels, frequent repurchase behavior, and the ability to bundle into personalized “stacks” aligned to outcomes such as sleep quality, stress resilience, or productivity. Ongoing product differentiation through ingredient positioning, dosing formats, and companion tracking tools strengthens premiumization, although scrutiny around claims and safety profiles remains a key consideration.
By Application Insights
Diagnosis and treatment accounted for the largest share of 31.80% in 2024. The segment leads as biometric tracking is increasingly used to support early signals detection and ongoing monitoring routines that complement traditional care pathways. Continuous data from consumer devices and apps improves pattern recognition for sleep, stress, and recovery, which makes biohacking tools more relevant to day-to-day health optimization programs. Improved accessibility of testing, measurement, and coaching features is expanding the practical use of biohacking protocols for individualized interventions, while data privacy and interpretation quality remain important adoption gates.
By End User Insights
Pharmaceutical and biotechnology companies accounted for the largest share of 35.20% in 2024. This dominance is driven by the strategic value of measurable human signals and biomarker-linked insights that can strengthen R&D decision-making and personalization strategies. Organizations in this segment are positioned to adopt higher-complexity tools, integrate multi-source datasets, and fund validation approaches that improve signal reliability. Collaboration across device, diagnostics, and digital platforms is also expanding the role of biohacking-adjacent data streams in precision medicine workflows and applied research.
Biohacking Market Drivers
Expansion of continuous biometrics and passive sensing
Wider adoption of wearable and sensor-based tracking is making health optimization more measurable, which strengthens engagement and repeat usage across biohacking routines. Passive sensing reduces effort and improves adherence because users can collect longitudinal data without manual logging. Multi-metric tracking is improving personalization by linking sleep, stress, recovery, and activity signals into combined decision frameworks. The result is higher perceived value, enabling premium subscriptions and ecosystem bundling across devices and software.
Growth of integrated digital health ecosystems
Biohacking adoption is increasingly driven by ecosystems that combine hardware, apps, analytics, and coaching into a single workflow. Integration improves the utility of data because trends can be interpreted with context rather than isolated measurements. Platform interoperability is also increasing switching costs, supporting retention and higher lifetime value. These ecosystems accelerate commercialization by enabling upgrades, add-on services, and partner integrations that expand user touchpoints.
- For instance, Withings reports that more than 100 apps are compatible with its ecosystem and that it also provides an open API, showing how interoperability can expand platform utility and support ongoing partner-led integrations.
Increasing demand for cognitive and performance optimization
Consumers and professionals continue to invest in productivity and resilience routines, supporting sustained demand for cognitive-enhancement categories and structured protocols. Behavioral focus on sleep quality, stress management, and recovery has strengthened the perceived role of quantified feedback in daily decision-making. Product formats that offer rapid adoption and clear outcome narratives benefit most from this demand cycle. This driver is amplified by social normalization of self-tracking and the broader wellness economy.
- For instance, Muse S uses EEG-based monitoring and tracks brainwave activity, heart rate, breathing, and body movements, while its app analyzes three sleep stages light, deep, and REM giving users quantified feedback for meditation, sleep, and recovery routines.
Broader institutional adoption and validation pathways
Enterprise and clinical-adjacent adoption is rising where monitoring and interventions support outcomes such as performance consistency, adherence, and risk reduction. Organizations are increasingly willing to fund validation, integration, and data governance frameworks to improve reliability and defensibility. Cross-sector partnerships are strengthening credibility and accelerating access to new user segments. As validation expands, the market gains pathways to higher-value use cases that can scale beyond consumer novelty.
Biohacking Market Challenges
Data privacy, cybersecurity exposure, and governance complexity remain core constraints as biohacking relies on continuous collection of sensitive personal information across devices and platforms. As the number of data touchpoints expands, risks increase related to unauthorized access, weak consent controls, and unclear data sharing practices. These concerns can slow adoption in institutional settings where compliance and accountability requirements are higher. Buyers increasingly demand transparent security practices and clear data ownership terms before scaling deployments.
Variability in evidence quality and product claims also challenges market consistency, especially in categories where outcomes are subjective or hard to validate across diverse populations. Differences in measurement accuracy across devices can lead to inconsistent interpretation and reduced trust in recommendations. Regulatory ambiguity across regions can further complicate commercialization, particularly for products that blur the line between wellness, diagnostics, and therapeutic support. Vendors that invest in validation, standardized metrics, and responsible claims practices are better positioned to overcome these frictions.
- For instance, Dexcom reports that Dexcom G7 delivers a MARD of 8.2%, while Oura reports that its latest sleep staging algorithm achieved 76–78% accuracy for four-stage classification and 92–93% accuracy for sleep-wake classification in a validation study spanning 157 nights across 58 participants, showing how quantified performance evidence can materially strengthen credibility in biohacking-related devices.
Biohacking Market Trends and Opportunities
Biohacking is moving toward AI-guided coaching and automated personalization, where platforms convert raw biometrics into actionable interventions across sleep, stress, recovery, and cognition workflows. Opportunity is expanding for subscription-led business models that combine monitoring, insights, and habit programs into recurring engagement loops. New value is also emerging from interoperability that enables two-way data flow across biosensors, wearables, and software ecosystems, improving continuity and personalization. Companies that can prove measurable outcomes and sustain engagement are positioned to capture premium pricing.
An additional opportunity lies in expanding institutional use cases, including applied research, workplace performance programs, and clinical-adjacent monitoring pathways. As more datasets are collected longitudinally, platforms can build stronger benchmarks and population-level insights that improve personalization accuracy. Growth also benefits from new form factors and higher-quality sensing that reduce friction and expand daily wearability. Vendors that pair product innovation with strong governance and validation can accelerate adoption in regulated or risk-sensitive environments.
- For instance, Empatica demonstrates this pathway through its Embrace2 and EpiMonitor technologies: in clinical testing across 141 patients with epilepsy, Embrace2 detected 53 of 54 generalized tonic-clonic seizures for 98% accuracy, and Empatica states that the EpiMonitor algorithm posts a false alarm rate of 0.05 per day for children and 0.02 per day for adults during rest.
Regional Insights
North America
North America held the largest revenue share at 41.70% in 2025, supported by high consumer willingness to pay for premium health technologies, mature device ecosystems, and strong commercialization of subscription-led wellness platforms. The region benefits from widespread adoption of advanced wearables and stronger availability of companion services that convert data into repeatable protocols. Demand is also reinforced by active innovation in biosensing integrations and broad distribution reach across digital channels.
Europe
Europe represented an estimated 23.10% share in 2025, driven by strong consumer interest in wellness optimization and established digital health infrastructure across major markets. Adoption is supported by a growing ecosystem of wearable users and services focused on sleep, stress, and recovery routines. Regulatory rigor encourages clearer data governance and quality expectations, which can strengthen trust but also increase compliance complexity for vendors.
Asia Pacific
Asia Pacific accounted for an estimated 20.60% share in 2025, underpinned by rapid technology adoption, expanding middle-class demand for wellness tools, and increasing use of mobile-first health platforms. Strong growth is supported by scale effects, rising device penetration, and wider availability of consumer health applications. The region also benefits from fast iteration cycles in consumer electronics and growing interest in measurable performance routines.
Latin America
Latin America captured an estimated 8.90% share in 2025, reflecting increasing uptake in private healthcare and wellness segments but constrained by affordability and uneven access to premium devices. Adoption is strongest where mobile health engagement is high and urban consumers show willingness to pay for tracking and coaching services. Growth potential improves as device prices decline and platforms optimize for mobile-first usage patterns.
Middle East & Africa
Middle East & Africa held an estimated 5.70% share in 2025, supported by pockets of high spending in select markets and gradual expansion of healthcare modernization initiatives. Adoption is uneven due to infrastructure and affordability differences, but demand is increasing for wellness optimization and preventive monitoring in higher-income segments. Vendors that localize distribution, pricing, and support models can improve penetration across diverse country contexts.
Competitive Landscape
Competition in the Biohacking Market is shaped by ecosystem breadth, data accuracy, user engagement design, and the ability to translate measurements into actionable outcomes. Vendors compete through product differentiation across form factors, sensing depth, software intelligence, and coaching or subscription layers that improve retention. Strategic partnerships are increasingly important to enable interoperability and strengthen credibility for higher-value use cases. Companies also differentiate through brand trust, privacy posture, and evidence alignment to sustain adoption at scale.
Apple Inc. is positioned around an ecosystem-led approach that combines consumer device scale with expanding health monitoring capabilities and software integration. Product progress is reinforced by platform continuity, where users can connect daily tracking behaviors with structured insights and notifications that support habit reinforcement. The company’s strength lies in mainstream adoption and frictionless user experience, which can expand the addressable base for biohacking-style self-quantification behaviors. Ongoing platform enhancements and integration pathways support durable engagement and premium positioning across hardware and services.
The industry research and growth report includes detailed analyses of the competitive landscape of the market and information about key companies, including:
- Apple Inc.
- The ODIN
- Thync Global Inc.
- Fitbit, Inc.
- HVMN Inc.
- Moodmetric
- Muse (Interaxon Inc.)
- Thriveport LLC
- TrackMyStack
- OsteoStrong
- Oura Health Oy
- Pavlok
- Biostrap
- Nuanic
- Synbiota
- Health Via Modern Nutrition Inc.
- Revive Biohacking
- ReCELLebrate
Qualitative and quantitative analysis of companies has been conducted to help clients understand the wider business environment as well as the strengths and weaknesses of key industry players. Data is qualitatively analyzed to categorize companies as pure play, category-focused, industry-focused, and diversified; it is quantitatively analyzed to categorize companies as dominant, leading, strong, tentative, and weak.
Recent Developments
- In May 2025, WHOOP launched WHOOP 5.0 and WHOOP MG, introducing new wearable devices with upgraded sensors, a smaller design, longer battery life, and added health features such as ECG, blood pressure monitoring, and hormonal insights aimed at health and performance tracking.
- In June 2025, ŌURA partnered with Maven Clinic so users could sync biometric data such as sleep, stress, and activity into the Maven platform, giving care teams deeper visibility into member health and extending ŌURA’s role in connected preventive care.
- In July 2025, Viome Life Sciences announced a partnership with Microsoft to combine Viome’s human and microbial gene-expression dataset with Microsoft Azure infrastructure, with the goal of advancing preventive and personalized healthcare through faster molecular analysis and AI-driven insights.
- In August 2025, ŌURA expanded its product offering by launching Pregnancy Insights and Perimenopause Check-In, two new features designed to help women track physiological changes, monitor symptoms, and access guided care pathways through the Oura app.
Report Scope
| Report Attribute | Details |
| Market size value in 2025 | USD 29,526.01 million |
| Revenue forecast in 2032 | USD 98,319.59 million |
| Growth rate (CAGR) | 18.75% (2025–2032) |
| Base year | 2025 |
| Forecast period | 2026–2032 |
| Quantitative units | USD million |
| Segments covered | By Product: Wearables; Implants or chips; Gene modification kits; Smart drugs; Supplements; Mobile apps; Sensors, strains, and others. By Application: Synthetic biology; Genetic engineering; Forensic science; Diagnosis and treatment; Drug testing. By End User: Pharmaceutical and biotechnology companies; Hospitals and clinics; Forensic laboratories; Research and academic institutes; Others. |
| Regional scope | North America; Europe; Asia Pacific; Latin America; Middle East & Africa |
| Key companies profiled | Apple Inc.; The ODIN; Thync Global Inc.; Fitbit, Inc.; HVMN Inc.; Moodmetric; Muse (Interaxon Inc.); Thriveport LLC; TrackMyStack; OsteoStrong; Oura Health Oy; Pavlok; Biostrap; Nuanic; Synbiota; Health Via Modern Nutrition Inc.; Revive Biohacking; ReCELLebrate |
| No. of Pages | 332 |
By Segmentation
By Product
- Wearables
- Implants or chips
- Gene modification kits
- Smart drugs
- Supplements
- Mobile apps
- Sensors, strains, and others
By Application
- Synthetic biology
- Genetic engineering
- Forensic science
- Diagnosis and treatment
- Drug testing
By End User
- Pharmaceutical and biotechnology companies
- Hospitals and clinics
- Forensic laboratories
- Research and academic institutes
- Others
By Region
- North America
- U.S.
- Canada
- Mexico
- Europe
- Germany
- France
- U.K.
- Italy
- Spain
- Rest of Europe
- Asia Pacific
- China
- Japan
- India
- South Korea
- South-east Asia
- Rest of Asia Pacific
- Latin America
- Brazil
- Argentina
- Rest of Latin America
- Middle East & Africa
- GCC Countries
- South Africa
- Rest of the Middle East and Africa
Request a Free Sample
Fill in your details and we'll send you a free sample report.
- Sample data tables & charts
- Research methodology
Need a Custom Version of This Report?
Tailor the scope, geography, or segments to your exact requirements.
- Custom geography or segment scope
- Direct access to our analyst team
Frequently Asked Questions
What is the Biohacking Market size in 2025 and what is the forecast for 2032?
What is the CAGR of the Biohacking Market during 2025–2032?
What is the leading product segment in the Biohacking Market?
What is the largest application area in the Biohacking Market?
Which end user segment leads adoption in the Biohacking Market?
Which region leads the Biohacking Market in 2025?
Table of Content
Chapter 1. Report Introduction
- 1.1 Report Description & Purpose
- 1.1.1 Report Title & Market Definition
- 1.1.2 Unique Selling Propositions (USP) & Key Differentiators
- 1.1.3 Value Proposition for Stakeholders
- 1.2 Research Objectives
- 1.2.1 Market Sizing Objectives (Volume & Revenue)
- 1.2.2 Segmentation Objectives
- 1.2.3 Competitive Intelligence Objectives
- 1.2.4 Forecast & Scenario Objectives
- 1.3 Report Scope
- 1.3.1 Biohacking Scope – Types & Subtypes Covered
- 1.3.2 Geographic Scope – Regions & Countries Covered
- 1.3.3 Historical Period, Base Year & Forecast Period (2025; forecast to 2032)
- 1.3.4 Inclusions & Exclusions
- 1.4 HS Code & Classification Framework
- 1.5 Currency, Units & Pricing Basis
- 1.6 Target Stakeholders
- 1.7 Limitations & Assumptions
Chapter 2. Executive Summary
- 2.1 Global Biohacking Market Snapshot
- 2.1.1 Market Size – Historical (2025) & Forecast (2025-2032) (2025: USD 29,526.01 million → 2032: USD 98,319.59 million)
- 2.1.2 Volume & Revenue – Global Totals
- 2.1.3 Key Market Highlights – Top Five Facts
- 2.2 Biohacking Market Segmentation Snapshot
- 2.2.1 Market Split by Region – 2025 vs. 2032
- 2.3 Competitive Snapshot
- 2.3.1 Top 10 Players by Revenue Share – 2025
- 2.3.2 Top 10 Players by Volume Share – 2025
- 2.3.3 Recent Strategic Developments (18-Month Summary)
- 2.4 Key Investment Highlights & Strategic Conclusions
Chapter 3. Biohacking Market Dynamics & Industry Analysis
- 3.1 Market Overview & Context
- 3.1.1 Biohacking Market Position in the Broader Automotive Value Chain
- 3.1.2 OEM vs. Replacement Market Dynamics
- 3.1.3 Market Maturity & Development Stage by Region
- 3.2 Biohacking Market Drivers
- 3.3 Biohacking Market Restraints & Challenges
- 3.4 Biohacking Market Opportunities
- 3.5 Porter's Five Forces Analysis
- 3.5.1 Threat of New Entrants
- 3.5.2 Bargaining Power of Suppliers
- 3.5.3 Bargaining Power of Buyers
- 3.5.4 Threat of Substitutes
- 3.5.5 Competitive Rivalry – Intensity Assessment
- 3.6 Biohacking Value Chain Analysis
- 3.6.1 Upstream – Raw Material/Input Suppliers
- 3.6.1.1 Raw Material/Input 1
- 3.6.1.2 Raw Material/Input 2
- 3.6.1.3 Raw Material/Input 3
- 3.6.2 Midstream – Production/Manufacturing/Service Delivery
- 3.6.2.1 Production/Process Overview
- 3.6.2.2 Key Facility Locations & Capacity by Manufacturer
- 3.6.3 Downstream – Distribution & End Consumer
- 3.6.3.1 Primary Channel – B2B/OEM
- 3.6.3.2 Secondary Channels – Dealer, Retail, Online, Direct
- 3.6.4 Value Chain Profitability Analysis
- 3.6.1 Upstream – Raw Material/Input Suppliers
- 3.7 PESTEL Analysis
- 3.7.1 Political Factors
- 3.7.2 Economic Factors
- 3.7.3 Social Factors
- 3.7.4 Technological Factors
- 3.7.5 Environmental Factors
- 3.7.6 Legal Factors
- 3.8 Biohacking Supply Chain Analysis
- 3.8.1 Raw Material/Input Supply Risk Assessment
- 3.8.2 Manufacturing Concentration Risk (Geographic Exposure)
- 3.8.3 Trade Disruption Impact Analysis
- 3.9 Regulatory & Policy Landscape
Note: The regulatory and policy landscape section covers regulations based on their applicability to the market, Biohacking category, geography, and scope of the study. Only regulatory frameworks with a material impact on operations, compliance, trade, sustainability, or market access are analyzed in detail.
Chapter 4. Key Investment Pockets & Opportunity Analysis
- 4.1 Biohacking Market Attractiveness Analysis
- 4.1.1 By Region – Investment Attractiveness Matrix (Volume × CAGR)
- 4.2 Absolute Revenue Growth Opportunity
- 4.2.1 By Region – Absolute USD Growth Through 2032
- 4.3 Incremental Volume Opportunity
- 4.3.1 By Region – Incremental Volume Through 2032
- 4.3.2 Segment – Incremental Volume
- 4.4 Emerging Submarket Opportunity Deep Dive (Subject to Applicability)
- 4.5 Emerging Market Opportunity Scorecards
- 4.5.1 United States
- 4.5.2 Europe
- 4.5.3 Asia
- 4.5.4 Middle East & Africa
Note: Emerging Market Opportunity Scorecards will be included based on relevance and strategic importance. Regions listed are indicative and may vary depending on data availability and market dynamics.
Chapter 5. Biohacking Import-Export Analysis & Trade Flows
- 5.1 Global Trade Overview
- 5.1.1 Global Export Value by Country (2025)
- 5.1.2 Global Export Volume by Country (2025)
- 5.1.3 Global Import Value by Country (2025)
- 5.1.4 Global Import Volume by Country (2025)
- 5.1.5 Net Trade Balance by Country (2025)
- 5.2 Export Analysis – Segment
- 5.2.1 Type 1 (HS Code)
- 5.2.2 Type 2 (HS Code)
- 5.2.3 Type 3 (HS Code)
- 5.2.4 Type 4 (HS Code)
- 5.2.5 Type 5 (HS Code)
- 5.3 Import Analysis – Segment
- 5.3.1 Type 1 (HS Code)
- 5.3.2 Type 2 (HS Code)
- 5.3.3 Type 3 (HS Code)
- 5.3.4 Type 4 (HS Code)
- 5.3.5 Type 5 (HS Code)
- 5.4 Average Unit Trade Prices
- 5.4.1 Average Export Price – Segment & Country
- 5.4.2 Average Import Price – Segment & Source Country
- 5.4.3 Price Trends (2025)
- 5.5 Key Trade Route Analysis
- 5.5.1 Trade Route 1
- 5.5.2 Trade Route 2
- 5.5.3 Trade Route 3
- 5.5.4 Trade Route 4
- 5.5.5 Trade Route 5
- 5.6 Trade Policy Impact Assessment
- 5.6.1 US Anti-Dumping & Section 301 Tariffs
- 5.6.2 EU Customs Union Impact
- 5.6.3 Major Free Trade Agreements
- 5.6.4 USMCA Rules of Origin
Note: Trade policy analysis will be included only where relevant to the Biohacking market.
Chapter 6. Competitive Landscape & Company Benchmarking
- 6.1 Biohacking Market Concentration & Structure
- 6.1.1 Herfindahl-Hirschman Index (HHI) – vs. 2025
- 6.1.2 Tier 1, Tier 2 & Tier 3 Market Structure
- 6.1.3 Global, Regional & Local Player Dynamics
- 6.2 Biohacking Market Share Analysis – 2025
- 6.2.1 Global Revenue Share by Company
- 6.2.2 Global Volume Share by Company
- 6.2.3 Regional Revenue Share
- 6.2.4 Market Share Evolution ( vs. 2025)
- 6.2.5 OEM Segment Share by Company
- 6.2.6 Replacement Segment Share by Company
- 6.3 Production/Delivery Capacity & Facility Analysis
- 6.3.1 Global Installed Capacity
- 6.3.2 Capacity Utilization Rates
- 6.3.3 Production/Output Volume
- 6.3.4 Facility Locations & Capacity Map
- 6.3.5 Planned Capacity Additions
- 6.4 Biohacking Competitive Benchmarking Matrix
- 6.4.1 Revenue, Volume, CAGR & Profitability Comparison
- 6.4.2 Channel Revenue Mix
- 6.4.3 Geographic Revenue Exposure
- 6.4.4 R&D Intensity
- 6.4.5 Sustainability Maturity
- 6.5 Strategic Developments in Biohacking (Last 24 Months)
- 6.5.1 Mergers, Acquisitions & Divestments
- 6.5.2 New Biohacking Launches
- 6.5.3 Facility Expansions
- 6.5.4 Strategic Alliances, Joint Ventures & Partnerships
- 6.5.5 Distribution Expansion & Market Entry
- 6.5.6 Sustainability & ESG Initiatives
- 6.6 Competitive Strategy Mapping
- 6.6.1 Leader, Challenger, Follower & Niche Classification
- 6.6.2 Pricing Strategy Comparison
- 6.6.3 Channel Strategy Matrix
Note: Strategic developments are included based on their materiality and the availability of reliable information.
Chapter 7. Global Biohacking Market – By Distribution Channel
- 7.1 Segment Overview
- 7.1.1 Volume & Revenue Split by Channel (2025 & 2032)
- 7.1.2 Channel Mix Evolution (2025-2032)
Chapter 8. Regional Market Analysis – Global Overview
- 8.1 Global Regional Overview
- 8.1.1 Regional Volume Share
- 8.1.2 Regional Revenue Share
- 8.1.3 Regional Volume by Region
- 8.1.4 Regional Revenue by Region
- 8.1.5 Regional Forecast Through 2032
- 8.2 Cross-Regional Segment Analysis
- 8.2.1 By Distribution Channel
- 8.2.2 By Brand/Price Tier
Chapter 9. North America Biohacking Market
- 9.1 United States
- 9.2 Canada
- 9.3 Mexico
Chapter 10. Europe Biohacking Market
- 10.1 Germany
- 10.2 France
- 10.3 Italy
- 10.4 United Kingdom
- 10.5 Spain
- 10.6 Poland
- 10.7 Russia
- 10.8 Netherlands
- 10.9 Belgium
- 10.10 Sweden
- 10.11 Denmark
- 10.12 Norway
- 10.13 Rest of Europe
Chapter 11. Asia Pacific Biohacking Market
- 11.1 China
- 11.2 India
- 11.3 Japan
- 11.4 South Korea
- 11.5 Thailand
- 11.6 Indonesia
- 11.7 Vietnam
- 11.8 Malaysia
- 11.9 Australia
- 11.10 Rest of Asia Pacific
Chapter 12. Latin America Biohacking Market
- 12.1 Brazil
- 12.2 Argentina
- 12.3 Colombia
- 12.4 Chile
- 12.5 Rest of Latin America
Chapter 13. Middle East Biohacking Market
- 13.1 Saudi Arabia
- 13.2 United Arab Emirates
- 13.3 Turkey
- 13.4 Israel
- 13.5 Iran
- 13.6 Rest of the Middle East
Chapter 14. Africa Biohacking Market
- 14.1 South Africa
- 14.2 Egypt
- 14.3 Nigeria
- 14.4 Morocco
- 14.5 Rest of Africa
Chapter 15. Biohacking Company Profiles
- 15.1 [Company 01]
- 15.1.1 Company Overview
- 15.1.2 Key Management Personnel
- 15.1.3 Products & Services Portfolio
- 15.1.4 Financial Performance
- 15.1.5 Key Market Focus & Geographic Presence
- 15.1.6 Recent Developments & Strategic Initiatives
Note: The company profile list is preliminary and may change based on research findings, market developments, data availability, and client requirements.
Chapter 16. Appendices
- Appendix A – List of Abbreviations & Acronyms
- Appendix B – Industry Classification Code Reference – Full Series
- Appendix C – Production & Capacity Data Tables
- Appendix D – End-Use & Demand Base Tables
- Appendix E – Consumption & Replacement Rate Assumptions
- Appendix F – ASP Reference Tables
- Appendix G – Manufacturing & Facility Database
- Appendix H – Import-Export Data Tables
- Appendix I – Regulatory Summary Tables
- Appendix J – Primary Research Participant List (Anonymized)
- Appendix K – Primary Research Questionnaire Framework
- Appendix L – Data Sources & Bibliography
- Appendix M – Market Size Divergence & Source Comparison
Chapter 17. Research Methodology
- 17.1 Research Framework & Philosophy
- 17.2 Secondary Research – Sources, Hierarchy & Data Extraction
- 17.3 Data Modeling – Bottom-Up & Top-Down Market Sizing
- 17.4 Primary Research – Stakeholder Framework, LOI & Sample Sizes
- 17.5 Forecast Methodology – Regression, Scenario & Sensitivity Analysis
- 17.6 Quality Control – Four-Layer Validation Framework
- 17.7 Limitations & Standard Assumptions
- 17.8 Disclaimer
