Military Wearables Market Overview:
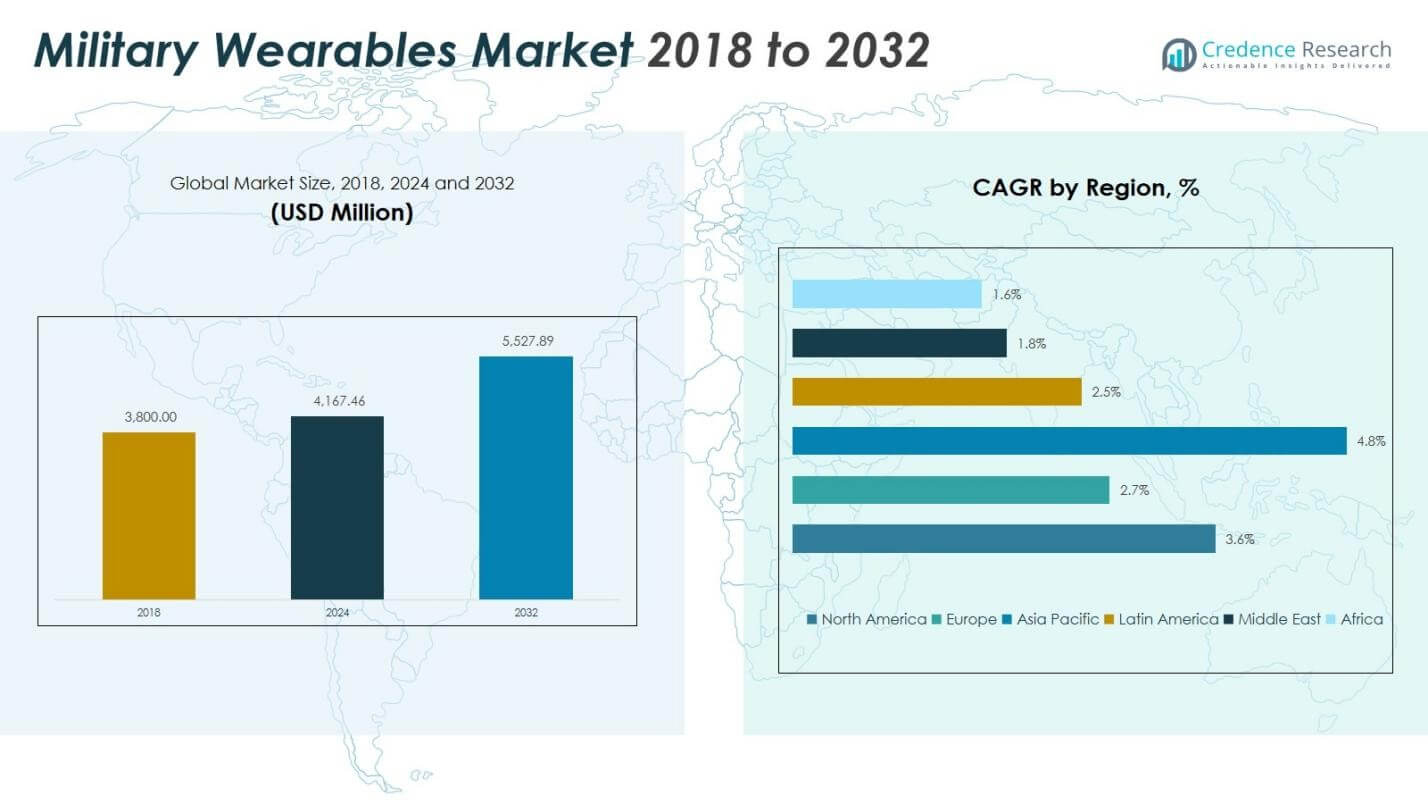
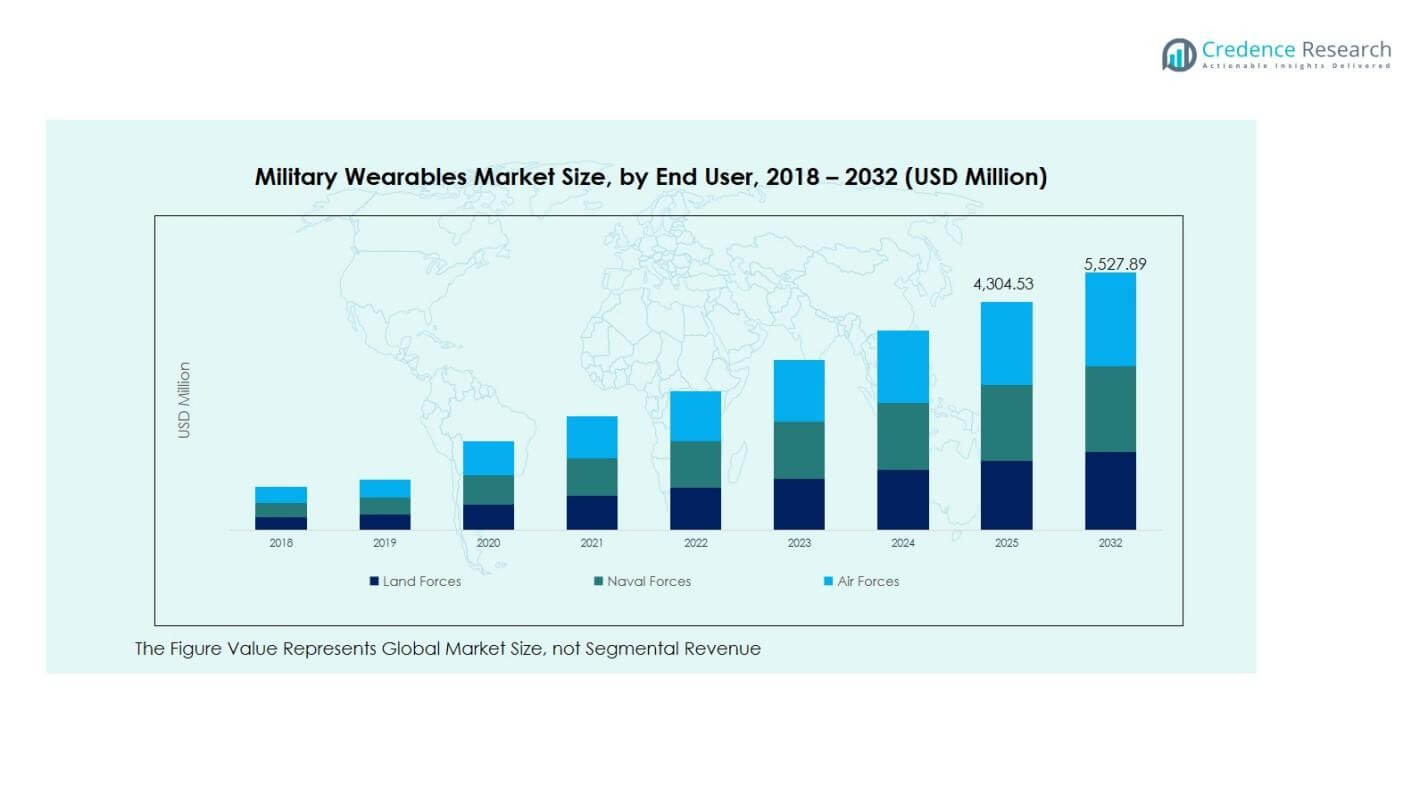
Military Wearables Market size was valued at USD 3,800.00 Million in 2018 and increased to USD 4,167.46 Million in 2024. It is anticipated to reach USD 5,527.89 Million by 2032, at a CAGR of 3.64% during the forecast period.
| REPORT ATTRIBUTE |
DETAILS |
| Historical Period |
2020-2023 |
| Base Year |
2024 |
| Forecast Period |
2025-2032 |
| Military Wearables Market Size 2024 |
USD 4,167.46 million |
| Military Wearables Market, CAGR |
3.64% |
| Military Wearables Market Size 2032 |
USD 5,527.89 million |
Military Wearables Market Insights
- Market overview highlights rising adoption of bodywear and smart headgear systems, with Bodywear holding 34.2% share in 2024 due to its role in mobility, protection, and soldier performance enhancement across modernization programs.
- Market driver includes expanding investment in connected soldier programs, real-time communication systems, and AI-enabled health and surveillance wearables that improve mission readiness, situational awareness, and operational efficiency on the battlefield.
- Markets trends and analysis indicate increasing focus on rugged wearable platforms, sensor-integrated fabrics, and interoperability solutions, with major players such as BAE Systems, Elbit Systems, Lockheed Martin, and L3Harris Technologies advancing product innovation and technology integration.
- Regional analysis shows North America leading with 39.77% share in 2024, followed by Asia Pacific with 28.72% share, while Europe accounted for 20.38% share, driven by modernization strategies and rising deployment of soldier-augmentation wearable solutions.
Military Wearables Market Segmentation Analysis:
By Product
The Military Wearables Market by product segment is led by Bodywear, which accounted for 34.2% market share in 2024, driven by its widespread integration into soldier modernization programs and increasing adoption of smart protective vests, exoskeleton suits, and tactical clothing to enhance mobility, endurance, and survivability. Headgear captured 22.5% share, supported by advancements in helmet-mounted sensors and ballistic safety systems, while Smart Eyewear held 18.7% share due to growing deployment of augmented-reality battlefield visualization tools. Wrist Devices and Headsets collectively represented 24.6% share, driven by soldier health monitoring and mission-critical communication enhancements.
- For instance, Elbit Systems’ X-Sight HMD provides real-time target data overlays for enhanced battlefield visualization, and Thales’ Scorpion HMD equips pilots and ground troops with AR symbology integrated into the visor display.
By Technology
By technology, the market is dominated by Communication Systems, accounting for 29.8% market share in 2024, as defense agencies prioritize secure real-time voice, tactical data exchange, and interoperable communication platforms for network-centric warfare. Imaging & Surveillance followed with 21.6% share, supported by growing use of body-mounted cameras, thermal sensors, and night-vision solutions. Navigation Technologies captured 18.9% share due to rising demand for GPS-enabled positioning and battlefield tracking, while Network & Connectivity held 16.4% share. Intelligent Fabric and Others together recorded 13.3% share, driven by innovations in biometric sensing and integrated health-monitoring textiles.
- For instance, FLIR’s PT-313 thermal imaging camera detects man-sized targets up to 880 meters away, combining thermal and low-light CCD for continuous day-night surveillance in all weather conditions.
By End-User
The Military Wearables Market by end-user is primarily led by Land Forces, which accounted for 52.7% market share in 2024, driven by large-scale infantry modernization programs, increased adoption of connected soldier platforms, and high demand for tactical bodywear, communication gear, and surveillance-enabled wearables. Air Forces represented 26.1% share, supported by the integration of smart headgear, pilot-mounted displays, and physiological monitoring devices for mission safety and situational awareness. Naval Forces accounted for 21.2% share, driven by the deployment of rugged communication wearables, navigation aids, and underwater mission-support systems for maritime operations.
Access crucial information at unmatched prices!
Request your sample report today & start making informed decisions powered by Credence Research Inc.!
Download Sample
Key Growth Drivers
Rising Soldier Modernization and Battlefield Digitization Programs
The Military Wearables Market grows significantly as global defense agencies invest in soldier modernization initiatives that enhance situational awareness, survivability, and mission efficiency. Programs such as integrated soldier systems emphasize lightweight bodywear, smart headgear, tactical communication devices, and health-monitoring wearables to support real-time decision-making in complex combat environments. Governments prioritize digital battlefield transformation, driving large-scale procurement of connected wearable platforms that improve coordination, mobility, and threat response. Continuous upgrades in interoperability, data fusion, and ergonomic design further accelerate adoption, establishing wearable technologies as a core component of next-generation military capability enhancement strategies worldwide.
- For instance, the US Army’s Integrated Visual Augmentation System (IVAS), based on Microsoft HoloLens 2, integrates thermal and low-light imaging sensors with a heads-up display and networked data radio for enhanced situational awareness and target engagement.
Advancements in Sensor Technologies, AI, and Data Analytics Integration
Rapid innovation in miniaturized sensors, artificial intelligence, and data analytics strongly drives market expansion by enabling advanced performance monitoring, predictive maintenance, and mission intelligence capabilities in military wearables. Biometric sensors support continuous tracking of soldier health, fatigue, and stress levels, while embedded motion and environmental sensors enhance navigation, surveillance, and threat detection. AI-enabled wearables facilitate automated data interpretation, faster tactical responses, and improved battlefield readiness. Defense organizations increasingly deploy intelligent wearable systems to analyze physiological, behavioral, and operational data, helping commanders optimize resource planning, mission safety, and combat effectiveness across diverse operational scenarios.
- For instance, BAE Systems has demonstrated wearable sensor arrays that track movement and environmental factors to improve situational awareness and threat response in complex terrains.
Increasing Focus on Soldier Safety, Survivability, and Operational Readiness
Growing emphasis on troop safety, survivability, and operational resilience remains a key growth catalyst for the Military Wearables Market. Wearables such as ballistic smart fabrics, thermal protection suits, exoskeleton-assisted bodywear, and integrated communication headgear enhance physical endurance and reduce injury risks during high-intensity missions. Health-monitoring wrist devices and fatigue-tracking systems support early risk detection and performance stabilization in extreme environments. Defense forces adopt wearable technologies to ensure continuous soldier readiness, mission sustainability, and rapid medical response capabilities, reinforcing the strategic value of protective, performance-enhancing wearable platforms in modern military operations.
Key Trends & Opportunities
Expansion of Network-Centric Warfare and IoT-Enabled Connected Soldier Ecosystems
A major trend shaping the Military Wearables Market is the transition toward network-centric warfare, where wearables operate as integrated nodes within IoT-enabled soldier communication ecosystems. Connected headgear, body-mounted sensors, and smart eyewear support seamless data exchange across units, vehicles, drones, and command centers. This connectivity enhances real-time tracking, coordinated movement, and precision targeting during mission execution. Opportunities emerge for manufacturers developing interoperable, cloud-linked wearable architectures with encrypted communication and edge-processing capabilities. The growing defense shift toward collaborative, data-driven battlefield environments continues to expand demand for scalable, secure, and network-enabled wearable solutions.
- For instance, Microsoft’s Integrated Visual Augmentation System (IVAS) headsets, integrated with Anduril’s Lattice AI platform, enable soldiers to receive real-time warnings of airborne threats detected by sensors.
Emergence of Lightweight Exoskeletons and Intelligent Performance-Enhancing Bodywear
Another key trend involves the development of lightweight military exoskeletons and intelligent bodywear designed to boost mobility, load-bearing efficiency, and endurance. Advances in flexible materials, battery systems, and biomechanics enable wearable exoskeleton platforms suitable for logistics, infantry movement, and tactical field operations. Smart textiles embedded with biometric and environmental sensors create new opportunities for adaptive protection, temperature regulation, and energy-harvesting capabilities. As armed forces prioritize soldier wellness and mission sustainability, the market experiences rising interest in modular, ergonomic, and energy-efficient performance-enhancement wearables that support both combat and support personnel across diverse operating conditions.
- For instance, Lockheed Martin’s ONYX exoskeleton uses powered knee actuators and sensors to reduce muscle fatigue by over 15% during load-bearing activities, aiding soldier mobility in rugged terrains.
Key Challenges
Power Management, Device Durability, and Integration Complexity Constraints
The Military Wearables Market faces challenges related to battery life, ruggedness, and seamless integration with existing defense systems. High-performance wearables require continuous power for sensors, communication modules, and analytics functions, yet extended battery solutions remain weight-sensitive and costly. Harsh battlefield environments demand durable, shock-resistant designs capable of withstanding heat, moisture, and impact stress. Interoperability with radios, vehicles, and command networks also introduces integration complexity and cybersecurity risks. These technical constraints increase development cycles and procurement costs, limiting large-scale deployment in certain regions and mission categories despite strong operational demand.
High Procurement Costs, Budget Constraints, and Standardization Limitations
Another major challenge arises from high acquisition and lifecycle costs associated with advanced wearable technologies, particularly in emerging defense economies with limited modernization budgets. Procurement decisions must balance affordability, training requirements, and maintenance infrastructure, often slowing adoption of next-generation wearable platforms. The absence of universal standards for system compatibility, data security, and performance benchmarking further complicates vendor selection and deployment consistency across units. Variations in defense procurement frameworks, regulatory policies, and technology readiness levels create additional barriers, restricting uniform integration of wearable solutions across international military forces.
Regional Analysis
North America
North America dominated the Military Wearables Market in 2024 with a 39.77% market share, supported by strong defense modernization programs and early adoption of connected soldier technologies. The regional market increased from USD 1,527.98 Million in 2018 to USD 1,657.37 Million in 2024, and it is projected to reach USD 2,195.69 Million by 2032 at a CAGR of 3.6%. Growth is driven by large-scale investments in bodywear, tactical communication systems, and surveillance-enabled wearable platforms across the U.S. and Canada, reinforcing the region’s leadership in mission-ready military technology deployment.
Europe
Europe accounted for 20.38% market share in 2024, reflecting steady defense digitization initiatives and rising adoption of soldier-support wearables in NATO countries. The regional market grew from USD 813.20 Million in 2018 to USD 849.21 Million in 2024, and it is expected to reach USD 1,048.93 Million by 2032 at a CAGR of 2.7%. Growth is supported by investments in smart headgear, communication wearables, and physiological monitoring systems, particularly in Germany, France, and the UK. Ongoing troop protection programs and modernization of tactical equipment continue to strengthen wearable deployment across European defense organizations.
Asia Pacific
Asia Pacific represented 28.72% market share in 2024, emerging as one of the fastest-growing regions due to expanding defense budgets and soldier-augmentation initiatives in China, India, South Korea, and Japan. The market rose from USD 1,050.32 Million in 2018 to USD 1,197.08 Million in 2024, and it is anticipated to reach USD 1,734.10 Million by 2032 at a CAGR of 4.8%. Growth is driven by large infantry modernization programs, increasing demand for bodywear and surveillance wearables, and accelerated adoption of communication and navigation-enabled soldier platforms to enhance operational readiness across diverse terrain environments.
Latin America
Latin America accounted for 5.20% market share in 2024, with gradual adoption of wearable technologies across border security, patrol units, and paramilitary defense operations. The market increased from USD 199.88 Million in 2018 to USD 216.67 Million in 2024, and it is projected to reach USD 262.41 Million by 2032 at a CAGR of 2.5%. Growth is supported by rising investments in communication headsets, tactical wrist devices, and surveillance wearables, particularly in Brazil and Mexico. However, budget constraints and slower procurement cycles moderate large-scale deployment compared to advanced defense economies.
Middle East
The Middle East contributed 2.65% market share in 2024, reflecting selective but strategic adoption of military wearables across specialized combat and border-security units. The regional market moved from USD 109.82 Million in 2018 to USD 110.41 Million in 2024, and it is expected to reach USD 127.17 Million by 2032 at a CAGR of 1.8%. Demand is driven by surveillance-enabled bodywear, communication systems, and situational-awareness wearables in Gulf Cooperation Council countries. Modernization programs continue to advance, although deployment remains concentrated in high-priority mission and security applications.
Africa
Africa held 3.28% market share in 2024, supported by gradual defense modernization efforts and rising procurement of wearable systems for peacekeeping and border-control operations. The market increased from USD 98.80 Million in 2018 to USD 136.71 Million in 2024, and it is forecast to reach USD 159.59 Million by 2032 at a CAGR of 1.6%. Growth is primarily driven by investments in communication wearables, tactical wrist devices, and basic surveillance equipment. However, limited defense budgets and infrastructure constraints continue to restrict widespread deployment across several African nations.
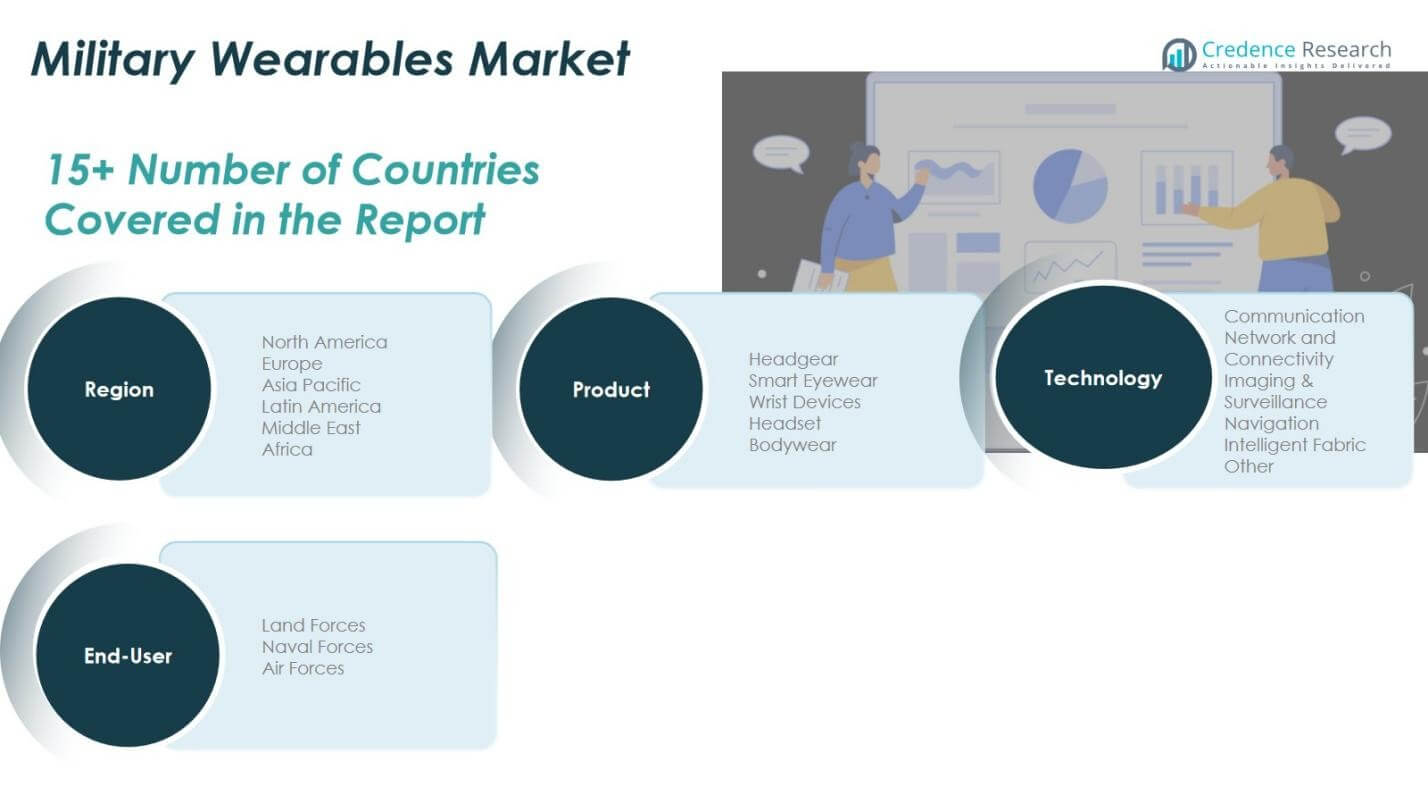
Military Wearables Market Segmentations:
By Product
- Headgear
- Smart Eyewear
- Wrist Devices
- Headset
- Bodywear
By Technology
- Communication
- Network & Connectivity
- Imaging & Surveillance
- Navigation
- Intelligent Fabric
- Others
By End-User
- Land Forces
- Naval Forces
- Air Forces
By Geography
- North America
- Europe
- Germany
- France
- U.K.
- Italy
- Spain
- Rest of Europe
- Asia Pacific
- China
- Japan
- India
- South Korea
- South-east Asia
- Rest of Asia Pacific
- Latin America
- Brazil
- Argentina
- Rest of Latin America
- Middle East & Africa
- GCC Countries
- South Africa
- Rest of the Middle East and Africa
Competitive Landscape
Competitive landscape in the Military Wearables Market is shaped by leading players including BAE Systems, Elbit Systems, Rheinmetall, Aselsan, Garmin, Lockheed Martin, Honeywell International Inc., L3Harris Technologies Inc., and Leonardo S.p.A. The market features a balanced mix of established defense manufacturers and technology innovators that focus on soldier modernization, connected battlefield ecosystems, and performance-enhancing wearable platforms. Companies compete on product reliability, rugged design, communication interoperability, and integration of AI-driven analytics and sensor technologies into bodywear, headgear, and surveillance-enabled devices. Strategic priorities include long-term defense contracts, cross-border partnerships, and continuous R&D investment to expand intelligent fabrics, biometric monitoring systems, and network-centric soldier solutions. Vendors increasingly emphasize modular product architectures, cybersecurity-enabled communication wearables, and power-efficient platforms to meet operational durability and mission-readiness requirements. As military forces worldwide accelerate digitization and tactical mobility programs, competition intensifies around innovation leadership, lifecycle support capabilities, and the ability to deliver scalable, mission-configured wearable systems across varied combat and security environments.
Shape Your Report to Specific Countries or Regions & Enjoy 30% Off!
Key Player Analysis
- BAE Systems
- Elbit Systems
- Rheinmetall
- Aselsan
- Garmin
- Lockheed Martin
- Honeywell International Inc.
- L3Harris Technologies Inc.
- Leonardo S.p.A.
Recent Developments
- In May 2025, Meta Platforms Inc. partnered with Anduril Industries Inc. to develop wearable devices for the U.S. military, aiming to enhance soldier-worn technology and battlefield situational awareness capabilities.
- In February 2025, Microsoft partnered with Anduril Industries to advance the Integrated Visual Augmentation System (IVAS) augmented reality headset development for U.S. Army wearable applications.
- In July 2025, MyDefence secured a contract to supply the U.S. Army with over 400 wearable counter-drone systems, expanding deployment of wearable electronic threat-detection gear.
Report Coverage
The research report offers an in-depth analysis based on Product, Technology, End User and Geography. It details leading market players, providing an overview of their business, product offerings, investments, revenue streams, and key applications. Additionally, the report includes insights into the competitive environment, SWOT analysis, current market trends, as well as the primary drivers and constraints. Furthermore, it discusses various factors that have driven market expansion in recent years. The report also explores market dynamics, regulatory scenarios, and technological advancements that are shaping the industry. It assesses the impact of external factors and global economic changes on market growth. Lastly, it provides strategic recommendations for new entrants and established companies to navigate the complexities of the market.
Future Outlook
- The market will expand as defense agencies increase investments in soldier modernization and connected combat systems.
- Adoption of AI-enabled wearables will rise to enhance real-time decision-making, health monitoring, and mission analytics.
- Lightweight exoskeletons and performance-enhancing bodywear will gain traction to improve endurance and mobility in field operations.
- Demand for secure communication wearables will grow as network-centric warfare and data-driven operations intensify.
- Integration of smart textiles and intelligent fabrics will strengthen protection, comfort, and biometric sensing capabilities.
- Cross-platform interoperability will become a priority to enable seamless connectivity across units, vehicles, and command networks.
- Defense forces will increasingly adopt energy-efficient and long-duration power solutions for continuous wearable device operation.
- Procurement programs will emphasize ruggedized and combat-ready designs suitable for extreme environmental conditions.
- Collaborative development between defense contractors and technology firms will accelerate innovation in wearable ecosystems.
- Emerging regions will experience rising adoption as modernization budgets expand and tactical digitization initiatives progress.


