Home » Semiconductor & Electronics » Occupancy Sensor Market

Occupancy Sensor Market By Operation (Indoor, Outdoor); By Technology (Passive Infrared (PIR), Ultrasonic, Dual Technology, Microwave, Others); By Building Type (Residential, Commercial, Industrial); By Application (Lighting Systems, HVAC Systems, Security and Surveillance, Others); By Network Connectivity (Wired Network, Wireless Network, Hybrid) – Growth, Share, Opportunities & Competitive Analysis, 2024 – 2032

Report ID: 106921 | Report Format : Excel, PDF
REPORT ATTRIBUTE DETAILS
Historical Period 2020-2023
Base Year 2024
Forecast Period 2025-2032
Occupancy Sensor Market Size 2024 USD 2,919.25 million
Occupancy Sensor Market, CAGR 10.69%
Occupancy Sensor Market Size 2032 USD 6,961.71 million

Market Overview:

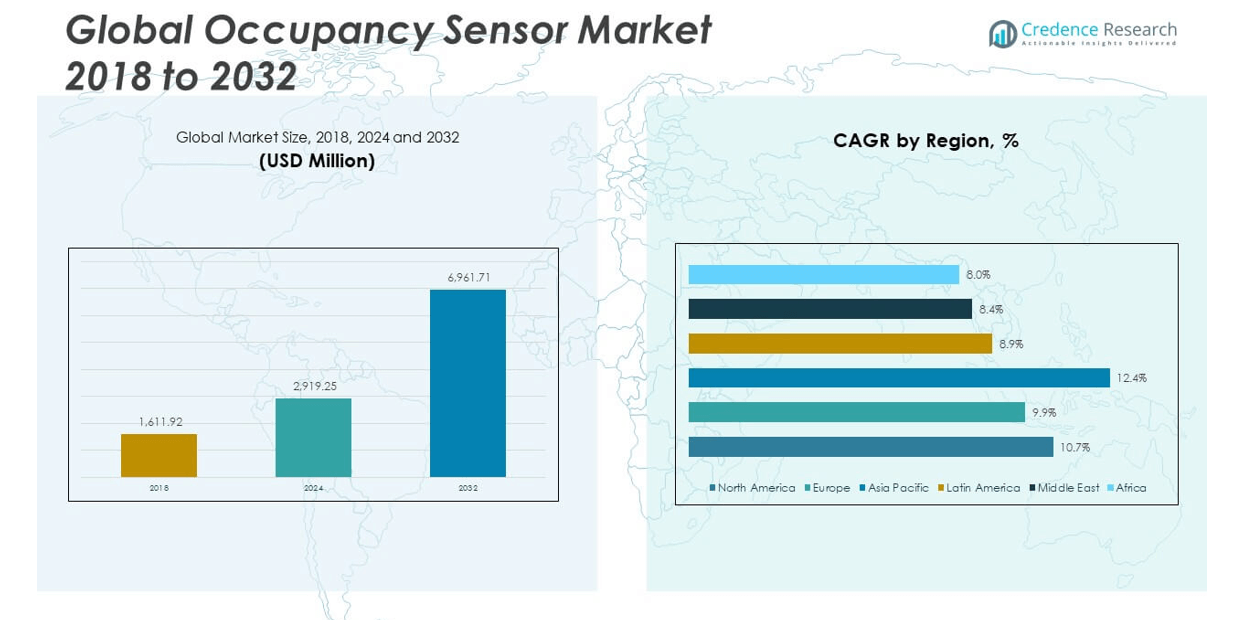
The Global Occupancy Sensor Market size was valued at USD 1,611.92 million in 2018 to USD 2,919.25 million in 2024 and is anticipated to reach USD 6,961.71 million by 2032, at a CAGR of 10.69% during the forecast period.

The global occupancy sensor market is primarily driven by the growing emphasis on energy efficiency across commercial, residential, and industrial sectors. As smart buildings and automation systems become more prevalent, occupancy sensors play a critical role in minimizing energy consumption by enabling intelligent control of lighting, HVAC, and security systems. Regulatory bodies across the U.S., European Union, and Asia-Pacific have introduced stringent building codes and energy-efficiency mandates, prompting widespread adoption of occupancy-based solutions. Technological advancements in infrared, ultrasonic, and dual-technology sensors have improved detection accuracy, response times, and integration capabilities with IoT platforms. Furthermore, the increasing use of artificial intelligence (AI) and machine learning algorithms in building management systems enhances real-time data analysis for space utilization and energy optimization. The rising demand for contactless and automated solutions in public infrastructure, especially in the wake of hygiene concerns post-pandemic, further boosts the market. Growing investments in smart city initiatives and sustainable infrastructure projects globally continue to fuel demand for occupancy sensors in lighting, ventilation, and energy management applications.

Regionally, North America holds the largest share of the global occupancy sensor market, driven by strong regulatory frameworks, early adoption of smart building technologies, and increased energy-saving initiatives across the United States and Canada. The U.S., in particular, benefits from government support for green buildings and advanced infrastructure for smart energy systems. Europe follows closely, with countries like Germany, the United Kingdom, and France actively implementing energy directives and modernizing legacy systems in both residential and commercial buildings. Meanwhile, the Asia-Pacific region is expected to witness the fastest growth during the forecast period, fueled by rapid urbanization, expanding industrialization, and aggressive investment in smart cities and energy-efficient buildings across China, India, Japan, and Southeast Asia. Technological advancements and growing awareness of sustainable practices in these countries support widespread adoption. Latin America and the Middle East & Africa are emerging markets in this domain, with increasing investments in smart infrastructure, construction, and energy management systems indicating strong potential for long-term growth.

Occupancy Sensor Market size

Market Insights:

  • The Global Occupancy Sensor Market grew from USD 1,611.92 million in 2018 to USD 2,919.25 million in 2024 and is projected to reach USD 6,961.71 million by 2032, expanding at a CAGR of 10.69%.
  • Rising emphasis on energy efficiency and government-enforced building codes is driving large-scale adoption of occupancy sensors across commercial, residential, and industrial facilities.
  • Advancements in infrared, ultrasonic, dual-technology, and AI-powered sensors are enhancing accuracy, detection speed, and integration with smart building systems.
  • Post-pandemic demand for contactless solutions in public infrastructure has increased deployment of occupancy sensors in restrooms, transit hubs, and office entryways.
  • Integration with IoT and wireless protocols such as Zigbee and LoRa enables real-time monitoring and control, supporting the growth of connected buildings.
  • Performance challenges persist in high-interference environments, requiring sensor design improvements and better adaptability to complex spatial layouts.
  • Regionally, North America leads the market share due to early smart building adoption, while Asia Pacific is the fastest-growing region, fueled by smart city investments and rising energy demands.

Access crucial information at unmatched prices!

Request your sample report today & start making informed decisions powered by Credence Research Inc.!

Download Sample

Market Drivers:

Rising Emphasis on Energy Efficiency and Smart Building Integration

Energy efficiency mandates and sustainability goals are key forces behind the growth of the Global Occupancy Sensor Market. Governments and regulatory agencies worldwide are enforcing stringent energy codes for residential and commercial buildings, prompting the adoption of occupancy-based lighting and HVAC control systems. These sensors significantly reduce electricity consumption by detecting human presence and automatically managing systems. The integration of occupancy sensors into building automation systems ensures cost savings and operational efficiency. With increased focus on net-zero energy buildings and LEED certifications, these sensors are becoming standard components in new construction projects. The Global Occupancy Sensor Market benefits from the push toward intelligent infrastructure and smarter energy consumption practices.

  • For example, Lutron Electronics’ Vive wireless system integrates passive infrared (PIR) sensors that not only detect occupancy but also dynamically adjust lighting according to daylight availability, leading to measurable reductions in power consumption.

Expansion of IoT and Wireless Communication Technologies Across Facilities

The development of wireless communication technologies has transformed the performance and accessibility of occupancy sensors. Integration with IoT platforms enables centralized monitoring, remote access, and seamless control of multiple devices. These advancements support real-time occupancy tracking and enhance system responsiveness in dynamic environments such as offices, retail stores, and hospitals. The market benefits from protocols such as Zigbee, Z-Wave, and LoRa, which simplify installation and reduce infrastructure costs. Occupancy sensors are now core components in facility management systems that rely on automation and data analytics. This shift strengthens demand for compact, interoperable sensors across a range of end-use industries.

  • For instance, Pressac’s wireless room occupancy sensors utilize passive infrared technology to detect motion within a 360-degree field of view up to 6 meters, transmitting real-time presence data via the EnOcean wireless protocol.

Adoption of AI-Based Analytics and Predictive Controls in Commercial Spaces

Artificial intelligence is revolutionizing the functionality of occupancy sensors by enhancing data interpretation and system intelligence. In commercial environments, sensors equipped with AI algorithms enable predictive control of lighting, ventilation, and security systems based on learned usage patterns. This not only improves occupant comfort but also ensures optimal energy performance throughout the facility. It supports data-driven decisions in workspace management and operational planning. The Global Occupancy Sensor Market is advancing rapidly due to the deployment of intelligent sensors that align with the evolving needs of smart cities and connected infrastructure. These solutions are increasingly valuable in large-scale enterprises, educational campuses, and healthcare centers.

Growth of Contactless Technologies in Post-Pandemic Infrastructure Design

The increased demand for hygienic, touch-free solutions has accelerated interest in occupancy sensors across multiple sectors. Building operators are prioritizing automation to minimize physical contact and enhance occupant safety. Occupancy sensors enable contactless control of doors, lighting, and restroom utilities, helping facilities meet health and safety standards. Public infrastructure such as airports, transit hubs, and government offices are adopting these technologies to ensure safer environments. It supports compliance with workplace guidelines and reduces dependence on manual operations. The expanding role of contactless systems in smart infrastructure contributes to the broader growth of occupancy sensors globally.

Market Trends:

Emergence of Multi-Sensor Fusion Technologies for Enhanced Accuracy

Advanced occupancy sensors are increasingly adopting multi-sensor fusion technologies that combine data from infrared, ultrasonic, microwave, and image recognition systems. This approach improves detection accuracy in complex environments by minimizing false triggers and enhancing responsiveness. Multi-sensor designs are gaining traction in high-traffic public areas, where variations in lighting, noise, and movement require more refined sensing. Manufacturers are developing integrated units that adjust to changing ambient conditions and deliver real-time data with higher reliability. The Global Occupancy Sensor Market is witnessing a transition from single-technology sensors to hybrid platforms that support diverse applications. It reflects a broader shift toward intelligent sensing systems that prioritize precision and adaptability.

Integration of LiDAR and 3D Imaging for Spatial Awareness

LiDAR and 3D imaging technologies are making inroads into occupancy sensing, offering advanced spatial recognition and real-time mapping capabilities. These technologies enable sensors to detect not only motion but also object size, count, and positioning within a space. This advancement allows for differentiated responses in areas like meeting rooms, classrooms, and retail zones, where occupancy density and layout vary. LiDAR-based sensors are becoming valuable in managing space utilization and people flow in large facilities. The integration of 3D imaging enhances sensor functionality in dynamic environments and supports predictive modeling. The Global Occupancy Sensor Market is evolving to include more sophisticated spatial analysis tools that go beyond traditional motion detection.

  • For example, Ommatidia LiDAR’s Q-Series Laser RADARdemonstrates a leap in spatial awareness, integrating parallel LiDAR with 3D imaging and vibrometry. The system generates high-density point clouds with a spatial resolution of up to 1 mm and captures vibration data at up to 10 kHz, enabling real-time monitoring of object count, size, and precise positioning.

Growing Use of Edge Computing in Occupancy Sensing Solutions

Edge computing is reshaping occupancy sensing by enabling local data processing directly within the sensor or nearby gateways. This reduces latency, increases data security, and improves system responsiveness in real-time applications. Edge-enabled sensors operate efficiently without relying on constant cloud connectivity, making them ideal for critical infrastructure and remote environments. The trend supports decentralized building automation where immediate decision-making is essential. In the Global Occupancy Sensor Market, edge computing is opening new possibilities for smart lighting, emergency response, and environmental control systems. It empowers facilities to maintain performance and security while reducing dependence on centralized data centers.

  • For instance, Edge-enabled occupancy sensors from companies like GAO Tek and deployments by major hotel chains (e.g., Marriott, Hilton) process data locally, reducing latency to under 50 milliseconds for real-time applications. These systems analyze occupancy, environmental, and equipment data at the edge, enabling immediate adjustments to lighting and HVAC controls.

Adoption of Battery-Free and Energy-Harvesting Sensor Designs

Battery-free and energy-harvesting technologies are gaining popularity in occupancy sensors, driven by demand for low-maintenance and sustainable solutions. These sensors generate power through kinetic, thermal, or solar energy, eliminating the need for frequent battery replacements. This trend is particularly relevant in large-scale installations and retrofitting projects where wiring or maintenance access is limited. Manufacturers are investing in self-powered sensor platforms that align with green building standards and long-term cost efficiency. It helps reduce operational disruption and supports continuous sensing in distributed networks. The Global Occupancy Sensor Market is embracing these innovations to support environmental goals and streamline infrastructure deployment.

Market Challenges Analysis:

Integration Complexities Across Diverse Building Environments and Legacy Systems

One of the key challenges facing the Global Occupancy Sensor Market is the difficulty of integrating new sensor technologies into existing building infrastructures and legacy systems. Many older facilities lack standardized wiring, communication protocols, or centralized control systems, making sensor deployment technically complex and costly. Compatibility issues arise when occupancy sensors must interface with varied lighting, HVAC, or automation platforms. Facility managers often delay adoption due to concerns over installation downtime, retrofit expenses, or disruption to daily operations. In commercial buildings with multiple vendors and platforms, seamless interoperability remains limited. It hampers large-scale implementation and limits the benefits of sensor-based energy management.

Performance Limitations in Dynamic and High-Interference Environments

Occupancy sensors often face detection inaccuracies in environments with fluctuating temperatures, noise levels, or unpredictable motion patterns. High ceilings, partitioned spaces, and areas with reflective surfaces can interfere with signal transmission or motion recognition, leading to false positives or missed occupancy detection. These limitations reduce reliability in settings like warehouses, hospitals, or open-plan offices where user movement is irregular. The Global Occupancy Sensor Market continues to grapple with fine-tuning sensor algorithms and hardware design to overcome such conditions. It requires ongoing R&D investments and customization to ensure consistent performance. Manufacturers must also address user concerns regarding privacy, especially with image-based and AI-enabled sensors in sensitive spaces.

Market Opportunities:

Rising Demand for Smart Cities and Intelligent Infrastructure Deployment

The growing global investment in smart cities presents a significant opportunity for the Global Occupancy Sensor Market. Governments and urban planners are prioritizing intelligent infrastructure that improves energy efficiency, public safety, and traffic management. Occupancy sensors play a critical role in smart lighting, automated public buildings, and transportation hubs. Their ability to provide real-time data supports responsive systems that adapt to human presence and activity levels. It positions occupancy sensors as essential tools in the urban digital transformation agenda. Demand is expected to accelerate as cities expand their adoption of data-driven solutions.

Expansion Across Emerging Markets and Untapped Commercial Sectors

Emerging economies in Asia Pacific, Latin America, and the Middle East offer strong growth potential due to rapid urbanization and rising infrastructure spending. Commercial sectors such as retail, hospitality, and healthcare are beginning to adopt sensor-based automation to enhance customer experience and operational efficiency. The Global Occupancy Sensor Market can leverage this demand by offering scalable, cost-effective, and wireless solutions suited for diverse building types. It also benefits from increasing awareness of energy savings and sustainability in these regions. Local manufacturing partnerships and supportive government policies can accelerate adoption and drive long-term market expansion.

Market Segmentation Analysis:

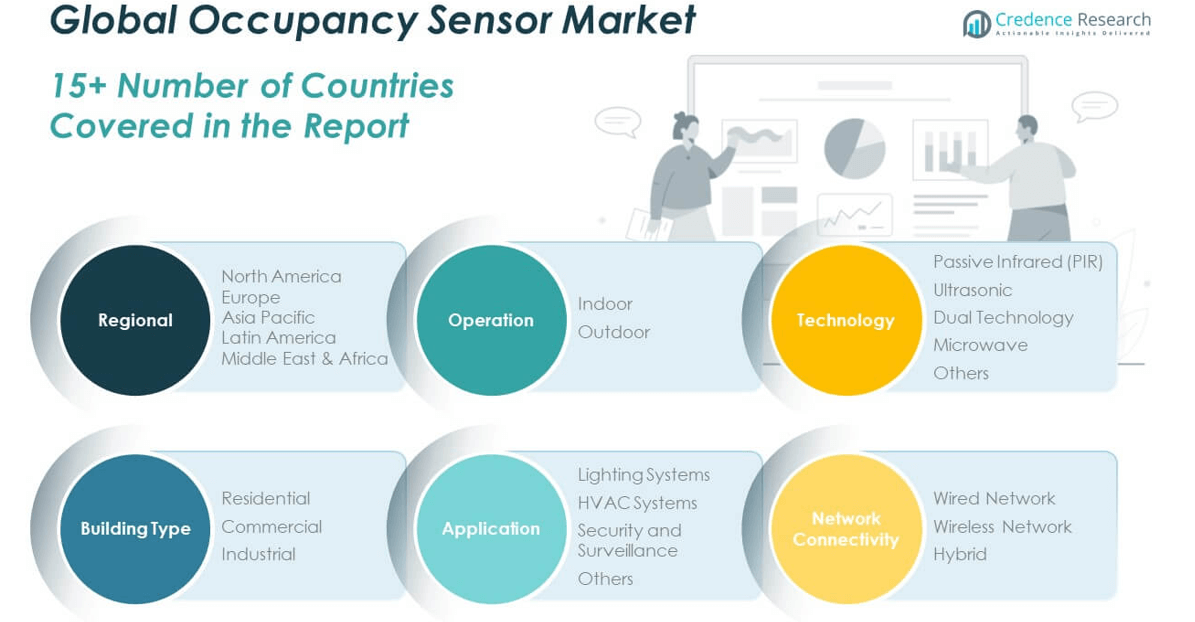
The Global Occupancy Sensor Market is segmented by operation, technology, building type, application, and network connectivity, each contributing to its growth trajectory.

By operation, the indoor segment holds a dominant share due to high adoption in offices, retail spaces, and residential buildings, while the outdoor segment is expanding in smart city and security applications.

  • For instance, Signify’s Interact Officeplatform is widely deployed in office buildings and retail spaces. It uses integrated occupancy sensors to automate lighting and HVAC, reporting energy savings of up to 80% in large office installations.

 By technology, passive infrared (PIR) sensors lead due to cost efficiency and simplicity, followed by ultrasonic and dual technology sensors that offer enhanced accuracy. Microwave sensors are gaining traction in complex environments, while the “others” category includes emerging sensor technologies.

  • For example, Honeywell’s IS3000 Seriespassive infrared sensors are used globally in commercial and residential buildings for cost-effective motion detection, with documented installation in over 10 million sites.

By building type, the commercial segment dominates market share due to widespread use in corporate buildings, malls, and healthcare facilities. The residential segment is growing steadily with the rise of smart homes, and the industrial segment shows potential in automation and safety applications.

By application, lighting systems hold the largest share, with increasing demand for automated energy-saving solutions. HVAC systems and security and surveillance applications also see rising integration of occupancy sensors.

By network connectivity, wireless solutions are gaining preference due to flexibility and ease of installation, while wired networks retain relevance in large-scale commercial projects. Hybrid systems combine both for improved reliability. The Global Occupancy Sensor Market continues to evolve as adoption increases across all segments.

Occupancy Sensor Market segentation

Shape Your Report to Specific Countries or Regions & Enjoy 30% Off!

Segmentation:

By Operation:

  • Indoor
  • Outdoor

By Technology:

  • Passive Infrared (PIR)
  • Ultrasonic
  • Dual Technology
  • Microwave
  • Others

By Building Type:

  • Residential
  • Commercial
  • Industrial

By Application:

  • Lighting Systems
  • HVAC Systems
  • Security and Surveillance
  • Others

By Network Connectivity:

  • Wired Network
  • Wireless Network
  • Hybrid

By Region:

  • North America
    • U.S.
    • Canada
    • Mexico
  • Europe
    • Germany
    • France
    • U.K.
    • Italy
    • Spain
    • Rest of Europe
  • Asia Pacific
    • China
    • Japan
    • India
    • South Korea
    • South-east Asia
    • Rest of Asia Pacific
  • Latin America
    • Brazil
    • Argentina
    • Rest of Latin America
  • Middle East & Africa
    • GCC Countries
    • South Africa
    • Rest of the Middle East and Africa

Regional Analysis:

North America Occupancy Sensor Market

The North America Occupancy Sensor Market size was valued at USD 670.94 million in 2018 to USD 1,201.85 million in 2024 and is anticipated to reach USD 2,874.48 million by 2032, at a CAGR of 10.7% during the forecast period. North America holds the largest share of the Global Occupancy Sensor Market, accounting for approximately 38.7% of the global revenue in 2024. Strong regulatory frameworks, advanced infrastructure, and early adoption of smart building technologies drive regional dominance. The U.S. leads due to federal energy efficiency mandates, widespread integration of occupancy sensors in commercial real estate, and ongoing investments in building automation. Market growth is supported by favorable policies like the Inflation Reduction Act and Energy Star certifications, which encourage smart lighting and HVAC systems. It benefits from a high concentration of manufacturers, system integrators, and smart city projects focused on sustainability and automation.

Europe Occupancy Sensor Market

The Europe Occupancy Sensor Market size was valued at USD 479.29 million in 2018 to USD 838.15 million in 2024 and is anticipated to reach USD 1,887.41 million by 2032, at a CAGR of 9.9% during the forecast period. Europe contributes roughly 27% of the Global Occupancy Sensor Market in 2024, driven by rising energy conservation initiatives and strict building regulations such as the EU Energy Performance of Buildings Directive. Countries like Germany, the UK, and France are adopting smart technologies in residential and commercial sectors to meet sustainability targets. High penetration of green building certifications and government incentives is boosting the deployment of occupancy-based controls. It gains traction in retrofitting older infrastructure, with emphasis on automation and efficient energy use. Demand from healthcare, hospitality, and transportation sectors is also contributing to steady growth across the region.

Asia Pacific Occupancy Sensor Market

The Asia Pacific Occupancy Sensor Market size was valued at USD 314.70 million in 2018 to USD 617.03 million in 2024 and is anticipated to reach USD 1,663.88 million by 2032, at a CAGR of 12.4% during the forecast period. Asia Pacific holds nearly 19.9% of the Global Occupancy Sensor Market in 2024 and is the fastest-growing region. Rapid urbanization, expanding infrastructure, and increased investment in smart city development across China, India, Japan, and Southeast Asia are driving demand. Governments in the region are prioritizing energy efficiency and intelligent building standards to manage rising energy needs. The construction of commercial office buildings, metro rail stations, airports, and data centers is fueling sensor deployment. It benefits from rising awareness of automation and the growing middle-class population demanding smart living solutions.

Latin America Occupancy Sensor Market

The Latin America Occupancy Sensor Market size was valued at USD 72.91 million in 2018 to USD 130.32 million in 2024 and is anticipated to reach USD 273.48 million by 2032, at a CAGR of 8.9% during the forecast period. Latin America accounts for approximately 4.2% of the Global Occupancy Sensor Market in 2024. Countries such as Brazil, Mexico, and Chile are investing in modernizing infrastructure and adopting energy-saving technologies. Market growth is supported by the development of commercial real estate, hospitality, and public infrastructure projects that require automated lighting and climate control. It faces challenges in affordability and awareness, but improving regulatory frameworks and private sector participation are accelerating sensor integration. Demand is expected to rise steadily with increased focus on building safety and efficiency.

Middle East Occupancy Sensor Market

The Middle East Occupancy Sensor Market size was valued at USD 45.33 million in 2018 to USD 75.06 million in 2024 and is anticipated to reach USD 151.16 million by 2032, at a CAGR of 8.4% during the forecast period. The Middle East holds a 2.4% share of the Global Occupancy Sensor Market in 2024, driven by smart city initiatives in the UAE, Saudi Arabia, and Qatar. Governments are investing heavily in intelligent infrastructure as part of economic diversification plans. The use of occupancy sensors is increasing in airports, hotels, and large public buildings, where energy optimization and modern design standards are a priority. It is also benefiting from rising demand for sustainable cooling and lighting in extreme climate conditions. Growth is reinforced by collaborations between public institutions and technology providers.

Africa Occupancy Sensor Market

The Africa Occupancy Sensor Market size was valued at USD 28.77 million in 2018 to USD 56.83 million in 2024 and is anticipated to reach USD 111.30 million by 2032, at a CAGR of 8.0% during the forecast period. Africa represents approximately 1.8% of the Global Occupancy Sensor Market in 2024. The region is in the early phase of adoption, with market activity concentrated in South Africa, Nigeria, Kenya, and Egypt. Rising urban population, improving access to electricity, and growing awareness of energy conservation are driving demand. It is gaining momentum through donor-backed smart grid and green building projects. Despite infrastructural limitations, commercial and institutional developments are gradually incorporating automated systems. The long-term outlook remains positive with increasing focus on sustainable urban planning.

Key Player Analysis:

  • Signify N.V. (Philips Lighting)
  • Legrand S.A.
  • Schneider Electric
  • Johnson Controls International plc
  • Honeywell International Inc.
  • Eaton Corporation plc
  • Acuity Brands, Inc

Competitive Analysis:

The Global Occupancy Sensor Market is highly competitive, driven by rapid technological advancements and growing demand for smart building solutions. Key players include Honeywell International Inc., Legrand SA, Johnson Controls, Schneider Electric, Signify N.V., and Texas Instruments Incorporated. These companies focus on expanding product portfolios, enhancing sensor accuracy, and integrating IoT and AI technologies. Strategic partnerships, mergers, and acquisitions are common, aimed at strengthening market presence and accelerating innovation. Startups and regional players are entering the market with cost-effective and energy-efficient solutions, intensifying competition across segments. It is witnessing increased investment in R&D to develop multi-sensor platforms and wireless connectivity features. Price competitiveness and compliance with regional energy efficiency standards remain critical factors for sustained growth. Companies that can deliver reliable, scalable, and interoperable solutions are expected to maintain a strong position in the evolving occupancy sensor landscape.

Recent Developments:

  • In June 2025, Schneider Electric expanded its strategic partnership with NVIDIA to co-develop AI-driven systems tailored for data center infrastructure. The collaboration aims to integrate advanced occupancy sensing capabilities into AI-optimized cooling, power, and building management platforms, enhancing energy efficiency and smart automation.
  • In April 2025, Johnson Controls released a study on its OpenBlue Smart Building Platform, which integrates real-time data visibility and AI-driven energy-saving recommendations. This platform is closely linked to occupancy sensors, as such technologies are essential for optimizing building performance and reducing operating costs through smart, automated responses to occupancy data.
  • In March 2025, Texas Instruments introduced the MSPM0C1104 MCU and AMC series modulators designed for compact automation and robotics applications. These developments provide occupancy sensor manufacturers with smaller, more efficient microcontrollers and modulators that streamline device integration and improve sensor responsiveness.

Market Concentration & Characteristics:

The Global Occupancy Sensor Market exhibits moderate market concentration, with a mix of multinational corporations and regional players competing across varied application segments. It is characterized by rapid technological innovation, with firms focusing on integrating AI, IoT, and wireless communication into sensor platforms. The market features strong demand from commercial, industrial, and residential sectors, each requiring tailored solutions. Product differentiation through sensing technologies such as passive infrared, ultrasonic, and dual-technology sensors plays a key role in competitive positioning. It remains highly dynamic, with frequent product launches and continuous R&D investment driving evolution. Regulatory compliance, energy efficiency standards, and system interoperability influence buyer preferences and vendor strategies.

Report Coverage:

The research report offers an in-depth analysis based on operation, technology, building type, application, and network connectivity. It details leading market players, providing an overview of their business, product offerings, investments, revenue streams, and key applications. Additionally, the report includes insights into the competitive environment, SWOT analysis, current market trends, as well as the primary drivers and constraints. Furthermore, it discusses various factors that have driven market expansion in recent years. The report also explores market dynamics, regulatory scenarios, and technological advancements that are shaping the industry. It assesses the impact of external factors and global economic changes on market growth. Lastly, it provides strategic recommendations for new entrants and established companies to navigate the complexities of the market.

Future Outlook:

  • Rising adoption of smart building technologies will continue to drive sensor integration across commercial and residential projects.
  • Increasing global energy efficiency mandates will push demand for automated lighting and HVAC systems.
  • Advancements in AI and machine learning will enhance sensor accuracy and enable predictive control.
  • Expansion of smart city infrastructure in emerging economies will create new market opportunities.
  • Development of battery-free and energy-harvesting sensors will reduce maintenance costs and support sustainability goals.
  • Edge computing capabilities in sensors will improve real-time responsiveness and data security.
  • Growing use of LiDAR and 3D imaging technologies will support space utilization analytics in high-traffic environments.
  • Collaboration between sensor manufacturers and automation platform providers will accelerate ecosystem integration.
  • Demand for contactless and hygiene-focused automation will sustain growth in healthcare and public infrastructure.
  • Regional diversification of manufacturing and supply chains will support scalability and reduce geopolitical risks.

CHAPTER NO. 1 :             GENESIS OF THE MARKET           

1.1 Market Prelude – Introduction & Scope

1.2 The Big Picture – Objectives & Vision

1.3 Strategic Edge – Unique Value Proposition

1.4 Stakeholder Compass – Key Beneficiaries

CHAPTER NO. 2 :             EXECUTIVE LENS

2.1 Pulse of the Industry – Market Snapshot

2.2 Growth Arc – Revenue Projections (USD Million)

2.3. Premium Insights – Based on Primary Interviews      

CHAPTER NO. 3:               OCCUPANCY SENSOR MARKET FORCES & INDUSTRY PULSE        

3.1 Foundations of Change – Market Overview
3.2 Catalysts of Expansion – Key Market Drivers
3.2.1 Momentum Boosters – Growth Triggers
3.2.2 Innovation Fuel – Disruptive Technologies
3.3 Headwinds & Crosswinds – Market Restraints
3.3.1 Regulatory Tides – Compliance Challenges
3.3.2 Economic Frictions – Inflationary Pressures
3.4 Untapped Horizons – Growth Potential & Opportunities
3.5 Strategic Navigation – Industry Frameworks
3.5.1 Market Equilibrium – Porter’s Five Forces
3.5.2 Ecosystem Dynamics – Value Chain Analysis
3.5.3 Macro Forces – PESTEL Breakdown

3.6 Price Trend Analysis

    3.6.1 Regional Price Trend
3.6.2 Price Trend by product

CHAPTER NO. 4 :             KEY INVESTMENT EPICENTER    

4.1 Regional Goldmines – High-Growth Geographies

4.2 Product Frontiers – Lucrative Product Categories

4.3 Application Sweet Spots – Emerging Demand Segments

CHAPTER NO. 5: REVENUE TRAJECTORY & WEALTH MAPPING

5.1 Momentum Metrics – Forecast & Growth Curves

5.2 Regional Revenue Footprint – Market Share Insights

5.3 Segmental Wealth Flow – Operation & Technology Revenue

CHAPTER NO. 6 :             TRADE & COMMERCE ANALYSIS              

6.1.        Import Analysis by Region

6.1.1.     Global Occupancy Sensor Market Import Volume By Region

6.2.        Export Analysis by Region

6.2.1.     Global Occupancy Sensor Market Export Volume By Region

CHAPTER NO. 7 :             COMPETITION ANALYSIS            

7.1.        Company Market Share Analysis

7.1.1.     Global Occupancy Sensor Market: Company Market Share

7.1.        Global Occupancy Sensor Market Company Volume Market Share

7.2.        Global Occupancy Sensor Market Company Revenue Market Share

7.3.        Strategic Developments

7.3.1.     Acquisitions & Mergers

7.3.2.     New Product Launch

7.3.3.     Regional Expansion

7.4.        Competitive Dashboard

7.5.    Company Assessment Metrics, 2024

CHAPTER NO. 8:               OCCUPANCY SENSOR MARKET – BY OPERATION SEGMENT ANALYSIS

8.1.        Occupancy Sensor Market Overview by Operation Segment

8.1.1.     Occupancy Sensor Market Volume Share By Operation

8.1.2.     Occupancy Sensor Market Revenue Share By Operation

8.2.        Indoor

8.3.        Outdoor

CHAPTER NO. 9:               OCCUPANCY SENSOR MARKET – BY TECHNOLOGY SEGMENT ANALYSIS

9.1.        Occupancy Sensor Market Overview by Technology Segment

9.1.1.     Occupancy Sensor Market Volume Share By Technology

9.1.2.     Occupancy Sensor Market Revenue Share By Technology

9.2.        Passive Infrared (PIR)

9.3.        Ultrasonic

9.4.        Dual Technology

9.5.        Microwave

9.6.        Others

CHAPTER NO. 10:            OCCUPANCY SENSOR MARKET – BY BUILDING TYPE SEGMENT ANALYSIS

10.1.      Occupancy Sensor Market Overview by Building Type Segment

10.1.1.  Occupancy Sensor Market Volume Share By Building Type

10.1.2.  Occupancy Sensor Market Revenue Share By Building Type

10.2.      Residential

10.3.      Commercial

10.4.      Industrial

CHAPTER NO. 11:            OCCUPANCY SENSOR MARKET – BY APPLICATION SEGMENT ANALYSIS

11.1.      Occupancy Sensor Market Overview by Application Segment

11.1.1.  Occupancy Sensor Market Volume Share By Application

11.1.2.  Occupancy Sensor Market Revenue Share By Application

11.2.      Lighting Systems

11.3.      HVAC Systems

11.4.      Security and Surveillance

11.5.      Others

CHAPTER NO. 12:            OCCUPANCY SENSOR MARKET – BY NETWORK CONNECTIVITY SEGMENT ANALYSIS

12.1.      Occupancy Sensor Market Overview by Network Connectivity Segment

12.1.1.  Occupancy Sensor Market Volume Share By Network Connectivity

12.1.2.  Occupancy Sensor Market Revenue Share By Network Connectivity

12.2.      Wired Network

12.3.      Wireless Network

12.4.      Hybrid

CHAPTER NO. 13:            OCCUPANCY SENSOR MARKET – REGIONAL ANALYSIS   

13.1.      Occupancy Sensor Market Overview by Region Segment

13.1.1.  Global Occupancy Sensor Market Volume Share By Region

13.1.2.  Global Occupancy Sensor Market Revenue Share By Region

13.1.3.  Regions

13.1.4.  Global Occupancy Sensor Market Volume By Region

13.1.5.  Global Occupancy Sensor Market Revenue By Region

13.1.6.  Operation

13.1.7.  Global Occupancy Sensor Market Volume By Operation

13.1.8.  Global Occupancy Sensor Market Revenue By Operation

13.1.9.  Technology

13.1.10.               Global Occupancy Sensor Market Volume By Technology

13.1.11.               Global Occupancy Sensor Market Revenue By Technology

13.1.12.               Building Type

13.1.13.               Global Occupancy Sensor Market Volume By Building Type

13.1.14.               Global Occupancy Sensor Market Revenue By Building Type

13.1.15.               Application

13.1.16.               Global Occupancy Sensor Market Volume By Application

13.1.17.               Global Occupancy Sensor Market Revenue By Application

13.1.18.               Network Connectivity

13.1.19.               Global Occupancy Sensor Market Volume By Network Connectivity

13.1.20.               Global Occupancy Sensor Market Revenue By Network Connectivity

CHAPTER NO. 14:            NORTH AMERICA OCCUPANCY SENSOR MARKET – COUNTRY ANALYSIS           

14.1.      North America Occupancy Sensor Market Overview by Country Segment

14.1.1.  North America Occupancy Sensor Market Volume Share By Region

14.1.2.  North America Occupancy Sensor Market Revenue Share By Region

14.2.      North America

14.2.1.  North America Occupancy Sensor Market Volume By Country

14.2.2.  North America Occupancy Sensor Market Revenue By Country

14.2.3.  Operation

14.2.4.  North America Occupancy Sensor Market Volume By Operation

14.2.5.  North America Occupancy Sensor Market Revenue By Operation

14.2.6.  Technology

14.2.7.  North America Occupancy Sensor Market Volume By Technology

14.2.8.  North America Occupancy Sensor Market Revenue By Technology

14.2.9.  Building Type

14.2.10.               North America Occupancy Sensor Market Volume By Building Type

14.2.11.               North America Occupancy Sensor Market Revenue By Building Type

14.2.12.               Application

14.2.13.               North America Occupancy Sensor Market Volume By Application

14.2.14.               North America Occupancy Sensor Market Revenue By Application

14.2.15.               Network Connectivity

14.2.16.               North America Occupancy Sensor Market Volume By Network Connectivity

14.2.17.               North America Occupancy Sensor Market Revenue By Network Connectivity

14.3.      U.S.

14.4.      Canada

14.5.      Mexico

CHAPTER NO. 15:            EUROPE OCCUPANCY SENSOR MARKET – COUNTRY ANALYSIS  

15.1.      Europe Occupancy Sensor Market Overview by Country Segment

15.1.1.  Europe Occupancy Sensor Market Volume Share By Region

15.1.2.  Europe Occupancy Sensor Market Revenue Share By Region

15.2.      Europe

15.2.1.  Europe Occupancy Sensor Market Volume By Country

15.2.2.  Europe Occupancy Sensor Market Revenue By Country

15.2.3.  Operation

15.2.4.  Europe Occupancy Sensor Market Volume By Operation

15.2.5.  Europe Occupancy Sensor Market Revenue By Operation

15.2.6.  Technology

15.2.7.  Europe Occupancy Sensor Market Volume By Technology

15.2.8.  Europe Occupancy Sensor Market Revenue By Technology

15.2.9.  Building Type

15.2.10.               Europe Occupancy Sensor Market Volume By Building Type

15.2.11.               Europe Occupancy Sensor Market Revenue By Building Type

15.2.12.               Application

15.2.13.               Europe Occupancy Sensor Market Volume By Application

15.2.14.               Europe Occupancy Sensor Market Revenue By Application

15.2.15.               Network Connectivity

15.2.16.               Europe Occupancy Sensor Market Volume By Network Connectivity

15.2.17.               Europe Occupancy Sensor Market Revenue By Network Connectivity

15.3.      UK

15.4.      France

15.5.      Germany

15.6.      Italy

15.7.      Spain

15.8.      Russia

15.9.   Rest of Europe

CHAPTER NO. 16:            ASIA PACIFIC OCCUPANCY SENSOR MARKET – COUNTRY ANALYSIS

16.1.      Asia Pacific Occupancy Sensor Market Overview by Country Segment

16.1.1.  Asia Pacific Occupancy Sensor Market Volume Share By Region

16.1.2.  Asia Pacific Occupancy Sensor Market Revenue Share By Region

16.2.      Asia Pacific

16.2.1.  Asia Pacific Occupancy Sensor Market Volume By Country

16.2.2.  Asia Pacific Occupancy Sensor Market Revenue By Country

16.2.3.  Operation

16.2.4.  Asia Pacific Occupancy Sensor Market Volume By Operation

16.2.5.  Asia Pacific Occupancy Sensor Market Revenue By Operation

16.2.6.  Technology

16.2.7.  Asia Pacific Occupancy Sensor Market Volume By Technology

16.2.8.  Asia Pacific Occupancy Sensor Market Revenue By Technology

16.2.9.  Building Type

16.2.10.               Asia Pacific Occupancy Sensor Market Volume By Building Type

16.2.11.               Asia Pacific Occupancy Sensor Market Revenue By Building Type

16.2.12.               Application

16.2.13.               Asia Pacific Occupancy Sensor Market Volume By Application

16.2.14.               Asia Pacific Occupancy Sensor Market Revenue By Application

16.2.15.               Network Connectivity

16.2.16.               Asia Pacific Occupancy Sensor Market Volume By Network Connectivity

16.2.17.               Asia Pacific Occupancy Sensor Market Revenue By Network Connectivity

16.3.      China

16.4.      Japan

16.5.      South Korea

16.6.      India

16.7.      Australia

16.8.      Southeast Asia

16.9.      Rest of Asia Pacific

CHAPTER NO. 17:            LATIN AMERICA OCCUPANCY SENSOR MARKET – COUNTRY ANALYSIS

17.1.      Latin America Occupancy Sensor Market Overview by Country Segment

17.1.1.  Latin America Occupancy Sensor Market Volume Share By Region

17.1.2.  Latin America Occupancy Sensor Market Revenue Share By Region

17.2.      Latin America

17.2.1.  Latin America Occupancy Sensor Market Volume By Country

17.2.2.  Latin America Occupancy Sensor Market Revenue By Country

17.2.3.  Operation

17.2.4.  Latin America Occupancy Sensor Market Volume By Operation

17.2.5.  Latin America Occupancy Sensor Market Revenue By Operation

17.2.6.  Technology

17.2.7.  Latin America Occupancy Sensor Market Volume By Technology

17.2.8.  Latin America Occupancy Sensor Market Revenue By Technology

17.2.9.  Building Type

17.2.10.               Latin America Occupancy Sensor Market Volume By Building Type

17.2.11.               Latin America Occupancy Sensor Market Revenue By Building Type

17.2.12.               Application

17.2.13.               Latin America Occupancy Sensor Market Volume By Application

17.2.14.               Latin America Occupancy Sensor Market Revenue By Application

17.2.15.               Network Connectivity

17.2.16.               Latin America Occupancy Sensor Market Volume By Network Connectivity

17.2.17.               Latin America Occupancy Sensor Market Revenue By Network Connectivity

17.3.      Brazil

17.4.      Argentina

17.5.      Rest of Latin America

CHAPTER NO. 18:            MIDDLE EAST OCCUPANCY SENSOR MARKET – COUNTRY ANALYSIS

18.1.      Middle East Occupancy Sensor Market Overview by Country Segment

18.1.1.  Middle East Occupancy Sensor Market Volume Share By Region

18.1.2.  Middle East Occupancy Sensor Market Revenue Share By Region

18.2.      Middle East

18.2.1.  Middle East Occupancy Sensor Market Volume By Country

18.2.2.  Middle East Occupancy Sensor Market Revenue By Country

18.2.3.  Operation

18.2.4.  Middle East Occupancy Sensor Market Volume By Operation

18.2.5.  Middle East Occupancy Sensor Market Revenue By Operation

18.2.6.  Technology

18.2.7.  Middle East Occupancy Sensor Market Volume By Technology

18.2.8.  Middle East Occupancy Sensor Market Revenue By Technology

18.2.9.  Building Type

18.2.10.               Middle East Occupancy Sensor Market Volume By Building Type

18.2.11.               Middle East Occupancy Sensor Market Revenue By Building Type

18.2.12.               Application

18.2.13.               Middle East Occupancy Sensor Market Volume By Application

18.2.14.               Middle East Occupancy Sensor Market Revenue By Application

18.2.15.               Network Connectivity

18.2.16.               Middle East Occupancy Sensor Market Volume By Network Connectivity

18.2.17.               Middle East Occupancy Sensor Market Revenue By Network Connectivity

18.3.      GCC Countries

18.4.      Israel

18.5.      Turkey

18.6.      Rest of Middle East

CHAPTER NO. 19:            AFRICA OCCUPANCY SENSOR MARKET – COUNTRY ANALYSIS    

19.1.      Africa Occupancy Sensor Market Overview by Country Segment

19.1.1.  Africa Occupancy Sensor Market Volume Share By Region

19.1.2.  Africa Occupancy Sensor Market Revenue Share By Region

19.2.      Africa

19.2.1.  Africa Occupancy Sensor Market Volume By Country

19.2.2.  Africa Occupancy Sensor Market Revenue By Country

19.2.3.  Operation

19.2.4.  Africa Occupancy Sensor Market Volume By Operation

19.2.5.  Africa Occupancy Sensor Market Revenue By Operation

19.2.6.  Technology

19.2.7.  Africa Occupancy Sensor Market Volume By Technology

19.2.8.  Africa Occupancy Sensor Market Revenue By Technology

19.2.9.  Building Type

19.2.10.               Africa Occupancy Sensor Market Volume By Building Type

19.2.11.               Africa Occupancy Sensor Market Revenue By Building Type

19.2.12.               Application

19.2.13.               Africa Occupancy Sensor Market Volume By Application

19.2.14.               Africa Occupancy Sensor Market Revenue By Application

19.2.15.               Network Connectivity

19.2.16.               Africa Occupancy Sensor Market Volume By Network Connectivity

19.2.17.               Africa Occupancy Sensor Market Revenue By Network Connectivity

19.3.      South Africa

19.4.      Egypt

19.5.      Rest of Africa

CHAPTER NO. 20 :           COMPANY PROFILES     

20.1.      Signify N.V. (Philips Lighting)

20.1.1.  Company Overview

20.1.2.  Product Portfolio

20.1.3.  Financial Overview

20.1.4.  Recent Developments

20.1.5.  Growth Strategy

20.1.6.  SWOT Analysis

20.2.      Legrand S.A.

20.3.      Schneider Electric

20.4.      Johnson Controls International plc

20.5.      Honeywell International Inc.

20.6.      Eaton Corporation plc

20.7.      Acuity Brands, Inc.

20.8.      Company 8

20.9.      Company 9

20.10.    Company 10

Request Free Sample

Ready to Transform Data into Decisions?

Request Your Sample Report and Start Your Journey of Informed Choices


Providing the strategic compass for industry titans.

cr-clients-logos

Frequently Asked Questions

What is the current and projected size of the Occupancy Sensor Market?

The Global Occupancy Sensor Market was valued at USD 2,919.25 million in 2024 and is projected to reach USD 6,961.71 million by 2032, growing at a CAGR of 10.69%.

Which sectors are adopting occupancy sensors the most?

Healthcare, education, and retail sectors are major adopters due to the need for safety, automation, and space optimization.

Which region currently leads the Occupancy Sensor Market?

North America leads the market, followed by Europe and the fast-growing Asia Pacific region.

How are new technologies impacting the market?

Advancements like AI, motion detection, and wireless connectivity are making occupancy sensors smarter and more efficient.

About Author

Sushant Phapale

Sushant Phapale

ICT & Automation Expert

Sushant is an expert in ICT, automation, and electronics with a passion for innovation and market trends.

View Profile

Related Reports

Second-Hand Fashion Market

The Second-Hand Fashion Market was valued at USD 190 billion in 2024 and is projected to reach USD 422.3 billion by 2032, expanding at a CAGR of 10.5% during the forecast period.

Passenger Tire Market

The Passenger Tire Market was valued at USD 156.1 billion in 2024 and is projected to reach USD 210.3 billion by 2032, expanding at a CAGR of 3.8% during the forecast period.

Passenger Vehicles Market

The Passenger Vehicles Market was valued at USD 1705.2 billion in 2024 and is anticipated to reach USD 2805.1 billion by 2032, growing at a CAGR of 6.42% during the forecast period.

Operator Training Simulator Market

Operator Training Simulator Market size was valued at USD 12.4 billion in 2024 and is anticipated to reach USD 35.7 billion by 2032, at a CAGR of 14.1% during the forecast period.

UK Anesthesia Breathing Filters Market

The UK Anesthesia Breathing Filters Market size was valued at USD 3.75 million in 2018 to USD 4.68 million in 2024 and is anticipated to reach USD 6.35 million by 2032, at a CAGR of 3.60% during the forecast period.

Secure Logistics Market

Secure Logistics Market size was valued at USD 88 billion in 2024 and is anticipated to reach USD 136.2 billion by 2032, at a CAGR of 5.62% during the forecast period.

Zeolite Molecular Sieve Market

The Zeolite Molecular Sieve Market size was valued at USD 4609.8 million in 2024 and is anticipated to reach USD 7744.6 million by 2032, at a CAGR of 6.7% during the forecast period (2024-2032).

Non-Alcoholic Beer Market

The Non-Alcoholic Beer Market size was valued at USD 19 million in 2024 and is projected to reach USD 34.4 million by 2032, expanding at a CAGR of 7.7% during the forecast period.

Non-Alcoholic RTD Beverages Market

The Non-Alcoholic RTD Beverages Market was valued at USD 760.6 million in 2024 and is anticipated to reach USD 1178 million by 2032, growing at a CAGR of 5.62% during the forecast period.

Purchase Options

The report comes as a view-only PDF document, optimized for individual clients. This version is recommended for personal digital use and does not allow printing. Use restricted to one purchaser only.
$4999

To meet the needs of modern corporate teams, our report comes in two formats: a printable PDF and a data-rich Excel sheet. This package is optimized for internal analysis. Unlimited users allowed within one corporate location (e.g., regional office).
$6999

The report will be delivered in printable PDF format along with the report’s data Excel sheet. This license offers 100 Free Analyst hours where the client can utilize Credence Research Inc. research team. Permitted for unlimited global use by all users within the purchasing corporation, such as all employees of a single company.
$12999

Credence Staff 3

WILLIAM, North America

Support Staff at Credence Research

KEITH PHILLIPS, Europe

Lee - CR Sales Staff

LEE VALLANCE, Asia Pacific

Kieran Jameson

KIERAN JAMESON, Australia

Report delivery within 24 to 48 hours

User Review

Thank you for the data! The numbers are exactly what we asked for and what we need to build our business case.

Materials Scientist
(privacy requested)

User Review

The report was an excellent overview of the Industrial Burners market. This report does a great job of breaking everything down into manageable chunks.

Imre Hof
Management Assistant, Bekaert

cr-clients-logos

Request Sample