Market Overview
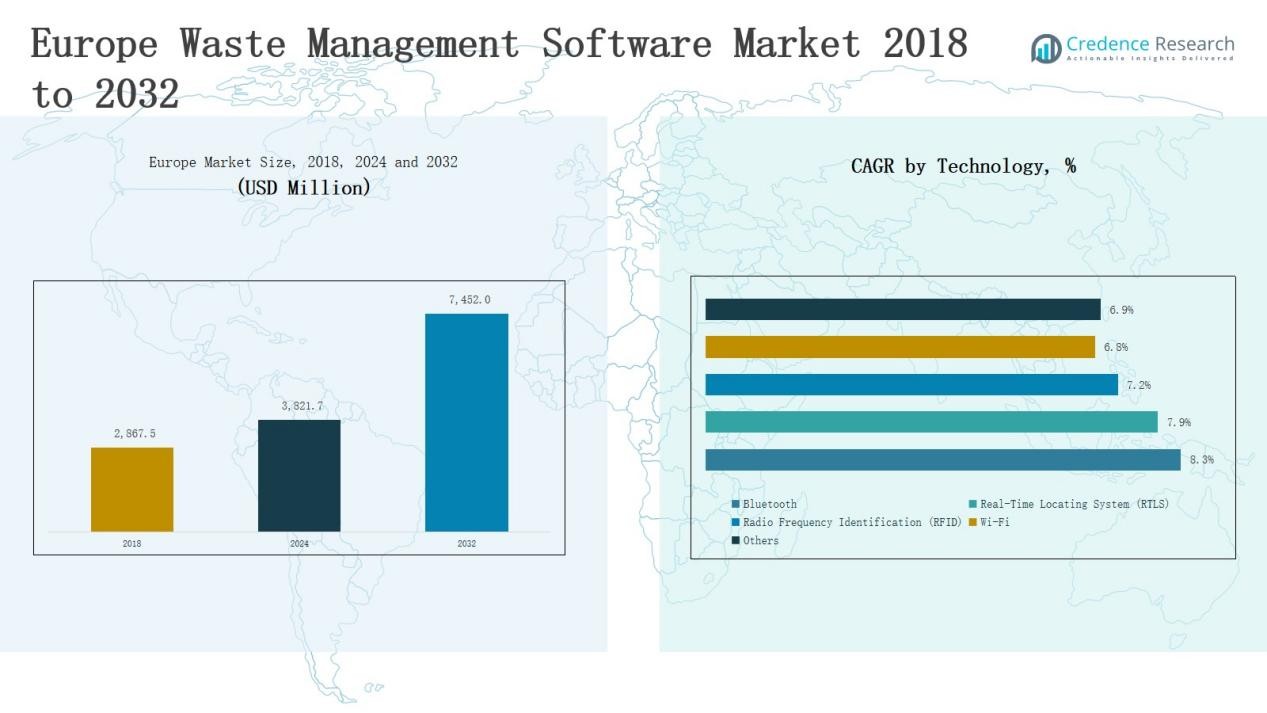
Europe Waste Management Software Market size was valued at USD 2,867.5 million in 2018 to USD 3,821.7 million in 2024 and is anticipated to reach USD 7,452.0 million by 2032, at a CAGR of 8.8% during the forecast period.
| REPORT ATTRIBUTE |
DETAILS |
| Historical Period |
2020-2023 |
| Base Year |
2024 |
| Forecast Period |
2025-2032 |
| Europe Waste Management Software Market Size 2024 |
USD 3,821.7 Million |
| Europe Waste Management Software Market, CAGR |
8.8% |
| Europe Waste Management Software Market Size 2032 |
USD 7,452.0 Million |
AMCS Group leads with end-to-end suites for municipalities and haulers. Evreka scales cloud-native deployments across multi-city contracts. Civica strengthens compliance, citizen interfaces, and PAYT billing. ISB Global integrates ERP, recycling, and hazardous waste workflows. Recy Systems AG specializes in metals trading, brokerage, and weighbridge control. Sphera, Soft-Pak, and Aurora Software enhance analytics and operations. SUEZ, TOMRA, Veolia, and Biffa leverage software with hardware ecosystems. Germany leads the Europe Waste Management Software Market with 22% share. Strong industrial and municipal adoption underpins Germany’s regional leadership.
Access crucial information at unmatched prices!
Request your sample report today & start making informed decisions powered by Credence Research Inc.!
Download Sample
Market Insights
- The Europe Waste Management Software Market was valued at USD 3,821.7 million in 2024 and is projected to reach USD 7,452.0 million by 2032, growing at a CAGR of 8.8%. Germany led with 22% share, supported by strong industrial and municipal adoption.
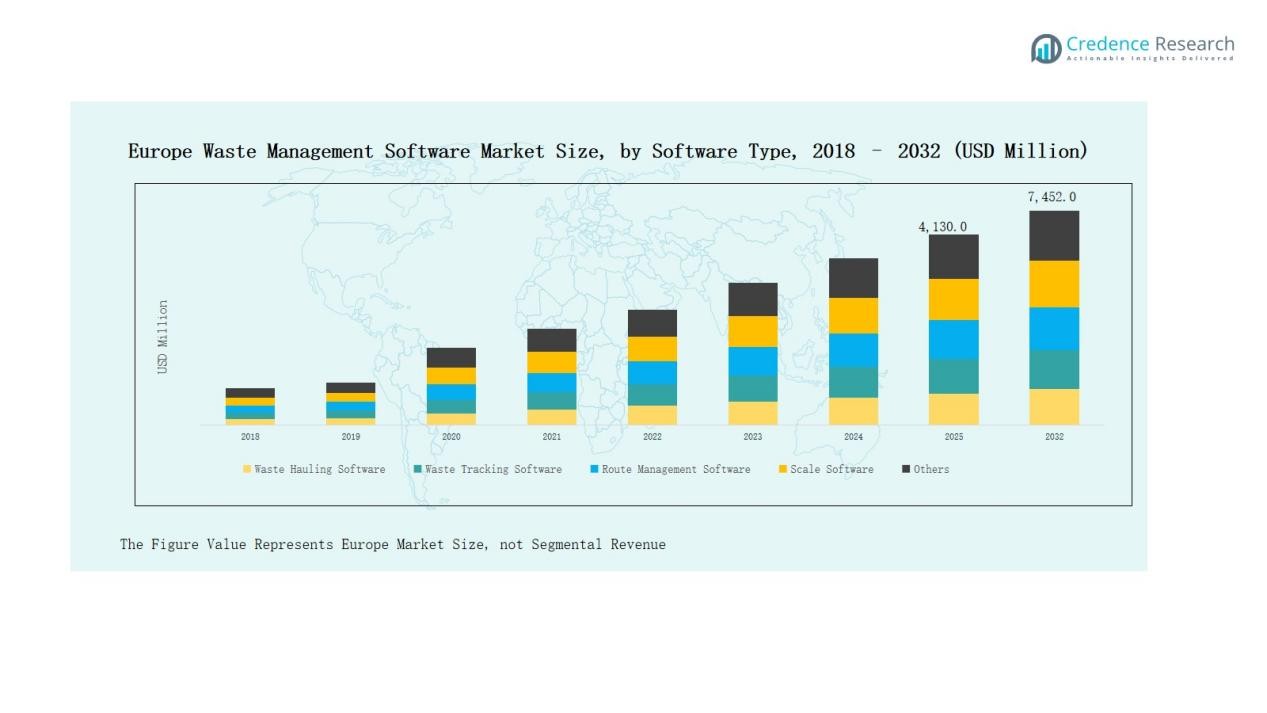
- By software type, Waste Hauling Software accounted for nearly 27% share in 2024. Municipalities adopted automated systems to streamline collections and reduce costs, further supported by integration with route management solutions.
- By application, municipal use dominated with about 46% share in 2024. Heavy investments in digital tools for EU recycling compliance, landfill diversion, and PAYT billing drove growth.
- By component, Cloud-Based Software held around 66% share in 2024. SaaS platforms gained traction due to scalability, mobile access, and compliance readiness, replacing legacy on-premise models.
- Country-wise, the UK held 18% share, France 15%, Italy 10%, Spain 8%, and Russia 7%. The Rest of Europe collectively contributed 20%, driven by Nordics, Benelux, and CEE regions with strong recycling and digital adoption.
Market Segment Insights
By Software Type
Waste Hauling Software dominated the Europe Waste Management Software Market with nearly 27% share in 2024. Growth stemmed from municipalities adopting automated systems to streamline collections and lower operating costs. Key drivers included rising fuel prices, pressure to cut emissions, and the need for efficient billing. Integration with route management further strengthened its adoption across urban waste handling contracts.
- For instance, Sensoneo’s real-time sensor and route optimization platform is used by multiple European cities, cutting waste collection costs by up to 20%.
By Application
Municipal applications held the largest position with about 46% share in 2024. Local authorities invested heavily in digital solutions to meet EU recycling mandates and landfill diversion targets. Software tools enhanced compliance reporting, bin-level monitoring, and citizen billing models such as PAYT. Expanding smart city projects and regulatory pressure reinforced municipalities as the most critical demand center in this market.
By Component
Cloud-Based Software accounted for the majority, securing around 66% share in 2024. Enterprises and municipalities preferred SaaS solutions due to cost savings, rapid deployment, and flexible scalability. Real-time data access, mobile compatibility, and automatic system upgrades attracted wide adoption. The shift away from legacy on-premise models accelerated as organizations prioritized agility and compliance readiness in dynamic regulatory environments.
- For instance, Aveva partnered with Microsoft Azure to expand its SaaS portfolio, offering more flexible cloud deployment for industrial clients with built-in compliance features.
Key Growth Drivers
Tightening EU Rules and Expanding EPR
EU directives intensify recycling, reporting, and landfill reduction targets across member states. Extended Producer Responsibility widens scope, increasing audit trails and fee accuracy needs. Municipalities require precise, auditable data across fleets, bins, scales, and vendors. Software centralizes records, automates filings, and reduces compliance risk. Real-time dashboards support inspections, subsidy eligibility, and enforcement. Country variations demand configurable rule engines and localization. Vendors embed policy libraries and update workflows. EPR fees link to packaging attributes, driving product-level traceability. Regulatory momentum sustains recurring software budgets and continuous upgrades.
- For instance, The EU imposes a €0.80 per kilogram levy on member states for non-recycled plastic packaging waste, not a direct tax on companies. Member states then decide how to finance this contribution, which can involve national taxes, passing costs to businesses like Nestlé, and requiring enhanced data reporting.
Cost Efficiency, Automation, and Route Optimization
Operators face higher fuel costs, labor gaps, and congestion charges. Software optimizes routes, balances loads, and reduces idling. Telematics and IoT enable dynamic dispatch and bin right-sizing. Scale integrations validate weights and prevent revenue leakage. Automated billing accelerates cash cycles and lowers errors. Predictive maintenance reduces breakdowns and spare part waste. Exception alerts curb missed pickups and customer churn. KPI dashboards expose inefficiencies and guide continuous improvements. Measurable savings strengthen business cases and speed procurement approvals.
- For instance, Waste Management, Inc. (WM) uses GPS-enabled telematics and route optimization software to reduce idle time, leading to a significant decrease in fuel consumption.
Circular Economy and Material Valorization
Europe shifts from disposal to material recovery and reuse. Recycling targets push granular tracking from curbside to processors. Software classifies materials, contaminants, and yields with verifiable lineage. Integration with MRF sensors validates throughput and quality. Contract modules link payments to purity and recovery outcomes. Producers seek recycled content claims supported by data. Platforms generate assurance reports aligning with CSRD and taxonomy. Transparent flows unlock premium buyers and financing. Circular economics elevates software from utility to revenue enabler.
Key Trends and Opportunities
AI, IoT, and RFID Convergence
Smart bins, RFID tags, and vehicle sensors stream continuous field data. AI predicts fill levels, contamination risk, and optimal collection windows. Computer vision grades material quality at transfer points. Predictive routing trims miles and emissions while maintaining service levels. Anomaly detection reduces fraud and ghost pickups. Data products monetize insights for brands and municipalities. Vendors package outcomes as guaranteed savings contracts. Hardware-agnostic platforms widen addressable fleets. Convergence creates new service lines and cross-sell opportunities.
- For instance, Rubicon’s platform uses machine learning to optimize waste collection routes, which has helped some customers reduce their carbon emissions by up to 20%.
Cloud-Native Platforms and Interoperability
Cloud architectures shorten deployments and simplify scaling across cities. Open APIs connect ERPs, ticketing, citizen apps, and marketplaces. App stores enable niche modules for PAYT, deposits, or bulky waste. Low-code tools speed local workflows without custom builds. Multi-tenant security lowers unit costs for smaller councils. Interoperability eases mergers and cross-border operations. Vendors bundle analytics, ESG, and compliance in unified suites. Partnerships with haulers and recyclers expand networks. Ecosystem plays drive stickiness and recurring revenue.
- For instance, the City of Prague used Sensoneo Smart Sensors in its underground bins to monitor fill levels in real-time, which helped to optimize waste collection routes and schedules.
Key Challanges
Fragmented Standards and Multijurisdiction Complexity
Europe presents diverse rules, languages, and reporting templates. Frequent policy updates strain configuration and testing cycles. Data schemas vary across producers, haulers, and facilities. Inconsistent contamination thresholds complicate benchmarking. Vendors must localize labels, units, and fee logic. Cross-border flows require harmonized identifiers and tax handling. Auditors demand traceable, immutable histories. Ensuring comparability without oversimplifying remains difficult. Complexity raises onboarding costs and prolongs time-to-value.
Legacy Integration and Data Quality Gaps
Many fleets run mixed hardware and aging on-premise systems. Missing sensors and manual inputs degrade data integrity. Batch uploads hinder real-time visibility and exceptions. Interface mismatch causes duplication, latency, and reconciliation work. Field connectivity is inconsistent across routes and sites. Vendors must support offline modes and edge caching. Master data requires cleansing and governance. Change management trains crews on new workflows. Poor data quality weakens analytics and ROI claims.
Procurement Friction, Budgets, and ROI Proof
Public tenders remain lengthy and prescriptive. Budget cycles delay modernizations despite clear savings. Buyers demand pilots, references, and outcome guarantees. Hidden costs around integrations create hesitation. Vendor lock-in concerns slow multi-year commitments. Transparent pricing and modular packaging help adoption. Payback calculators must reflect local realities. Financing options and shared-savings models ease purchase barriers. Strong ROI evidence accelerates executive and council approvals.
Regional Analysis
Germany
Germany holds 22% share of the Europe Waste Management Software Market. Manufacturing hubs drive software demand and automation. Operators deploy telematics, RFID, and onboard scales for accuracy. Municipal programs fund route optimization and contamination analytics. Enterprises prefer cloud platforms with strict data controls. Vendor ecosystems enable rapid integrations with ERPs and citizen apps. Performance-based contracts link payments to diversion and service reliability metrics.
UK
The UK holds 18% share of the Europe Waste Management Software Market. Councils adopt SaaS and PAYT for transparent billing. Data mandates require auditable reporting and performance dashboards. Net-zero funding accelerates route optimization and fleet planning. Public tenders enable multi-city rollouts and integrations. Vendors support localization, accessibility, and strict procurement standards. Interoperable APIs connect legacy systems, citizen apps, and recycling marketplaces at scale.
France
France holds 15% share of the Europe Waste Management Software Market. Circular economy law expands digital tracking requirements. Cities deploy RFID and bin sensors across metros. Cloud migrations support localization and strong security. ESG disclosures boost verified recycling analytics and dashboards. Data-sharing frameworks align producers, haulers, and MRF operators. Vendors bundle EPR fee calculators and audit-ready templates. Onboarding timelines shorten nationwide.
Italy
Italy holds 10% share of the Europe Waste Management Software Market. Regional utilities digitize collection, billing, and route balancing. Tourist areas need seasonal capacity planning and overflow control. EU programs support telematics and PAYT rollouts. Buyers pilot cloud suites, then scale deployments. Vendors integrate citizen booking tools for bulky waste pickups. Performance dashboards guide subsidy allocation and contractor accountability decisions regionwide.
Spain
Spain holds 8% share of the Europe Waste Management Software Market. Cities scale smart bins, citizen apps, and booking tools. Contract models reward diversion, purity, and reliability. Cloud platforms unify regional data hubs for oversight. IoT adoption lifts forecasting and service quality. Tourism corridors demand flexible routing during peak events. Analytics expose contamination hotspots and prioritize outreach campaigns to improve compliance rates.
Russia
Russia holds 7% share of the Europe Waste Management Software Market. Urban regions modernize tracking, billing, and facility reporting. Data residency rules shape hosting choices and architectures. Private haulers adopt route optimization to cut fuel. Localization and language support remain crucial. Public pilots focus on weighbridge control and audit readiness. Partnerships with regional integrators accelerate deployments and maintenance coverage across geographies.
Rest of Europe
Rest of Europe holds 20% share of the Europe Waste Management Software Market. Nordics, Benelux, and CEE show varied adoption paths. High recyclate targets drive material traceability platforms. Cross-border flows need interoperable identifiers and manifests. EU funding catalyzes municipal pilots and accelerators. Open-data policies encourage innovation among startups and universities. Regional marketplaces emerge for secondary materials with quality assurance and pricing transparency.
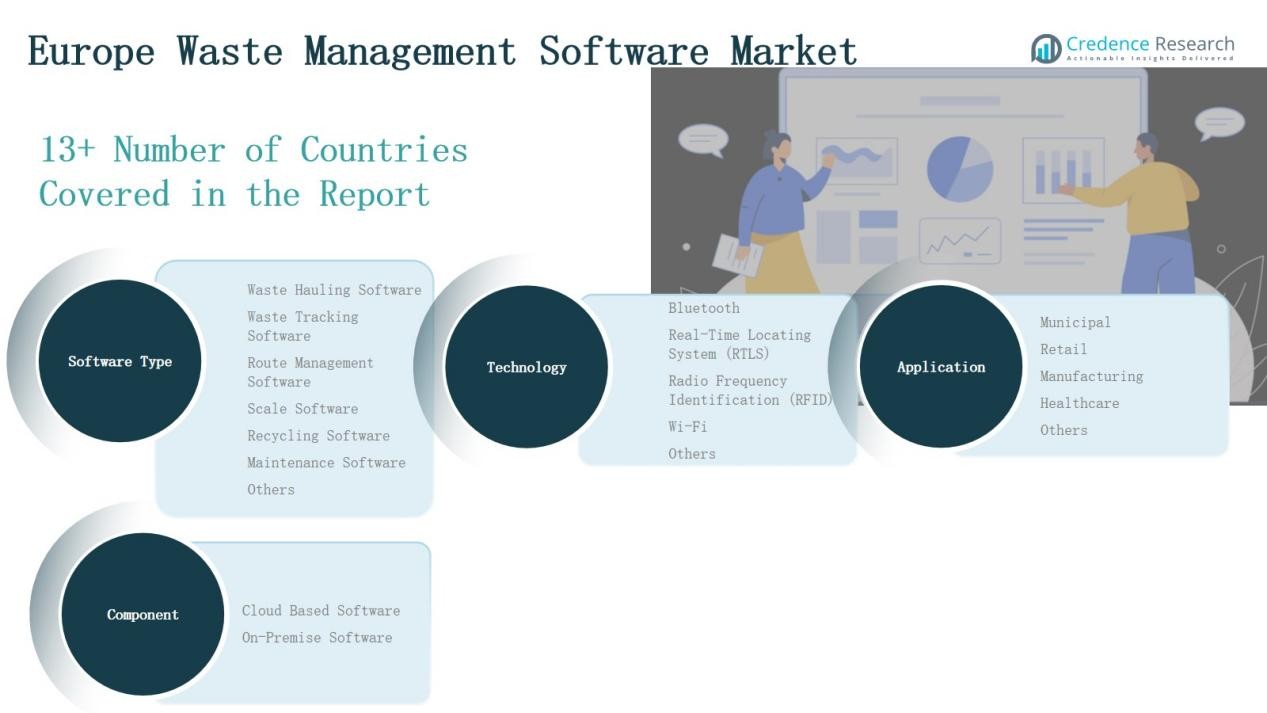
Market Segmentations:
By Software Type
- Waste Hauling Software
- Waste Tracking Software
- Route Management Software
- Scale Software
- Recycling Software
- Maintenance Software
- Others
By Application
- Municipal
- Retail
- Manufacturing
- Healthcare
- Others
By Component
- Cloud-Based Software
- On-Premise Software
By Technology
- Bluetooth
- Real-Time Locating System (RTLS)
- Radio Frequency Identification (RFID)
- Wi-Fi
- Others
By Country
- UK
- France
- Germany
- Italy
- Spain
- Russia
- Rest of Europe
Competitive Landscape
The Europe Waste Management Software Market features global suites and nimble regional specialists. Vendors target municipalities, haulers, recyclers, and industrial generators. Leaders include AMCS, Evreka, Civica, ISB Global, and Recy Systems. Integrated suites span hauling, tracking, scales, recycling, and maintenance modules. Providers differentiate through localization, compliance expertise, and rapid deployments. SaaS dominates new contracts; on-prem remains for security-sensitive clients. Hardware integrations cover RFID, telematics, onboard scales, and MRF sensors. Open APIs and connectors reduce switching costs and vendor lock-in. Go-to-market mixes direct public tenders and partner ecosystems. Pricing favors modular subscriptions and outcome-based savings agreements. Buyers value reliability, audit trails, mobile UX, and actionable analytics. Competition intensifies in the UK, Germany, and Nordics. Growth opportunities expand across Southern Europe and Central-Eastern Europe. Data sovereignty and cybersecurity remain strict qualification thresholds.
Shape Your Report to Specific Countries or Regions & Enjoy 30% Off!
Key Players
- AMCS Group
- Aurora Software
- Civica
- Envirosoft
- Evreka
- ISB Global
- Recy Systems AG
- Soft-Pak
- Sphera
- SUEZ Group
- TOMRA
- Veolia Environnement
- Biffa Group
Recent Developments
- In May 2025, Wolters Kluwer acquired Czech provider Inisoft s.r.o. to strengthen its waste-management compliance software portfolio.
- In October 2024, TOMRA Systems ASA acquired 80% of shares in C-Trace GmbH, a Germany-based digital waste management solutions company specializing in AI-driven capabilities.
- In July 2023, Suez S.A. acquired a mid-sized waste management firm focused on residential recycling services to strengthen its market position in Europe.
Report Coverage
The research report offers an in-depth analysis based on Software Type, Component, Application, Technology and Region. It details leading market players, providing an overview of their business, product offerings, investments, revenue streams, and key applications. Additionally, the report includes insights into the competitive environment, SWOT analysis, current market trends, as well as the primary drivers and constraints. Furthermore, it discusses various factors that have driven market expansion in recent years. The report also explores market dynamics, regulatory scenarios, and technological advancements that are shaping the industry. It assesses the impact of external factors and global economic changes on market growth. Lastly, it provides strategic recommendations for new entrants and established companies to navigate the complexities of the market.
Future Outlook
- Municipalities expand SaaS deployments to speed implementations and reduce costs.
- AI-powered route optimization and fill-level forecasting become standard capabilities.
- RFID and computer vision enhance material traceability and contamination control.
- EPR expansion increases producer reporting and product-level data integration.
- Interoperable APIs connect ERPs, citizen apps, and recycling marketplaces.
- Vendors offer outcome-based contracts tied to diversion, reliability, and savings.
- Data sovereignty and cybersecurity drive certifications and regional hosting choices.
- Maintenance analytics reduce fleet downtime and extend asset life.
- Cross-border waste flows require standardized IDs and auditable digital manifests.
- M&A and partnerships consolidate platforms and broaden hardware ecosystems.


