Market Overview:
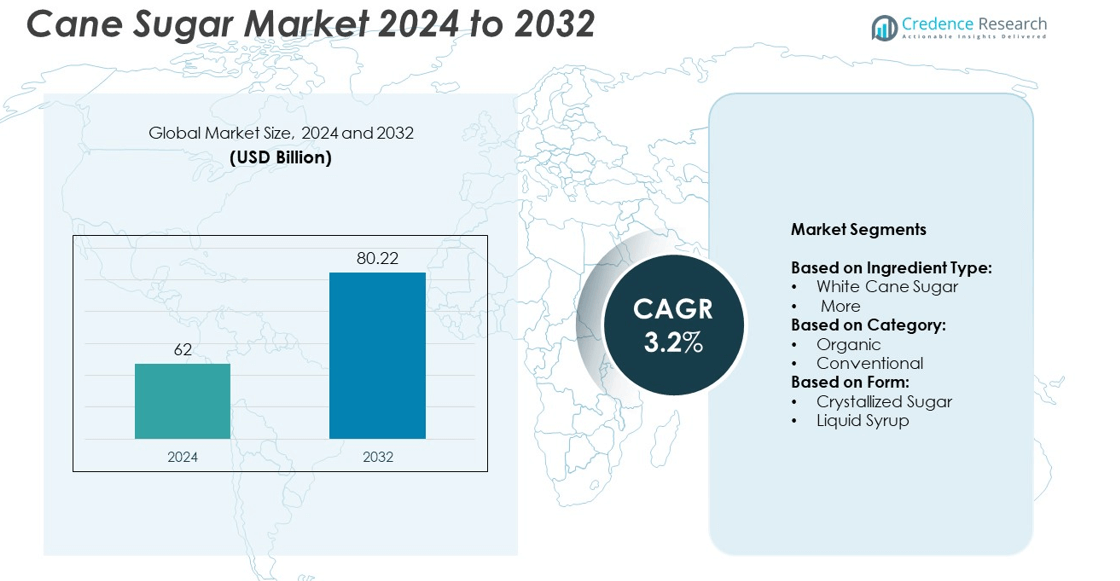
Cane Sugar market size was valued USD 62 Billion in 2024 and is anticipated to reach USD 80.22 Billion by 2032, at a CAGR of 3.2% during the forecast period.
| REPORT ATTRIBUTE |
DETAILS |
| Historical Period |
2020-2023 |
| Base Year |
2024 |
| Forecast Period |
2025-2032 |
| Cane Sugar Market Size 2024 |
USD 62 Billion |
| Cane Sugar Market, CAGR |
3.2% |
| Cane Sugar Market Size 2032 |
USD 80.22 Billion |
The cane sugar market is shaped by major players such as Bunge Limited, Louis Dreyfus Company B.V., Wilmar Sugar Australia Limited, Tate & Lyle plc, Global Organics, Ltd., Raízen, ASR Group International, Inc., DO-IT Food Ingredients BV, Biosev S.A., and Nanning Sugar Industry. These companies focus on refining capacity expansion, sustainability initiatives, and supply chain optimization to strengthen their market presence. Asia Pacific leads the global market with over 45% share in 2024, driven by strong production and consumption in India, China, and Thailand. North America and Europe follow, supported by growing demand for organic and fair-trade sugar.
Access crucial information at unmatched prices!
Request your sample report today & start making informed decisions powered by Credence Research Inc.!
Download Sample
Market Insights
- The cane sugar market was valued at USD 62 Billion in 2024 and is projected to reach USD 80.22 Billion by 2032, growing at a CAGR of 3.2% between 2025 and 2032.
- Rising demand for processed foods, beverages, and bioethanol production is driving market growth, with crystallized sugar accounting for over 75% share due to its wide use in industrial and household applications.
- Key trends include increasing adoption of organic and fair-trade sugar, sustainable farming practices, and automation in milling operations to improve efficiency and reduce costs.
- The market is moderately competitive, with leading players focusing on refining capacity expansions, portfolio diversification, and sustainability initiatives to strengthen their global footprint.
- Asia Pacific dominates with over 45% share, followed by North America at 22% and Europe at 18%, supported by strong production, high consumption, and growing imports of premium sugar varieties in these regions.
Market Segmentation Analysis:
By Ingredient Type
White cane sugar dominated the market in 2024, capturing over 65% share due to its widespread use in food and beverage manufacturing, bakery products, and confectionery applications. Its consistent texture, high sweetness profile, and cost-effectiveness make it the preferred choice for large-scale production. Demand is also driven by its versatility in household consumption and industrial applications. Growth is supported by rising consumption of packaged foods and beverages, particularly in emerging markets. Brown cane sugar and specialty sugars are gaining traction in premium products but remain a smaller segment compared to white cane sugar.
- For instance, ASR Group has refining operations able to process about 6.5 million metric tons of sugar annually.
By Category
Conventional cane sugar led the market, accounting for over 70% share in 2024, supported by high-volume production and lower price compared to organic alternatives. Its dominance is fueled by widespread availability and use in processed food and beverage industries. Conventional sugar producers benefit from well-established supply chains and large-scale refining capacity, ensuring steady demand. The organic segment is growing steadily, driven by increasing health awareness and preference for chemical-free, sustainable products, but higher production costs and limited yield restrict its adoption to niche consumer groups and premium product categories.
- For instance, Nordzucker in the 2020/21 year produced roughly 2.7 million tons of sugar from beet plus about 0.7 million tons from cane sugar.
By Form
Crystallized sugar held the largest share, exceeding 75% of the cane sugar market in 2024. This form is favored for its long shelf life, ease of transport, and wide application across confectionery, bakery, and household use. Industrial users prefer crystallized sugar for its consistent quality and compatibility with automated processing equipment. Growth is supported by rising demand for packaged food and sweetened beverages. Liquid syrup is gradually gaining adoption in beverage and dairy industries for its ease of blending and reduced processing time but remains a smaller segment compared to crystallized sugar.
Market Overview
Rising Processed Food and Beverage Consumption
Growing demand for processed foods and beverages is a major driver of the cane sugar market. Crystallized sugar remains a core ingredient in bakery, confectionery, and beverage production, supporting large-scale manufacturing. Rising urbanization and busy lifestyles fuel higher consumption of ready-to-eat products, boosting sugar requirements. Emerging markets in Asia-Pacific and Latin America are witnessing rapid expansion in packaged food industries, further driving demand. This driver is crucial as it directly impacts global production levels and encourages investment in cane cultivation and sugar refining capacity to meet rising consumption.
- For instance, the Eletsky sugar plant (owned by Sucden) processes about 10,000 tonnes of sugar beet per day.
Expansion of Industrial Applications
The use of cane sugar is expanding beyond traditional food and beverage sectors. Pharmaceutical, cosmetics, and bioethanol industries are increasingly adopting cane sugar as a key raw material. For instance, bioethanol production from cane sugar supports renewable fuel initiatives and sustainability targets. Growth in personal care products also drives sugar use in scrubs and exfoliants. This industrial diversification helps stabilize demand, reducing dependence on food markets. The driver is important for long-term market growth by opening new revenue streams and supporting producers in offsetting price volatility in core food sectors.
- For instance, India’s sugar output in 2025-26 is expected to rise to about 34.9 million tonnes.
Shift Toward Organic and Clean-Label Products
Rising consumer focus on health and wellness is driving demand for organic cane sugar and clean-label products. Consumers are increasingly avoiding synthetic additives and seeking natural sweeteners. Organic cane sugar production is growing, especially in markets with stringent food safety and sustainability standards like Europe and North America. Retailers and manufacturers are launching organic-certified products to meet this demand, which creates premium pricing opportunities. This driver is key because it shapes future market direction and encourages investment in sustainable farming practices and certifications for competitive advantage.
Key Trends & Opportunities
Sustainable and Ethical Sourcing Initiatives
Sustainability is a major trend shaping the cane sugar market. Producers are adopting fair-trade certifications, reducing water consumption, and implementing eco-friendly refining processes. Ethical sourcing initiatives attract health-conscious and environmentally aware consumers. Governments and global food brands are supporting programs that ensure better farmer incomes and traceability. This creates opportunities for suppliers who invest in transparent supply chains and sustainability reporting. Companies that promote carbon-neutral or responsibly sourced sugar gain a competitive edge, appealing to multinational food and beverage corporations seeking to enhance ESG compliance.
- For instance, U.S. Sugar Corporation farms over 230,000 acres in Florida and is the largest producer of sugarcane in the United States. The company produces over 700,000 tons of cane sugar annually, which provides nearly 8% of the nation’s sugar production.
Adoption of Advanced Processing Technologies
Automation and digitalization in sugar mills are enhancing production efficiency and quality. Modern equipment supports better juice extraction, energy recovery, and reduced processing losses. This trend lowers costs and improves consistency in sugar quality, meeting global food safety standards. Opportunities lie in upgrading existing facilities and adopting energy-efficient cogeneration systems to produce power from bagasse. Technological advancements enable producers to stay competitive while meeting environmental regulations, making this trend a significant growth opportunity for manufacturers seeking to modernize and remain profitable.
- For instance, American Crystal Sugar operates a distribution facility in Montgomery, Illinois, that includes two sugar storage domes with a combined capacity of 135,000 metric tons. The first dome, completed around 2017, holds 60,000 metric tons, while the second, constructed later, holds 75,000 metric tons.
Key Challenges
Volatility in Cane Sugar Prices
Fluctuations in raw material prices pose a major challenge for the cane sugar market. Global sugar prices are influenced by weather conditions, crop yield variations, and government policies such as export restrictions or subsidies. Price volatility impacts profit margins for producers and creates uncertainty for food manufacturers reliant on stable input costs. This challenge forces companies to adopt hedging strategies and diversify sourcing regions to reduce risk. However, prolonged volatility can still disrupt supply chains and impact affordability for end-users in price-sensitive markets.
Rising Health Concerns and Sugar Taxes
Growing health awareness and regulatory measures targeting sugar consumption present another challenge. Governments worldwide are implementing sugar taxes to combat obesity, diabetes, and other lifestyle-related diseases. This leads to reformulation efforts by food and beverage companies, reducing sugar content in products. The challenge is significant as it threatens long-term demand and pushes manufacturers to explore alternative sweeteners like stevia or monk fruit. Companies must balance product taste, cost, and compliance while maintaining consumer acceptance, which increases complexity in product development.
Regional Analysis
North America
North America held around 22% share of the cane sugar market in 2024, driven by strong demand from the food and beverage sector. The United States accounts for most of the regional consumption, supported by its large confectionery, bakery, and beverage industries. Growing interest in organic and fair-trade sugar boosts imports from Latin American producers. The rise of clean-label and sustainable product preferences also supports premium sugar demand. Canada contributes steadily through processed food production, while Mexico benefits from its strong sugarcane cultivation base, supporting both domestic consumption and exports to neighboring countries.
Europe
Europe captured approximately 18% of the global cane sugar market in 2024, with demand concentrated in countries such as the UK, Germany, and France. Imports dominate the region as limited climatic conditions restrict cane cultivation. The shift toward organic and fair-trade sugar is a major growth driver, supported by stringent EU regulations on sustainable sourcing. Food manufacturers are reformulating products to meet sugar reduction targets while maintaining taste, supporting steady demand. Increased investment in sustainable supply chains and traceability programs is helping suppliers strengthen their presence in this mature but evolving market.
Asia Pacific
Asia Pacific dominated the cane sugar market with more than 45% share in 2024, driven by strong production and consumption across India, China, Thailand, and Indonesia. India is a leading producer and consumer, benefiting from a robust domestic market and government support for sugarcane farming. Rising disposable incomes and expanding packaged food industries fuel sugar demand in developing economies. China’s beverage and confectionery sectors continue to drive steady growth. Export opportunities are also significant, as Thailand and Australia are major suppliers to global markets, supporting regional dominance in production and trade activities.
Latin America
Latin America accounted for around 10% share of the cane sugar market in 2024, with Brazil leading regional production and export activities. Brazil’s large-scale sugarcane plantations and advanced milling facilities make it a global hub for sugar and ethanol production. Rising domestic demand for processed foods and beverages adds to growth. Countries such as Colombia and Guatemala also contribute significantly to exports, meeting global supply needs. Regional producers are focusing on improving yield efficiency and adopting sustainable farming practices to strengthen competitiveness in international markets while meeting growing environmental compliance requirements.
Middle East & Africa
Middle East & Africa held close to 5% share of the cane sugar market in 2024, supported by increasing imports and growing consumption. The region relies heavily on imports from Asia and Latin America due to limited local production. Rising demand for packaged food, soft drinks, and confectionery supports sugar consumption, particularly in Gulf countries and South Africa. Governments are investing in infrastructure and refining capacity to reduce import dependency. Despite slow growth compared to other regions, urbanization and population growth continue to drive steady market expansion in key countries such as Egypt, UAE, and Nigeria.
Market Segmentations:
By Ingredient Type:
By Category:
By Form:
- Crystallized Sugar
- Liquid Syrup
By Geography:
- North America
- Europe
- UK
- France
- Germany
- Italy
- Spain
- Russia
- Rest of Europe
- Asia Pacific
- China
- Japan
- South Korea
- India
- Australia
- Southeast Asia
- Rest of Asia Pacific
- Latin America
- Brazil
- Argentina
- Rest of Latin America
- Middle East
- GCC Countries
- Israel
- Turkey
- Rest of Middle East
- Africa
- South Africa
- Egypt
- Rest of Africa
Competitive Landscape
Bunge Limited, Louis Dreyfus Company B.V., Wilmar Sugar Australia Limited, Tate & Lyle plc, Global Organics, Ltd., Raízen, ASR Group International, Inc., DO-IT Food Ingredients BV, Biosev S.A., and Nanning Sugar Industry are prominent players shaping the cane sugar market. The competitive landscape is marked by vertically integrated operations, strong distribution networks, and continuous investment in refining capacity. Companies are focusing on sustainability initiatives, including fair-trade certifications and carbon reduction programs, to meet rising consumer and regulatory expectations. Strategic expansions, joint ventures, and technology upgrades in milling processes are strengthening production efficiency and profitability. Players are also targeting growth through portfolio diversification, offering organic and specialty sugars to meet premium segment demand. Robust supply chain management, partnerships with food and beverage manufacturers, and focus on traceability solutions remain critical to maintaining market leadership and catering to the evolving needs of global customers.
Shape Your Report to Specific Countries or Regions & Enjoy 30% Off!
Key Player Analysis
- Bunge Limited
- Louis Dreyfus Company B.V.
- Wilmar Sugar Australia Limited
- Tate & Lyle plc
- Global Organics, Ltd.
- Raízen
- ASR Group International, Inc.
- DO-IT Food Ingredients BV
- Biosev S.A.
- Nanning Sugar Industry
Recent Developments
- In 2025, Bunge announced a merger agreement with Viterra, aiming to establish a leading global agribusiness solutions firm, which will likely influence its operations within the cane sugar sector.
- In 2025, Tate & Lyle unveiled an expanded ingredient portfolio and new mouthfeel innovations at IFT FIRST 2025, showing focus on consumer trends like sugar reduction.
- In 2024, Raízen projected stable sugarcane crushing volumes for the 2024/25 crop year despite less ideal weather conditions, attributing this stability to agricultural improvements.
Report Coverage
The research report offers an in-depth analysis based on Ingredient Type, Category, Form and Geography. It details leading market players, providing an overview of their business, product offerings, investments, revenue streams, and key applications. Additionally, the report includes insights into the competitive environment, SWOT analysis, current market trends, as well as the primary drivers and constraints. Furthermore, it discusses various factors that have driven market expansion in recent years. The report also explores market dynamics, regulatory scenarios, and technological advancements that are shaping the industry. It assesses the impact of external factors and global economic changes on market growth. Lastly, it provides strategic recommendations for new entrants and established companies to navigate the complexities of the market.
Future Outlook
- Cane sugar demand will rise with increasing consumption of packaged food and beverages worldwide.
- Organic and fair-trade sugar adoption will expand as consumers prefer clean-label products.
- Asia Pacific will maintain its dominance due to strong production and consumption growth.
- Investments in sustainable farming and water-efficient irrigation will improve yield and profitability.
- Digitalization and automation in sugar mills will boost efficiency and reduce production costs.
- Bioethanol production from cane sugar will gain traction with growing renewable energy initiatives.
- Governments will implement more policies supporting farmer income and sustainable cultivation practices.
- Food and beverage companies will reformulate products to balance taste and reduce sugar content.
- Strategic mergers and acquisitions will strengthen global supply chains and market reach.
- Climate change adaptation will become critical to ensuring consistent sugarcane production and supply stability.


