Market Overview
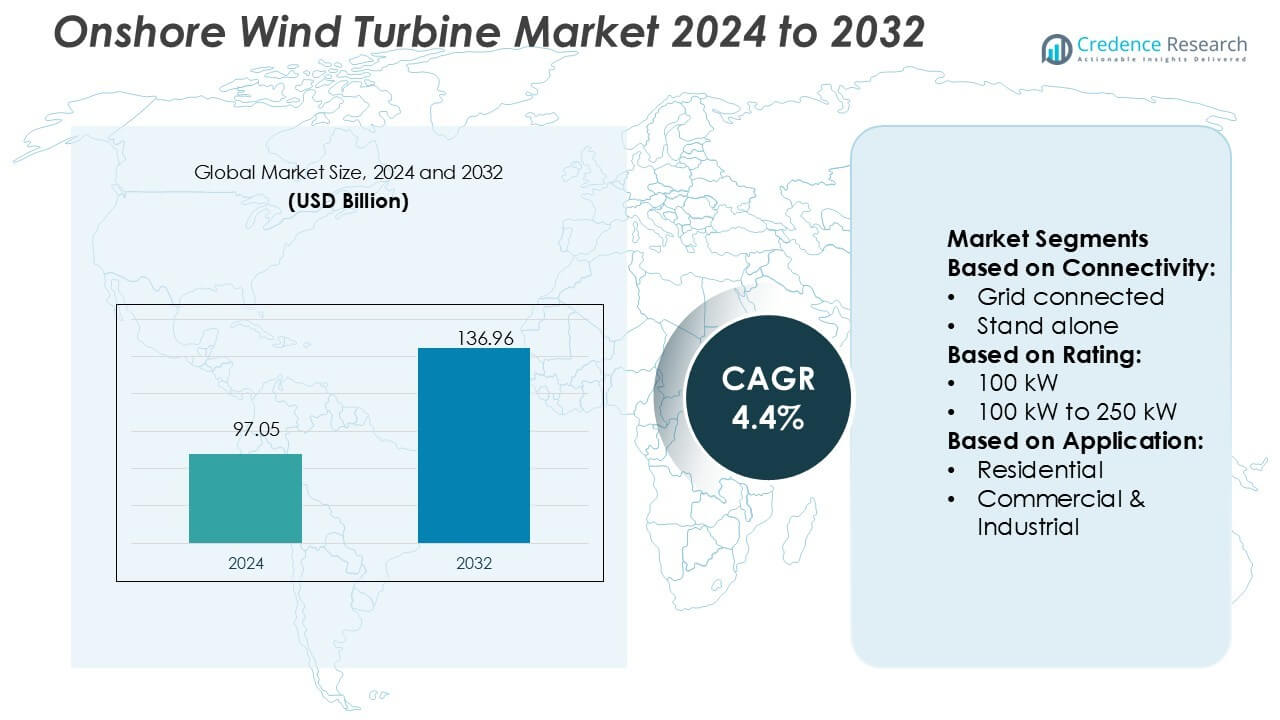
Onshore Wind Turbine Market size was valued USD 97.05 billion in 2024 and is anticipated to reach USD 136.96 billion by 2032, at a CAGR of 4.4% during the forecast period.
| REPORT ATTRIBUTE |
DETAILS |
| Historical Period |
2020-2023 |
| Base Year |
2024 |
| Forecast Period |
2025-2032 |
| Onshore Wind Turbine Market Size 2024 |
USD 97.05 Billion |
| Onshore Wind Turbine Market, CAGR |
4.4% |
| Onshore Wind Turbine Market Size 2032 |
USD 136.96 Billion |
The onshore wind turbine market is shaped by prominent players such as Vestas, Siemens Gamesa Renewable Energy, General Electric, Goldwind, Mingyang Smart Energy Group Co., Ltd., Nordex, Suzlon Energy, Envision Group, Enercon, and Senvion. These companies focus on expanding global capacity through advanced turbine designs, digital solutions, and large-scale project development. Competitive strategies include partnerships, regional expansions, and investments in high-efficiency models to meet growing renewable energy targets. Asia-Pacific emerges as the leading region, commanding 34% of the global market share in 2024. This dominance is driven by large-scale installations in China and India, supported by strong policy frameworks, cost-effective manufacturing, and rising demand for clean energy.
 Market Insights
- The onshore wind turbine market size was USD 97.05 billion in 2024 and will reach USD 136.96 billion by 2032, growing at a CAGR of 4.4%.
- Growing renewable energy targets, supportive policies, and technological advancements in turbine design act as strong drivers of market expansion.
- Key trends include larger rotor diameters, digital monitoring solutions, and rising corporate investments through power purchase agreements.
- The market faces restraints such as high capital costs, land use challenges, and regulatory delays that slow project deployment.
- Asia-Pacific leads with 34% share in 2024, driven by China and India, while the 1 MW to 2 MW segment dominates with 38% share due to its balance of efficiency and cost-effectiveness.
Access crucial information at unmatched prices!
Request your sample report today & start making informed decisions powered by Credence Research Inc.!
Download Sample
Market Segmentation Analysis:
By Connectivity
Grid-connected wind turbines dominate the market, holding over 82% share in 2024. Their strong position is driven by the need for stable integration with national grids, ensuring reliable electricity supply to urban and industrial consumers. Governments support grid-connected systems through feed-in tariffs and renewable energy mandates, strengthening adoption. These turbines also benefit from large-scale utility projects that demand consistent output and centralized control. Stand-alone systems, although growing, mainly serve rural or off-grid areas where grid expansion is limited. The demand for dependable power supply continues to fuel the growth of grid-connected solutions.
- For instance, Nordex achieved a milestone with its Delta4000 series by installing the N163/6.X turbine, which delivers a rated output exceeding 6.8 MW and features a rotor diameter of 163 meters, optimized for high-capacity grid integration in utility-scale projects.
By Rating
The 1 MW to 2 MW rating segment leads the market with 38% share in 2024. This dominance stems from their balance of efficiency, cost, and suitability for medium to large wind projects. Developers prefer this range because it delivers optimal output without the high capital intensity of larger turbines. Their scalability supports community, industrial, and utility projects across diverse geographies. Smaller ratings, such as 100 kW to 250 kW, find use in rural or residential applications, while turbines above 2 MW serve utility-scale farms. Increasing land availability and government incentives further support demand for the 1 MW to 2 MW segment.
- For instance, Vestas has deployed its V110-2.0 MW turbine, which features a 110-meter rotor diameter and generates 2,000 kW at full capacity, enabling efficient power generation even in low to medium wind speed regions.
By Application
Utility applications account for 71% of the market share in 2024, making them the leading segment. Large-scale projects drive this dominance due to rising energy needs and commitments to renewable targets. Utilities deploy multi-megawatt turbines in wind farms to supply power at grid scale, ensuring economies of scale and reduced per-unit cost. The commercial and industrial segment follows, as manufacturers and businesses invest in wind power for sustainability goals. Residential applications remain smaller in share but gain traction in rural electrification initiatives. The growing emphasis on decarbonization ensures utilities continue to spearhead wind turbine adoption globally.
Key Growth Drivers
Rising Renewable Energy Targets
Governments worldwide are enforcing stricter renewable energy mandates to cut carbon emissions. National targets and policies such as feed-in tariffs, tax incentives, and renewable portfolio standards encourage wind energy investments. Onshore wind turbines gain traction as they offer scalable, low-cost renewable solutions. Increasing international agreements on climate action further accelerate project deployment. The clear push for decarbonization, supported by regulatory frameworks, creates a favorable environment for utilities and private players to expand wind projects. This regulatory momentum remains a critical growth driver for the onshore wind turbine market.
- For instance, Mingyang Smart Energy developed the MySE 6.25-172 onshore wind turbine, which delivers a rated output of 6.25 MW with a rotor diameter of 172 meters, capable of producing over 20 million kWh annually under average wind conditions, aligning with national renewable energy mandates for grid integration.
Technological Advancements in Turbine Design
Ongoing innovations in turbine technology enhance efficiency, reliability, and cost-effectiveness. Larger rotor diameters, higher hub heights, and improved blade materials deliver increased energy yields, even at low wind speeds. Advanced digital monitoring and predictive maintenance reduce downtime and operational costs. Modular and flexible designs also enable faster installation across diverse terrains. These innovations significantly lower the levelized cost of energy (LCOE), making wind more competitive with fossil fuels. Enhanced performance and cost efficiency continue to drive widespread adoption of onshore wind turbines in global energy transition strategies.
- For instance, Envision Group launched its EN-220/10MW onshore turbine equipped with a 220-meter rotor and 10 MW rated capacity, featuring carbon-fiber reinforced blades and incorporating a digital twin platform that uses predictive analytics to reduce unplanned downtime and optimize performance.
Increasing Private Sector Investments
Private investors and energy companies are accelerating capital inflows into wind projects to diversify energy portfolios. Growing demand for green financing and sustainable bonds is boosting onshore wind project funding. Independent power producers and industrial firms increasingly partner with technology providers for long-term power purchase agreements (PPAs). These financial commitments ensure stable revenue flows and attract further investors. Private sector participation complements government support by accelerating large-scale deployments. Rising investor confidence and profitability expectations strengthen the growth outlook for the onshore wind turbine market globally.
Key Trends & Opportunities
Digitalization and Smart Wind Operations
Digital solutions such as AI, IoT, and cloud platforms are reshaping wind farm operations. Predictive analytics improve performance monitoring, while automated controls optimize turbine output under varying wind conditions. Smart sensors detect faults early, reducing maintenance costs and downtime. Digital integration also enhances grid balancing by enabling real-time energy flow adjustments. These advancements support more resilient and efficient wind operations, creating opportunities for technology providers and utilities. The digitalization of wind energy is emerging as a key trend that boosts operational efficiency and profitability.
- For instance, the SG 5.2-165 onshore model features a 165 m rotor diameter, delivers 5.2 MW rated power, and sweeps 21,383 m² of area. On the offshore side, their SG 14-222 DD turbine uses a 222 m rotor diameter and 108 m blade length.
Expansion into Emerging Markets
Emerging economies present significant opportunities due to abundant wind resources and growing energy demand. Countries in Asia, Latin America, and Africa are launching large-scale onshore projects to reduce dependence on fossil fuels. Favorable policies, infrastructure investments, and global financing initiatives are accelerating adoption. Multinational players are entering these regions through joint ventures and local partnerships. With strong potential for cost-effective deployment, emerging markets provide a strategic growth frontier for developers. Expansion into these regions positions companies to capture new revenue streams and strengthen global competitiveness.
- For instance, Goldwind has deployed turbines, such as the GW165-6.0 MW model with a 165-meter rotor and 110-meter hub height, at the Castle Wind Farm in South Africa, contributing to local grid stability and reducing reliance on imported fossil fuels.
Key Challenges
Land Use and Environmental Concerns
Securing suitable land for wind projects remains a significant challenge. Conflicts often arise over land acquisition, local community interests, and environmental impact assessments. Wind farms can face opposition due to noise concerns, wildlife risks, and visual impact on landscapes. Lengthy approval processes and regulatory hurdles delay project timelines. Balancing renewable energy development with biodiversity preservation and community acceptance is critical. These land-related challenges increase project costs and slow deployment, limiting the speed of market expansion in certain geographies.
High Capital and Infrastructure Costs
Onshore wind projects demand substantial upfront investment in turbines, construction, and grid integration. Costs rise further in remote or complex terrains requiring specialized infrastructure. Limited access to financing in developing regions adds to the challenge. High transmission and distribution expenses also impact project economics, especially for large-scale farms. Although declining turbine costs help, overall capital intensity remains a barrier for smaller developers. The need for reliable financing models and government-backed incentives is essential to overcome this financial challenge in the onshore wind turbine market.
Regional Analysis
North America
North America holds a 24% share in the onshore wind turbine market, driven by strong renewable energy policies in the U.S. and Canada. Federal tax incentives, state-level renewable portfolio standards, and corporate power purchase agreements fuel large-scale deployments. The region benefits from advanced infrastructure, skilled workforce, and active private investments in wind projects. Expansions in Texas and the Midwest highlight the U.S. as a global wind hub, while Canada focuses on integrating wind into its clean energy mix. Continuous technological upgrades and supportive regulations sustain North America’s role as a key contributor to market growth.
Europe
Europe accounts for 28% of the onshore wind turbine market, supported by ambitious climate policies and green energy targets. Countries such as Germany, Spain, and the UK lead in installed capacity due to strong subsidies and long-term renewable commitments. The European Union’s Green Deal further accelerates investment in clean technologies, enhancing regional adoption. Modernization of existing fleets and integration of digital solutions strengthen operational efficiency. While land availability challenges exist, collaborative cross-border grid projects and sustainability-driven financing provide momentum. Europe’s regulatory leadership and advanced technology landscape secure its significant share in the global market.
Asia-Pacific
Asia-Pacific dominates the onshore wind turbine market with a 34% share in 2024. China leads global installations, supported by large-scale government programs and cost-competitive turbine production. India follows with strong policy support, while countries such as Australia, Vietnam, and Japan expand rapidly. Growing urbanization, rising energy demand, and supportive renewable targets strengthen the region’s position. Local manufacturing capabilities reduce costs, enabling faster adoption. Favorable financing initiatives and international partnerships also expand project pipelines. With vast wind resources and accelerating capacity additions, Asia-Pacific remains the global leader in onshore wind deployment.
Latin America
Latin America represents 8% of the onshore wind turbine market, led by Brazil, Mexico, and Chile. Abundant wind resources and competitive project costs attract global developers. Brazil’s auctions for renewable energy projects and Mexico’s industrial demand drive large-scale installations. Chile emphasizes wind adoption to diversify its renewable portfolio and reduce reliance on hydropower. International financing and partnerships with multinational energy firms boost investment flows. Although regulatory uncertainty and grid limitations pose challenges, ongoing reforms strengthen regional potential. Latin America’s growing renewable ecosystem positions it as an emerging growth frontier for the wind turbine market.
Middle East & Africa
The Middle East & Africa region holds a 6% share in the onshore wind turbine market. Countries like South Africa, Morocco, and Egypt spearhead adoption through national renewable energy programs. Abundant land availability and high wind potential create favorable conditions for large-scale projects. Governments encourage foreign investment through public-private partnerships and supportive frameworks. While infrastructure gaps and financing challenges remain, international collaborations help bridge these barriers. The UAE and Saudi Arabia are also entering the sector as part of diversification strategies. Growing regional initiatives establish the Middle East & Africa as an evolving market for onshore wind energy.
Market Segmentations:
By Connectivity:
- Grid connected
- Stand alone
By Rating:
By Application:
- Residential
- Commercial & Industrial
By Geography
- North America
- Europe
- UK
- France
- Germany
- Italy
- Spain
- Russia
- Belgium
- Netherlands
- Austria
- Sweden
- Poland
- Denmark
- Switzerland
- Rest of Europe
- Asia Pacific
- China
- Japan
- South Korea
- India
- Australia
- Thailand
- Indonesia
- Vietnam
- Malaysia
- Philippines
- Taiwan
- Rest of Asia Pacific
- Latin America
- Brazil
- Argentina
- Peru
- Chile
- Colombia
- Rest of Latin America
- Middle East
- UAE
- KSA
- Israel
- Turkey
- Iran
- Rest of Middle East
- Africa
- Egypt
- Nigeria
- Algeria
- Morocco
- Rest of Africa
Competitive Landscape
The onshore wind turbine market features strong competition with leading players including Suzlon Energy, Nordex, Vestas, Mingyang Smart Energy Group Co., Ltd., Envision Group, Senvion, Siemens Gamesa Renewable Energy, Goldwind, Enercon, and General Electric. The onshore wind turbine market is highly competitive, driven by rapid technological advancements and evolving energy policies. Companies compete on innovation, focusing on higher capacity turbines, improved blade designs, and digital monitoring systems to enhance efficiency and reduce costs. Market dynamics are shaped by large-scale utility projects, cross-border collaborations, and government-backed renewable energy programs that encourage investment. Increasing demand for sustainable energy solutions pushes firms to expand their global presence, particularly in emerging markets. Competitive differentiation often relies on cost optimization, operational reliability, and alignment with long-term climate and sustainability goals.
Shape Your Report to Specific Countries or Regions & Enjoy 30% Off!
Key Player Analysis
- Suzlon Energy
- Nordex
- Vestas
- Mingyang Smart Energy Group Co., Ltd.
- Envision Group
- Senvion
- Siemens Gamesa Renewable Energy
- Goldwind
- Enercon
- General Electric
Recent Developments
- In May 2025, Haventus and Sarens, the UK-based companies PSG, have developed a low-cost solution for the integration and launch of floating offshore wind turbines. The company said that the installations will be offshore and will also cut down the costs and accelerate floating offshore wind deployment.
- In May 2025, ZF Wind Power launched India’s largest 13.2MW test rig in Coimbatore. This modern test rig is used for comprehensive testing and validation of gearboxes and powertrains, ensuring they can withstand the rigorous demands of modern wind turbines.
- In February 2025, Iberdrola through its U.S. company Avangrid, installed the capacity of nearly 10,500 MW in the country. It has assets in 24 states and is capable of supplying approximately average households. It will further provide key economic benefits to communities, supporting more than 500 permanent jobs and paying more than in property taxes in 2024.
- In January 2025, Vestas received a 384 MW order for the second phase of DTEK’s Tyligulska project in Ukraine. This adds to the 114 MW Tyligulska I order which the company successfully commissioned in the spring of 2023. The company will supply 64 wind turbines and is responsible for the supply, delivery, and commissioning of the turbines.
Report Coverage
The research report offers an in-depth analysis based on Connectivity, Rating, Application and Geography. It details leading market players, providing an overview of their business, product offerings, investments, revenue streams, and key applications. Additionally, the report includes insights into the competitive environment, SWOT analysis, current market trends, as well as the primary drivers and constraints. Furthermore, it discusses various factors that have driven market expansion in recent years. The report also explores market dynamics, regulatory scenarios, and technological advancements that are shaping the industry. It assesses the impact of external factors and global economic changes on market growth. Lastly, it provides strategic recommendations for new entrants and established companies to navigate the complexities of the market.
Future Outlook
- The market will expand steadily with rising global renewable energy targets.
- Technological innovations will increase turbine efficiency and reduce operating costs.
- Larger rotor sizes and taller towers will improve energy capture in low-wind areas.
- Digitalization will enhance predictive maintenance and boost operational reliability.
- Emerging economies will drive growth with new large-scale wind projects.
- Corporate power purchase agreements will fuel investments from private industries.
- Government incentives and favorable policies will continue to support deployment.
- Sustainability initiatives will encourage eco-friendly materials in turbine manufacturing.
- Grid integration solutions will strengthen reliability of large wind farms.
- Increasing partnerships and mergers will reshape the competitive landscape.


